Alternative Sweeteners Market Size and Share
Market Overview
| Study Period | 2021 - 2031 |
|---|---|
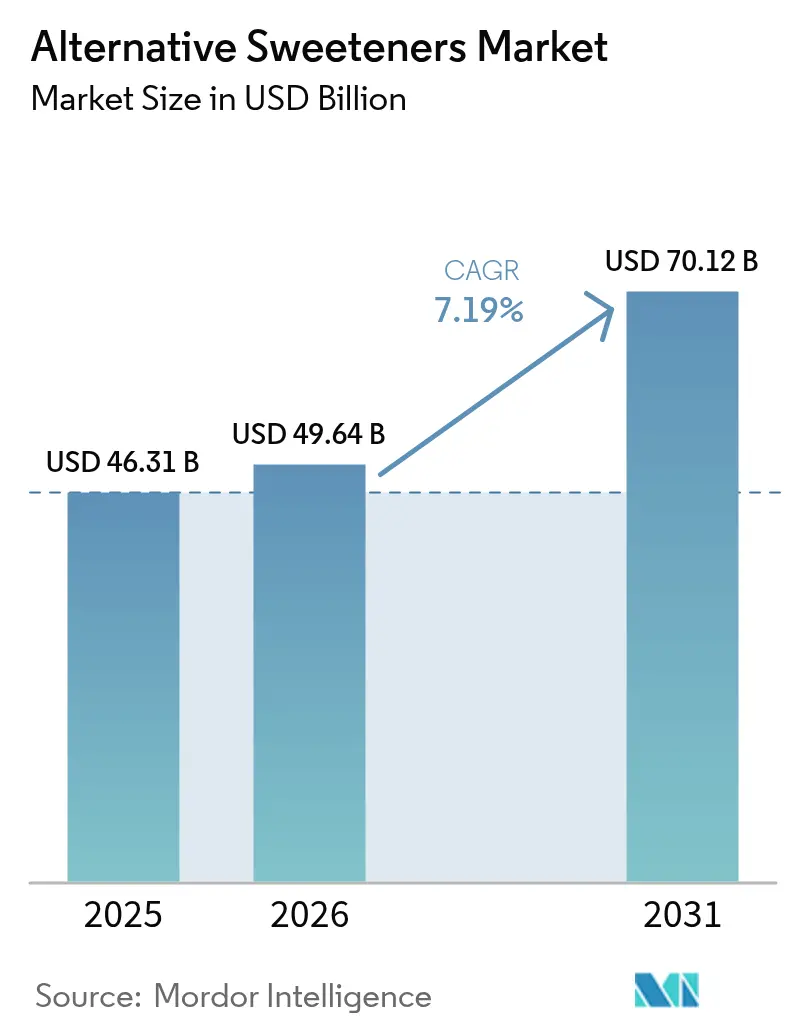
| Market Size (2026) | USD 49.64 Billion |
| Market Size (2031) | USD 70.12 Billion |
| Growth Rate (2026 - 2031) | 7.19% CAGR |
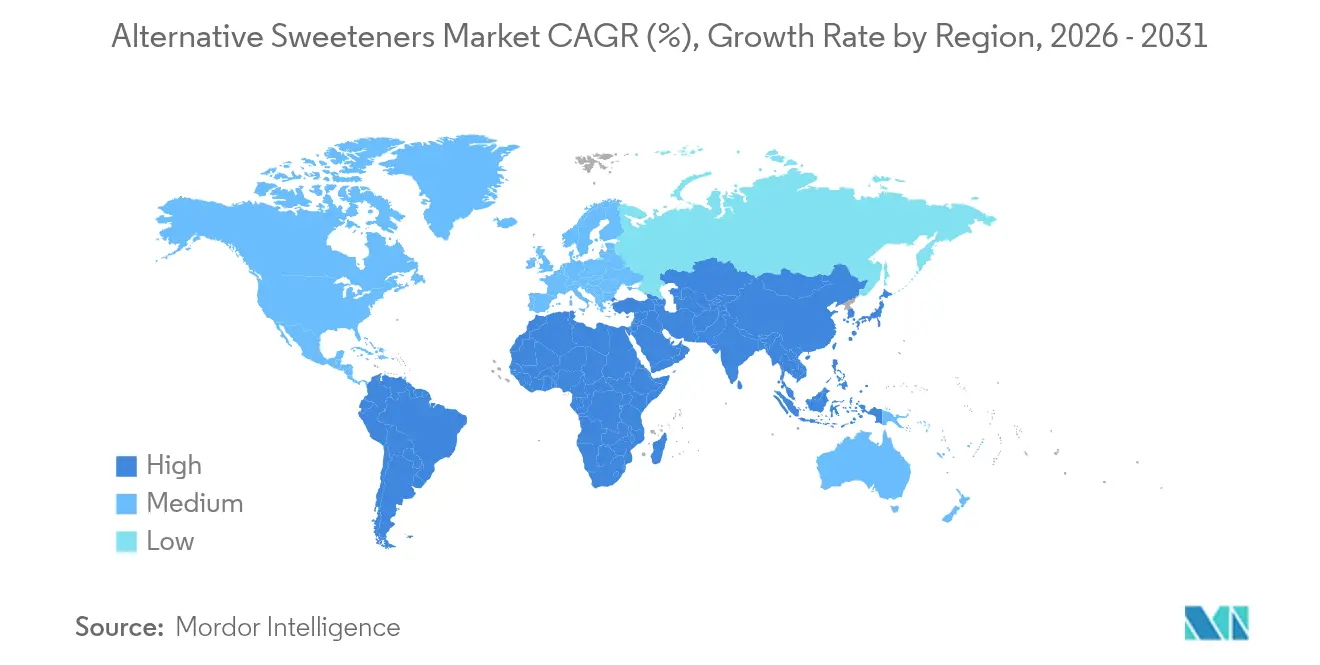
| Fastest Growing Market | Middle East and Africa |
| Largest Market | Asia Pacific |
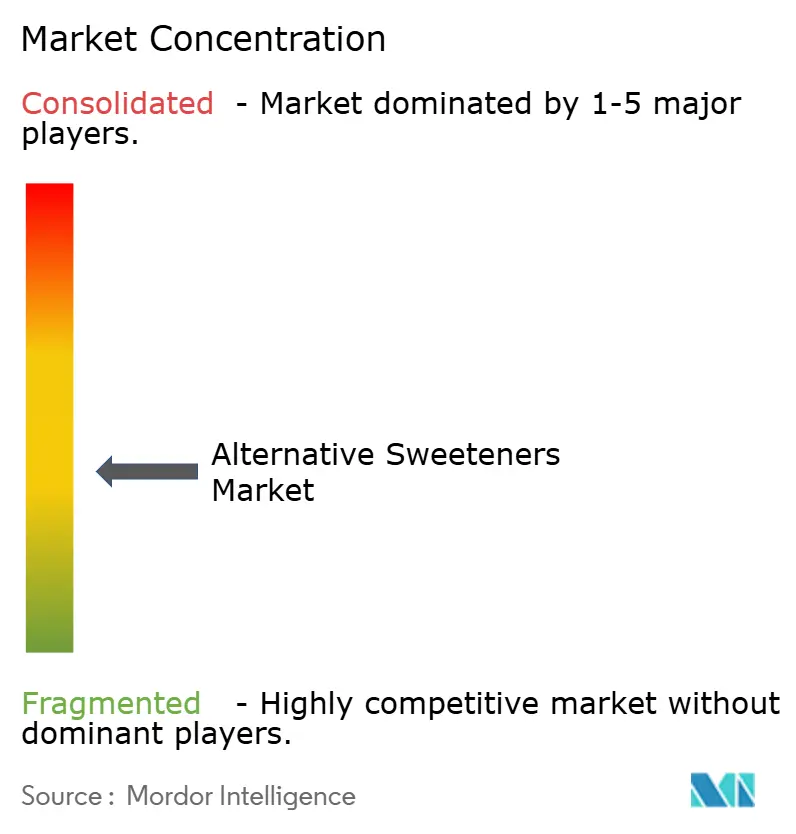
| Market Concentration | Medium |
Major Players
*Disclaimer: Major Players sorted in no particular order Image © Mordor Intelligence. Reuse requires attribution under CC BY 4.0. |
|
Alternative Sweeteners Market Analysis by Mordor Intelligence
The alternative sweeteners market size in 2026 is estimated at USD 49.64 billion, growing from 2025 value of USD 46.31 billion with 2031 projections showing USD 70.12 billion, growing at 7.19% CAGR over 2026-2031. The expansion is propelled by fiscal policies that penalize sugar, rapid breakthroughs in precision-fermentation, and a pronounced consumer tilt toward low-calorie foods. Asia-Pacific remains the leading regional market, supported by rapid urbanization and rising health concerns like diabetes, while the Middle East and Africa is emerging as a key growth frontier. High-intensity sweeteners, particularly those using improved steviol glycosides and innovative sweet proteins, are steadily gaining ground, gradually challenging the dominance of high-fructose corn syrup. Meanwhile, natural sweeteners are carving out a premium niche, appealing to health-conscious consumers who value clean-label products. Despite these positive trends, challenges such as high production costs, fluctuations in raw material availability, and concerns over product shelf life continue to limit broader adoption, especially in markets where price sensitivity shapes purchasing decisions.
Key Report Takeaways
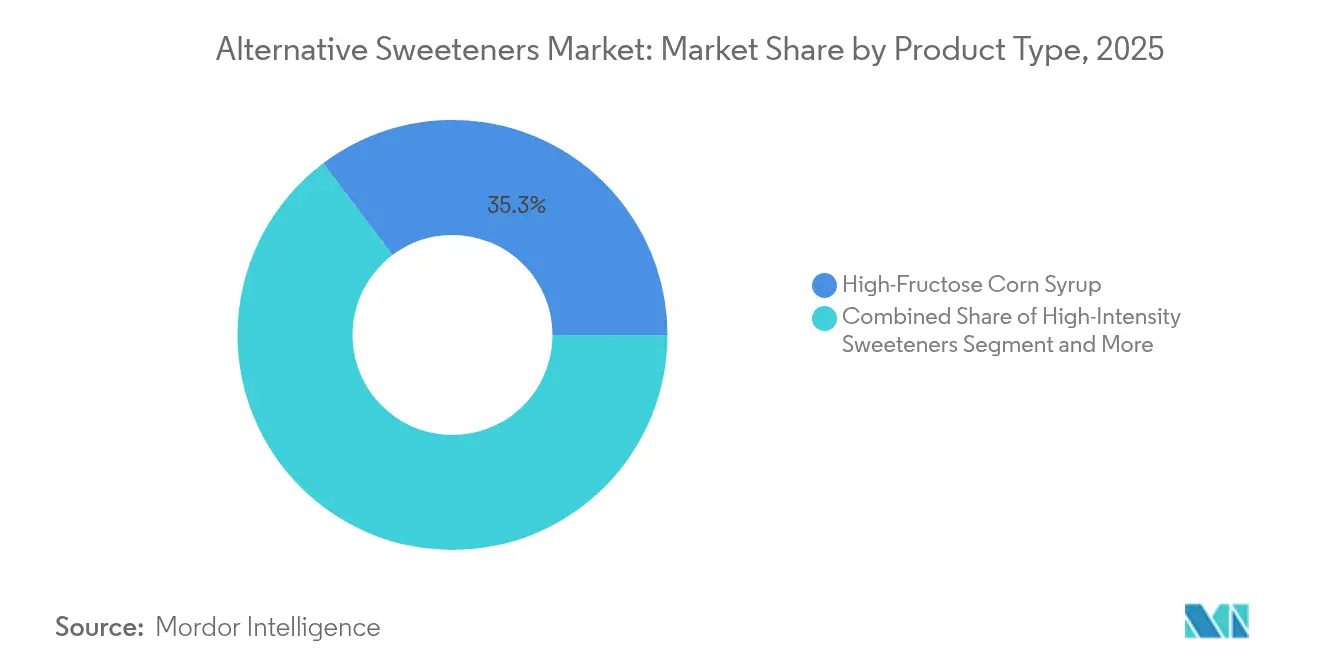
- By product type, high-fructose corn syrup held 35.27% of the alternative sweeteners market share in 2025, while high-intensity sweeteners are advancing at a 9.31% CAGR to 2031.
- By source, artificial sweeteners commanded 54.62% share of the alternative sweeteners market size in 2025; natural sweeteners are forecast to climb at an 8.55% CAGR through 2031.
- By form, solid formats captured 60.45% revenue in 2025, whereas liquid alternatives expand fastest at an 8.17% CAGR between 2026-2031.
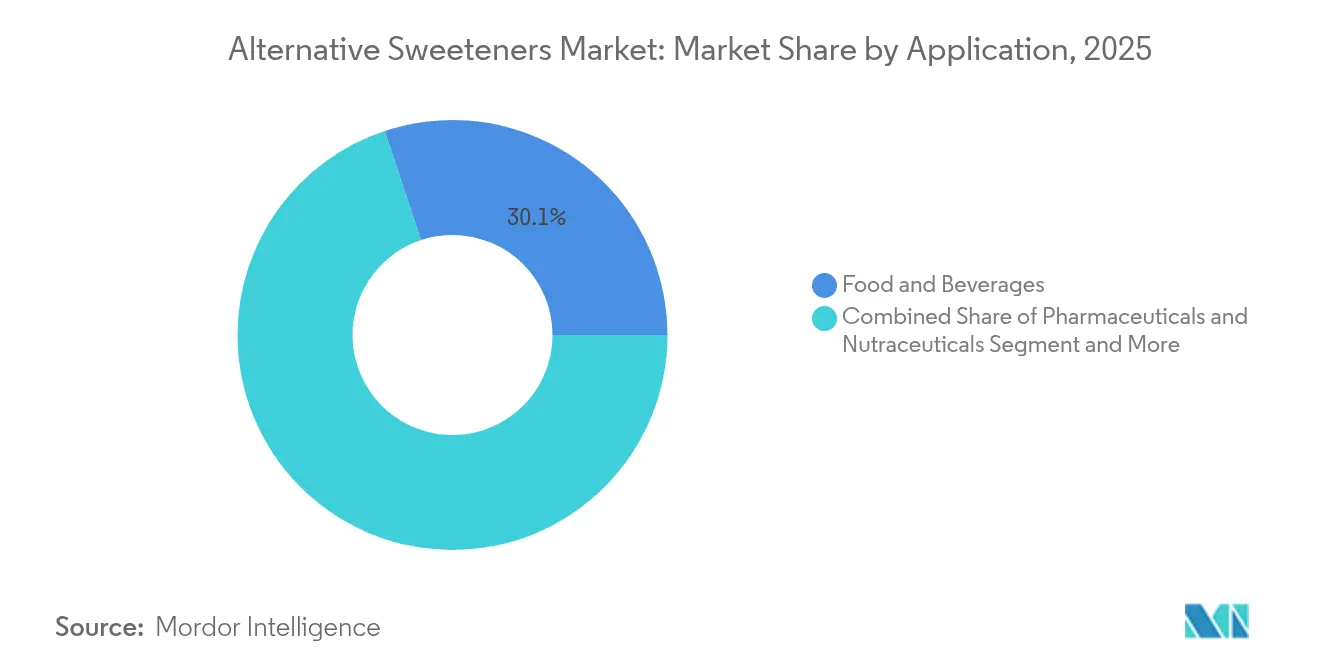
- By application, the food segment led with 30.11% revenue in 2025; pharmaceuticals and nutraceuticals recorded the sharpest 8.44% CAGR to 2031.
- By geography, Asia-Pacific contributed 34.32% revenue in 2025; the Middle East and Africa are poised for a 7.33% CAGR to 2031.
Note: Market size and forecast figures in this report are generated using Mordor Intelligence’s proprietary estimation framework, updated with the latest available data and insights as of 2026.
Global Alternative Sweeteners Market Trends and Insights
Drivers Impact Analysis*
| Drivers | (~) % Impact on CAGR Forecast | Geographic Relevance | Impact Timeline |
|---|---|---|---|
| Rising health consciousness and increasing prevalence of lifestyle diseases | +1.8% | Global, with highest impact in developed markets | Medium term (3-4 years) |
| Government regulations supporting sugar reduction and the implementation of sugar taxes across regions | +1.5% | Europe, North America, with spillover to Asia-Pacific | Short term (≤2 years) |
| Technological advancements in sweetener development, particularly in taste profiles and solubility, enhance product adoption. | +1.2% | Global, with initial impact in developed markets | Medium term (3-4 years) |
| Growing consumer preference for low-calorie and sugar-free products | +1.0% | Global, with highest impact in urban centers | Short term (≤2 years) |
| Increased research and development in the sweeteners domain. | +0.8% | Developed markets with strong research infrastructure | Long term (≥5 years) |
| Expanding applications of alternative sweeteners in food and beverages. | +0.7% | Global, with focus on emerging applications | Medium term (3-4 years) |
| Source: Mordor Intelligence | |||
Rising Health Consciousness and Increasing Prevalence of Lifestyle Diseases
The global food and beverage industry is experiencing a significant transformation due to increasing health-conscious consumption patterns. According to the Supply Side Food and Beverage Journal (2025), 36% of consumers are actively reducing their sugar intake, while 56% avoid products with artificial sweeteners. This consumer behavior creates formulation challenges for manufacturers who must balance sweetness, taste, and functionality while meeting clean-label requirements. Consumers are focusing beyond calorie reduction to consider the metabolic and digestive effects of sweeteners, particularly their glycemic response and gut health impact. Natural low-calorie sweeteners, including allulose, monk fruit, and tagatose, are gaining market acceptance. Tagatose stands out for its low glycemic index and prebiotic properties that support gut microbiota. The U.S. Food and Drug Administration (FDA) has reinforced the potential of these alternative sweeteners by granting classifications such as generally recognized as safe (GRAS) status to tagatose and similar ingredients. Research and development teams are now focusing on multifunctional sweeteners that reduce sugar content while providing additional health benefits. These sweeteners are becoming essential components in functional foods, beverages, and nutraceutical formulations.
Government Regulations Supporting Sugar Reduction and the Implementation of Sugar Taxes across Regions
Sugar taxes and other regulatory measures aimed at reducing sugar consumption are creating new market opportunities for alternative sweeteners. The sugar tax in the UK demonstrated a significant impact on consumption patterns, as children's daily sugar intake from soft drinks decreased from 70g to 45g within one year of implementation, according to the Journal of Epidemiology and Community Health. The World Health Organization's recommendation to limit free sugar intake to below 5% of total calorie consumption has influenced global regulatory trends. These regulations are driving manufacturers to reformulate their products to avoid tax thresholds, increasing the demand for alternative sweetening ingredients. Several countries, including Mexico, France, and Norway, have implemented similar sugar taxes, while others, like India and Australia, are considering such measures. Additionally, major beverage manufacturers have pledged to reduce sugar content across their product portfolios by 2025, further driving innovation in alternative sweeteners.
Technological Advancements in Taste Profiles and Solubility Enhance Product Adoption
Precision fermentation is reshaping the sweetener market by enabling the efficient and scalable production of proteins such as brazzein, thaumatin, and monellin. These proteins offer sweetness levels up to 5,000 times greater than sugar while being metabolized like standard proteins, effectively mitigating health concerns associated with sugar and artificial sweeteners. The process also delivers significant environmental benefits, reducing land and water usage by 60-90% compared to traditional sugar production methods, aligning with the growing demand for sustainable food production solutions. Companies like Oobli, Joywell Foods, and Amai Proteins are at the forefront of this innovation, utilizing precision fermentation to develop sweeteners that can lower sugar content in foods and beverages by up to 90%, all while maintaining the desired taste profiles. This breakthrough is particularly transformative for product categories such as soft drinks, confectionery, and baked goods, where reducing sugar content has historically been a challenge due to the need to balance taste, texture, and functionality.
Growing Consumer Preference for Low-calorie and Sugar-free Products
The alternative sweeteners market is transforming due to consumers' increasing preference for natural, plant-based options over synthetic alternatives. This change is influencing competition across food and beverage sectors, particularly in beverages, where 77% of global consumers examine sweetener types in their drinks, according to the data from Supply Side Food and Beverage Journal. The demand for natural sweeteners is driving innovation in botanical and biotechnological formulations. Stevia and monk fruit are emerging as primary plant-derived sweetener options. While early versions faced challenges with bitter aftertastes and inconsistent sweetness, new fermentation technologies and glycoside isolation methods are improving their taste profiles and sweetness consistency. Companies like Cargill and Ingredion are investing in steviol glycoside development (including Reb M and Reb D), while biotechnology companies use precision fermentation to develop sustainable sweetener alternatives. These developments allow food and beverage manufacturers to create clean-label products while maintaining taste, texture, and functionality.
Restraint Impact Analysis*
| Restraint | (~) % Impact on CAGR Forecast | Geographic Relevance | Impact Timeline |
|---|---|---|---|
| Stringent regulatory requirements and lengthy approval processes for new alternative sweeteners | -1.2% | Europe, North America, with variable impact in Asia | Medium term (3-4 years) |
| High production costs compared to traditional sugar | -0.8% | Global, with highest impact in price-sensitive markets | Long term (≥5 years) |
| Raw material price fluctuations impact costs. | -0.6% | Global, with highest impact on natural sweeteners | Short term (≤2 years) |
| Shorter shelf life leads to wastage. | -0.4% | Emerging markets with limited cold chain infrastructure | Medium term (3-4 years) |
| Source: Mordor Intelligence | |||
Stringent Regulatory Requirements and Lengthy Approval Processes for New Alternative Sweeteners
Regulatory requirements remain a critical challenge in the alternative sweeteners market, significantly impacting product development timelines and market accessibility. The European Food Safety Authority (EFSA) has announced updated guidance for novel food applications, set to take effect in February 2025. This guidance imposes rigorous submission criteria, requiring detailed documentation of production processes, toxicological safety data, nutritional value, and estimated consumption levels[1]Source: European Food Safety Authority, "Navigating Novel Foods: what EFSA’s updated guidance means for safety assessments", www.efsa.europa.eu. These stringent requirements disproportionately affect small and medium-sized enterprises (SMEs), which often lack the necessary regulatory infrastructure and financial capacity to navigate multi-jurisdictional compliance. Furthermore, the fragmented global regulatory landscape intensifies these challenges, creating additional barriers to market entry. For instance, in 2024, the UK High Court brought attention to the complexities of regulatory inconsistencies when it ruled that the Food Standards Agency (FSA) had misclassified monk fruit extract as a novel food. This misclassification temporarily restricted the product's market access, highlighting the uncertainty and delays caused by varying regulatory frameworks[2]Source: The United Kingdom High Court, "Food Standard Agencies in Great Britain Unlawfully Classified Monk Fruit as Novel, High Court Rules", www.judiciary.uk. Such inconsistencies not only impede the introduction of innovative natural sweeteners but also disrupt the market's growth trajectory. Addressing these regulatory disparities and fostering alignment across jurisdictions will be crucial for unlocking the full potential of the alternative sweeteners market.
High Production Costs Compared to Traditional Sugar
Alternative sweeteners face significant hurdles in achieving cost parity with conventional sugar, which limits their adoption in price-sensitive mass-market applications. The cost disparity is particularly evident in emerging technologies like precision fermentation. While this technology enables the production of enhanced sweeteners, it encounters substantial challenges during the scale-up phase. To address these issues, industry collaborations have become increasingly prominent. For example, Roquette and Bonumose have partnered to scale up the production of tagatose, a rare sugar that delivers 92% of sugar's sweetness with only 38% of its calories. This collaboration reflects the broader industry trend of investing in production optimization to meet the growing consumer demand for natural, low-calorie alternatives. However, despite advancements in technology and strategic partnerships, achieving price competitiveness with sugar remains a significant obstacle. This challenge is exacerbated by rising global sugar prices, driven by climate-related supply disruptions and volatile agricultural conditions in major sugar-producing regions, further complicating the market dynamics for alternative sweeteners.
*Our forecasts treat driver/restraint impacts as directional, not additive. The impact forecasts reflect baseline growth, mix effects, and variable interactions.
Segment Analysis
By Product Type: High-Intensity Sweeteners Disrupt Traditional Dominance
In 2025, High-Fructose Corn Syrup (HFCS) maintains its dominant position with a 35.27% market share, driven by its cost-effectiveness and functional versatility in large-scale food and beverage processing. The Corn Refiners Association highlights that the industry is prioritizing sustainability and technological advancements, with members adopting practices to reduce carbon emissions, enhance resource efficiency, and maintain competitive pricing. HFCS remains a cornerstone in beverage applications due to its liquid form, which simplifies processing and ensures consistent sweetness profiles, critical for product standardization. The segment also benefits from robust supply chains and regulatory approvals across major markets, providing resilience and stability in an increasingly competitive and evolving sweetener market.
High-Intensity Sweeteners are the fastest-growing product segment, with a projected CAGR of 9.31% from 2026-2031. This growth is fueled by continuous innovations in taste profiles and their expanding applications across various food categories. Regulatory advancements, such as the FDA's GRAS designation for neohesperidin dihydrochalcone in July 2024, have further accelerated adoption. This approval expanded permissible usage levels from 10-1000 ppm, enabling its incorporation into products like sweet crackers, fruit juices, and energy drinks. Additionally, the segment is witnessing significant progress in sweet protein technologies, with companies developing fermentation-derived solutions that deliver superior taste while aligning with clean-label trends. These innovations cater to the growing demand from health-conscious consumers seeking natural, transparent, and sustainable ingredient options.


By Source: Natural Sweeteners Capture Premium Market Segments
In 2025, artificial sweeteners hold a dominant 54.62% market share, driven by their long-standing regulatory approvals, robust manufacturing infrastructure, and cost-effectiveness, which make them highly suitable for mass-market applications. Ongoing advancements in taste enhancement and application optimization further reinforce this segment's leadership. Companies are actively addressing historical challenges, such as aftertaste and temperature stability, through innovative formulations. Clear regulatory frameworks in key markets provide manufacturers with the confidence to develop products that meet compliance and safety standards. Additionally, technological advancements continue to improve the functionality of artificial sweeteners while preserving the economic advantages that have been pivotal to their widespread adoption.
Natural sweeteners are emerging as the fastest-growing segment, with a projected CAGR of 8.55% from 2026 to 2031. This growth is fueled by increasing consumer demand for clean-label products and rising concerns about the potential long-term health effects of artificial alternatives. Recent regulatory developments have significantly contributed to this upward trajectory. For instance, monk fruit recently gained approval in the UK and EU markets after overcoming its novel food classification through a successful legal challenge. This regulatory shift has unlocked substantial opportunities in European markets, which were previously inaccessible. Furthermore, advancements in extraction and processing technologies are enhancing taste profiles and reducing production costs, making natural sweeteners more competitive. These improvements position natural sweeteners as strong contenders in premium product categories, where consumers are willing to pay a premium for natural and authentic ingredients.
By Application: Pharmaceuticals and Nutraceuticals Lead Growth Trajectory
In 2025, food applications dominate the market with a 30.11% share, driven primarily by the bakery and confectionery sub-segments. These sub-segments lead due to their significant utilization of sweeteners and well-established reformulation capabilities. The segment benefits from extensive research into the functional properties of alternative sweeteners, which effectively replicate the structural and textural characteristics of traditional sugar while reducing caloric content. Additionally, advancements in sweetener blending techniques are enabling manufacturers to achieve precise taste profiles and functional attributes, even in complex food matrices. The food segment's dominance is further reinforced by increasing consumer acceptance of alternative sweeteners in familiar product categories and the presence of regulatory frameworks that provide clear and actionable guidance for reformulation strategies.
The pharmaceuticals and nutraceuticals segment is projected to be the fastest-growing application, with an anticipated CAGR of 8.44% during the 2026-2031 forecast period. This growth is propelled by the rising demand for sugar-free medications and functional health products, where effective taste masking plays a critical role in ensuring patient compliance. The segment demonstrates particular strength in pediatric and geriatric formulations, where palatability significantly influences therapeutic outcomes and medication adherence. Furthermore, recent innovations in sweetener applications for nutraceuticals are unlocking additional health benefits beyond calorie reduction. For instance, tagatose, a sweetener with prebiotic properties, supports gut health through fermentation in the large intestine. The pharmaceutical segment's growth is underpinned by regulatory recognition of the importance of patient-friendly formulations and the expanding market for functional foods that deliver health benefits beyond basic nutrition.
By Form: Liquid Sweeteners Gain Momentum in Beverage Applications
In 2025, solid sweeteners maintain a dominant 60.45% market share, driven by their stability, ease of handling, and adaptability across diverse food applications where bulk properties are essential for achieving desired texture and structure. Their widespread adoption is supported by well-established manufacturing processes and efficient packaging systems, which contribute to cost-effective large-scale production and streamlined distribution. In baking, solid sweeteners not only deliver sweetness but also replicate critical functional properties of sugar, such as moisture retention and browning, enhancing product quality. Additionally, advancements in granulation and encapsulation technologies are further optimizing the performance of solid sweeteners, enabling their use in more challenging applications while retaining their inherent processing advantages.
Liquid sweeteners are emerging as the fastest-growing segment, with an impressive 8.17% CAGR projected for 2026-2031. This growth is primarily attributed to their superior dissolution properties and the rising demand within the rapidly expanding beverage sector. The increasing popularity of zero-sugar beverages is driving sustained demand for liquid sweeteners that integrate seamlessly into formulations without dissolution issues. In cold applications, liquid sweeteners offer significant benefits, including faster dissolution rates that enhance manufacturing efficiency, reduce production times, and ensure consistent product quality. Furthermore, innovations in concentrated liquid formulations are addressing logistical challenges by lowering transportation costs and storage requirements, all while maintaining their functional integrity and performance.
Geography Analysis
In 2025, Asia-Pacific leads the global alternative sweeteners market with a 34.32% share, driven by rapid urbanization, rising middle-class populations, and growing health consciousness across China, India, and Japan. The regional food processing industry aligns with consumer demand and regulatory requirements for reduced sugar content in processed foods. China dominates regional consumption, particularly of high-fructose corn syrup, while expanding its domestic stevia production to reduce import dependence. China also strengthens its monk fruit cultivation and processing infrastructure, leveraging the fruit's native origins in southern China to meet increasing global demand for natural sweeteners. The beverage sector drives market expansion, with zero-sugar formulations gaining popularity among urban consumers seeking healthier alternatives.
North America ranks as the second-largest market, supported by increased awareness of sugar-related health risks and a robust regulatory framework that promotes reduced-sugar initiatives. The region leads sweetener innovation, especially in fermentation-based solutions. Cargill's EverSweet®, a stevia sweetener produced through specialized yeast fermentation, exemplifies this innovation by providing enhanced sweetness with a clean, natural flavor profile, addressing traditional sensory limitations of plant-based sweeteners.
The Middle East and Africa emerges as the fastest-growing region with a projected CAGR of 7.33% from 2026-2031, driven by increasing health consciousness, government initiatives to combat rising diabetes rates, and growing demand for premium food and beverage products. According to the U.S. Department of Agriculture (2024), the UAE's food processing industry, comprising over 2,000 companies and generating more than USD 7.6 billion annually, incorporates alternative sweeteners in healthier product formulations. The region's grocery market expansion reflects this trend through increased wellness-focused product offerings. The UAE's National Food Security Strategy 2051, focused on enhancing local production and reducing import dependence, creates opportunities for domestic alternative sweetener production, supporting broader food security and health objectives.

Competitive Landscape
The alternative sweeteners market is moderately fragmented, with a wide array of global and regional players offering diverse products, including artificial, natural, and sugar alcohol-based sweeteners. Competition in the market is primarily driven by product innovation, competitive pricing, regulatory compliance, and health-oriented positioning. While prominent players such as Cargill Incorporated, Archer Daniels Midland Company, and Tate and Lyle hold significant market shares, the market remains fragmented due to the continuous influx of startups and regional manufacturers. These new entrants are addressing specific consumer demands, such as clean-label products, and aligning with emerging dietary trends like low-calorie and plant-based alternatives.
Strategic partnerships have become a cornerstone for growth, as companies collaborate to combine expertise in ingredient technology, regulatory navigation, and market access. These alliances are expediting the development and commercialization of next-generation sweeteners. Leading players are allocating substantial resources to research and development, focusing on improving taste profiles, enhancing functionality, and expanding the application scope of their sweetener portfolios to cater to a broader range of industries, including food, beverages, and pharmaceuticals.
Disruptive innovations are reshaping the competitive landscape, with emerging players leveraging biotechnology and precision fermentation to create novel sweetening solutions. Companies specializing in sweet proteins produced through fermentation are establishing new competitive categories, offering enhanced functionality, better taste, and improved sustainability compared to traditional sweeteners. These advancements are challenging established market leaders and driving a shift in market dynamics. Furthermore, regulatory developments are creating both opportunities and challenges, favoring companies with strong regulatory expertise and the ability to navigate complex approval processes across multiple regions.
Alternative Sweeteners Industry Leaders
-
Cargill, Incorporated
-
Tate & Lyle PLC
-
Archer Daniels Midland Company
-
Ingredion Incorporated
-
Roquette Frères
- *Disclaimer: Major Players sorted in no particular order

Recent Industry Developments
- October 2024: Tate and Lyle and Manus partnered and introduced Stevia Reb M. The first ingredient to be jointly introduced is stevia Reb M, marking the first large-scale commercialization of an all-Americas-sourced, manufactured, and bio-converted stevia Reb M ingredient.
- July 2024: Roquette and Bonumose announced a Cooperation Agreement to advance the development of tagatose, a natural-origin sweetener with proven health benefits. The collaboration will combine Roquette’s expertise in starch-based sweeteners with Bonumose’s innovative enzymatic technology.
- January 2024: DSM-Firmenich and Cargill launched a new fermentation-derived plant-based sweetener. The product received approval from both the European Food Safety Authority (EFSA) and the UK's Food Standards Agency (FSA). This approval expands the range of regulatory-approved alternative sweeteners available in European and UK markets.


Global Alternative Sweeteners Market Report Scope
Alternative sweeteners are substances used to sweeten food and beverages as replacements for traditional sugars like sucrose (table sugar), aspartame, stevia, and others. They provide sweetness with fewer or no calories and are often used to help manage calorie intake, blood sugar levels, or dental health.
The global alternative sweetener market has been segmented by product type, which includes high fructose corn syrup, high-intensity sweeteners, low-intensity sweeteners, and other. High intensity sweeteners are further sub-segmented into sucralose, stevia, acesulfame K, aspartame, cyclamate, and other high intensity sweeteners. Low-intensity sweeteners are further sub-segmented into Xylitol, erythritol, sorbitol, maltitol, and others. Based on the source, the market is segmented into natural, artificial, and fermentation-derived. By form, the market is further segmented into Liquid and Solid. Based on application, the market is segmented into food and beverages, pharmaceuticals and nutraceuticals, personal care and oral care, animal feed, and others. The food sector is further divided into bakery and confectionery, dairy and desserts, meat and savory products, sauces, dressings & spreads, other processed foods. The beverage sector is further sub-segmented into soft drinks, sports drinks, and other beverages. The report further analyses the global scenario of the market, which includes detail analysis on North America, Europe, Asia-Pacific, South America, the Middle East, and Africa.
The market sizing has been done in value terms in USD for all the abovementioned segments.
| High-Fructose Corn Syrup (HFCS) | |
| High-Intensity Sweeteners | Sucralose |
| Stevia | |
| Acesulfame K | |
| Aspartame | |
| Cyclamate | |
| Other High Intensity Sweeteners | |
| Low-Intensity Sweeteners | Xylitol |
| Erythritol | |
| Sorbitol | |
| Maltitol | |
| Others | |
| Others |
| Natural |
| Artificial |
| Fermentation-Derived |
| Liquid |
| Solid |
| Food and Beverages | Food | Bakery and Confectionery |
| Dairy and Desserts | ||
| Meat and Savory Products | ||
| Sauces, Dressings and Spreads | ||
| Other Processed Foods | ||
| Beverages | Soft Drinks | |
| Sport Drinks | ||
| Other Beverages | ||
| Pharmaceuticals and Nutraceuticals | ||
| Personal and Oral Care | ||
| Animal Feed | ||
| North America | United States |
| Canada | |
| Mexico | |
| Rest of North America | |
| South America | Brazil |
| Argentina | |
| Colombia | |
| Chile | |
| Peru | |
| Rest of South America | |
| Europe | Germany |
| United Kingdom | |
| Italy | |
| France | |
| Netherlands | |
| Poland | |
| Belgium | |
| Sweden | |
| Rest of Europe | |
| Asia-Pacific | China |
| India | |
| Japan | |
| Australia | |
| Indonesia | |
| South Korea | |
| Thailand | |
| Singapore | |
| Rest of Asia-Pacific | |
| Middle East and Africa | South Africa |
| Saudi Arabia | |
| United Arab Emirates | |
| Nigeria | |
| Egypt | |
| Morocco | |
| Turkey | |
| Rest of Middle East and Africa |
| By Product Type | High-Fructose Corn Syrup (HFCS) | ||
| High-Intensity Sweeteners | Sucralose | ||
| Stevia | |||
| Acesulfame K | |||
| Aspartame | |||
| Cyclamate | |||
| Other High Intensity Sweeteners | |||
| Low-Intensity Sweeteners | Xylitol | ||
| Erythritol | |||
| Sorbitol | |||
| Maltitol | |||
| Others | |||
| Others | |||
| By Source | Natural | ||
| Artificial | |||
| Fermentation-Derived | |||
| By Form | Liquid | ||
| Solid | |||
| By Application | Food and Beverages | Food | Bakery and Confectionery |
| Dairy and Desserts | |||
| Meat and Savory Products | |||
| Sauces, Dressings and Spreads | |||
| Other Processed Foods | |||
| Beverages | Soft Drinks | ||
| Sport Drinks | |||
| Other Beverages | |||
| Pharmaceuticals and Nutraceuticals | |||
| Personal and Oral Care | |||
| Animal Feed | |||
| By Geography | North America | United States | |
| Canada | |||
| Mexico | |||
| Rest of North America | |||
| South America | Brazil | ||
| Argentina | |||
| Colombia | |||
| Chile | |||
| Peru | |||
| Rest of South America | |||
| Europe | Germany | ||
| United Kingdom | |||
| Italy | |||
| France | |||
| Netherlands | |||
| Poland | |||
| Belgium | |||
| Sweden | |||
| Rest of Europe | |||
| Asia-Pacific | China | ||
| India | |||
| Japan | |||
| Australia | |||
| Indonesia | |||
| South Korea | |||
| Thailand | |||
| Singapore | |||
| Rest of Asia-Pacific | |||
| Middle East and Africa | South Africa | ||
| Saudi Arabia | |||
| United Arab Emirates | |||
| Nigeria | |||
| Egypt | |||
| Morocco | |||
| Turkey | |||
| Rest of Middle East and Africa | |||


Key Questions Answered in the Report
What is the current size of the alternative sweeteners market?
The alternative sweeteners market stands at USD 49.64 billion in 2026 and is forecast to grow to USD 70.12 billion by 2031.
Which product type leads the market?
High-fructose corn syrup maintains leadership with 35.27% market share, though high-intensity variants are expanding faster at 9.31% CAGR.
Which source segment is growing quickest?
Natural sweeteners, fueled by clean-label demand and regulatory wins for monk fruit, are projected to increase at an 8.55% CAGR through 2031.
Why is Asia-Pacific dominant?
Large populations, rising diabetes awareness, and aggressive beverage reformulation give Asia-Pacific 34.32% revenue share in 2025.
Page last updated on:


