3D Scanners Market Size and Share
Market Overview
| Study Period | 2020 - 2031 |
|---|---|
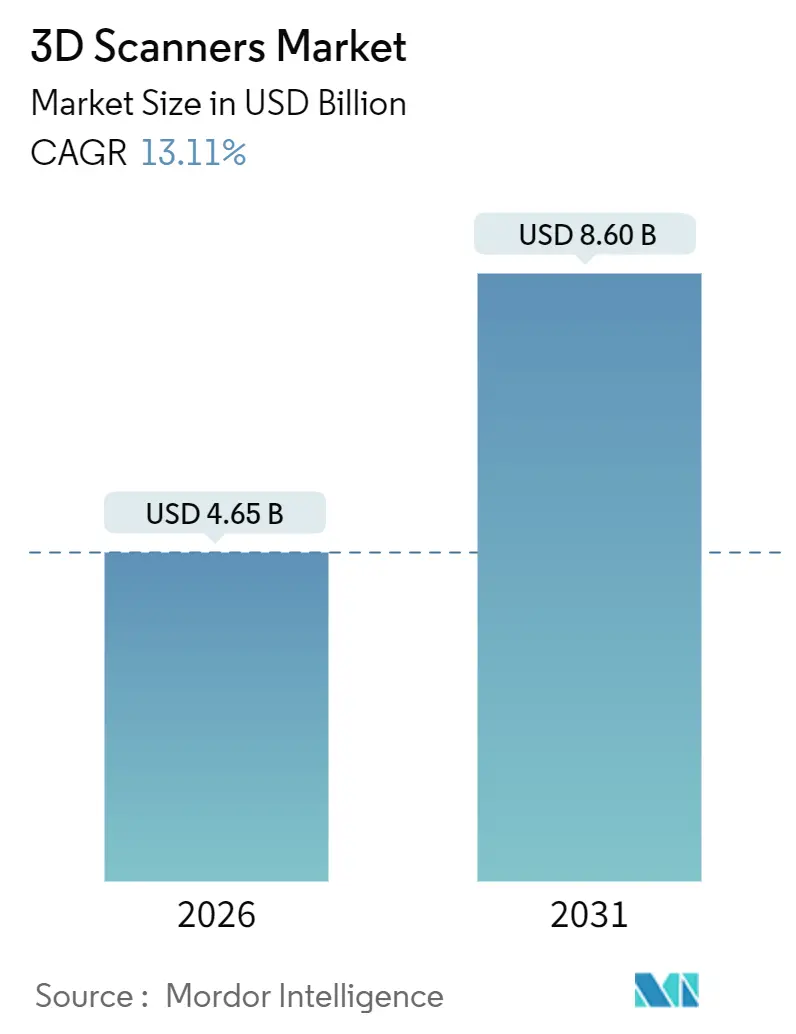
| Market Size (2026) | USD 4.65 Billion |
| Market Size (2031) | USD 8.60 Billion |
| Growth Rate (2026 - 2031) | 13.11% CAGR |
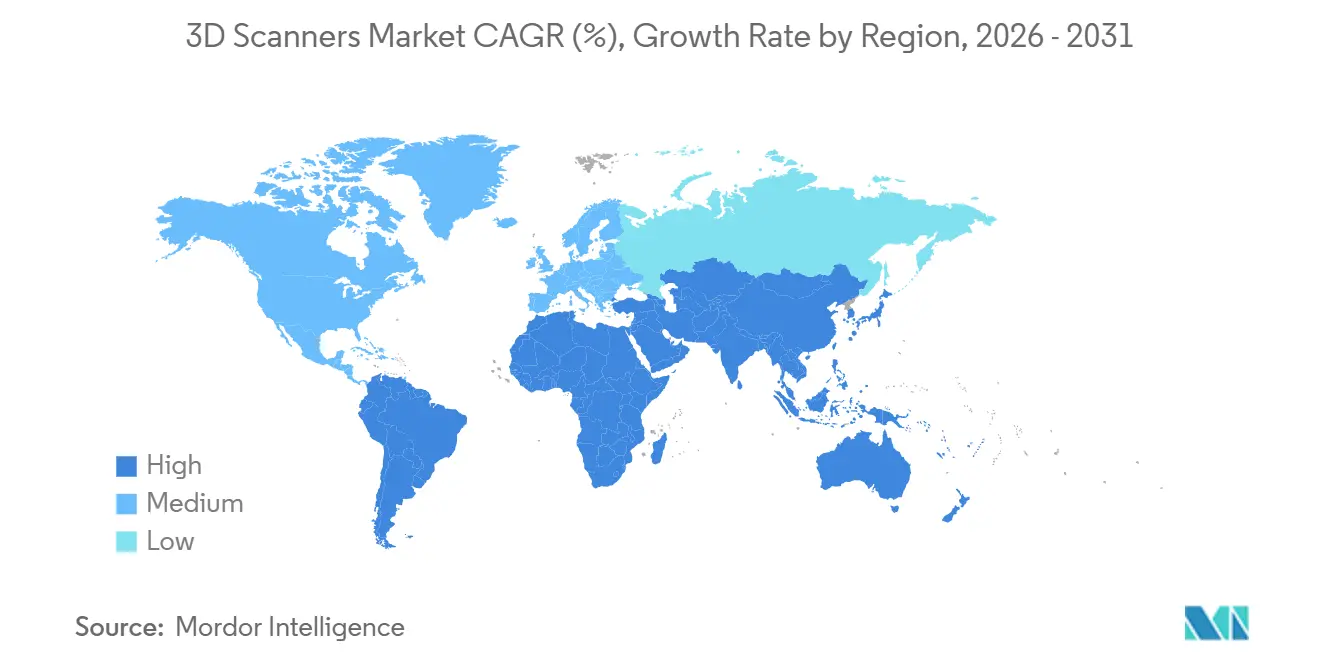
| Fastest Growing Market | Asia Pacific |
| Largest Market | North America |
| Market Concentration | Medium |
Major Players *Disclaimer: Major Players sorted in no particular order Image © Mordor Intelligence. Reuse requires attribution under CC BY 4.0. | |
3D Scanners Market Analysis by Mordor Intelligence
The 3D scanners market reached USD 4.65 billion in 2026 and is projected to advance to USD 8.60 billion by 2031, translating into a 13.11% CAGR. This strong trajectory reflects tighter sub-25-micron tolerances in electrified-vehicle battery enclosures, aerospace adoption of additive-first design workflows, and handheld metrology systems now priced below USD 10,000. Hardware still dominates revenue, yet software suites that automate inspection and reverse engineering are expanding at 14.76% per year, signaling a shift toward recurring license income. Demand is concentrated in short-range dental and electronics quality gates, while long-range LiDAR solutions benefit from government-backed digitization of transportation corridors. Regionally, North America leads on the back of aerospace and automotive clusters, whereas Asia Pacific is the fastest climber as China and India embed traceable metrology into electric-vehicle and production-linked incentive policies.
Key Report Takeaways
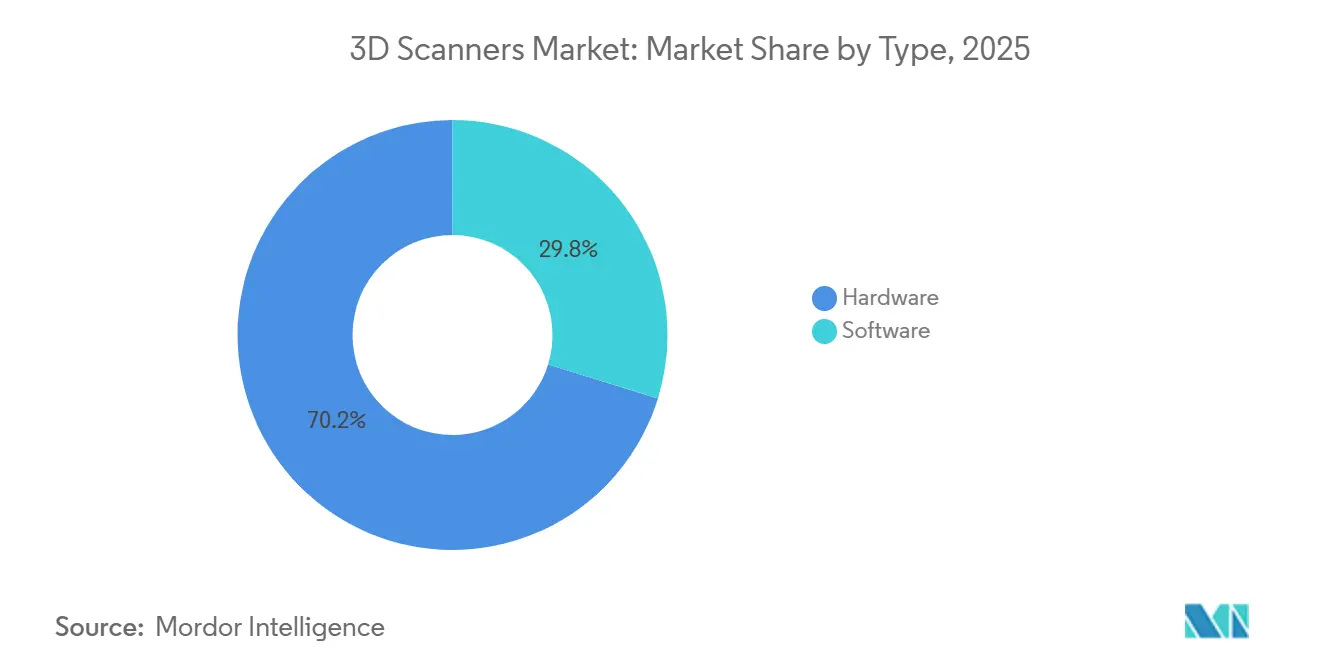
- By type, hardware captured 70.22% of 2025 revenue, whereas software is forecast to record the highest CAGR at 14.76% through 2031.
- By range, short-range scanners held 56.32% revenue share in 2025, while long-range systems are advancing at a 14.12% CAGR to 2031.
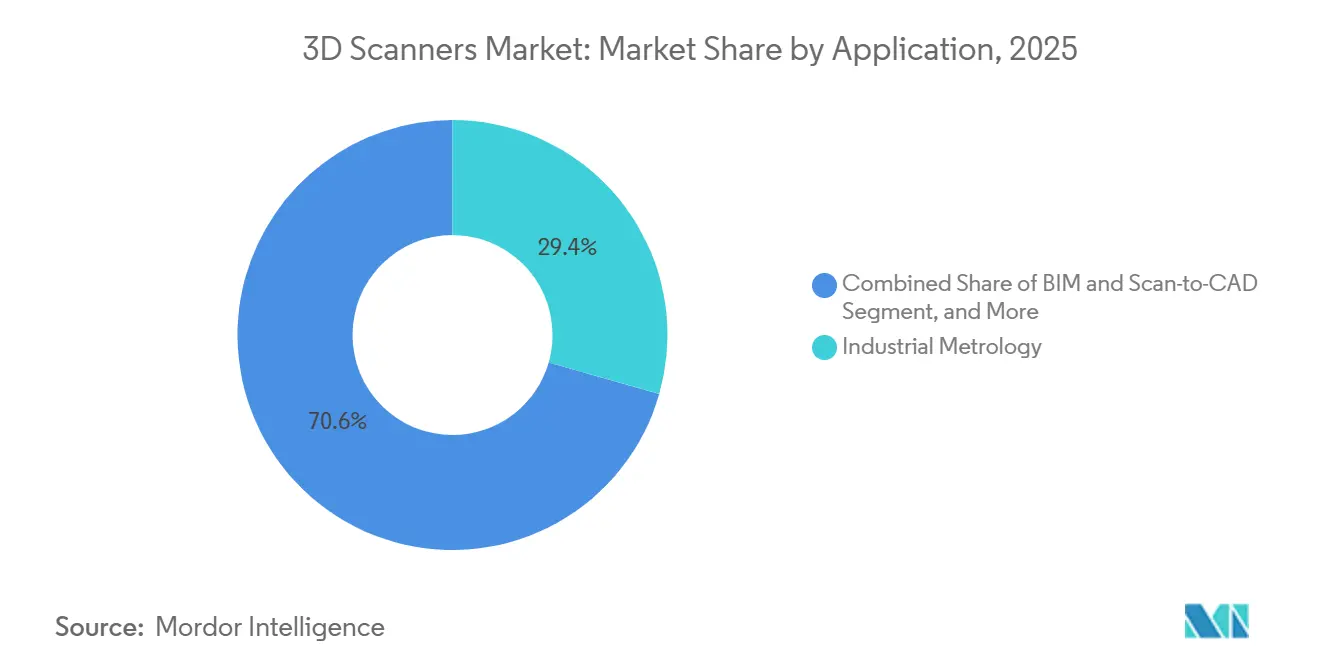
- By application, industrial metrology accounted for 29.42% share of the 3D scanners market size in 2025, while building information modeling is projected to grow at 15.36% CAGR through 2031.
- By end-user vertical, automotive led with 26.86% of 2025 revenue, yet healthcare is the fastest-growing segment at 14.46% CAGR.
- By geography, North America held 32.28% revenue share in 2025, whereas Asia Pacific is forecast to expand at 15.92% CAGR to 2031.
Note: Market size and forecast figures in this report are generated using Mordor Intelligence’s proprietary estimation framework, updated with the latest available data and insights as of January 2026.
Global 3D Scanners Market Trends and Insights
Drivers Impact Analysis*
| Driver | (~) % Impact on CAGR Forecast | Geographic Relevance | Impact Timeline |
|---|---|---|---|
| Rising Demand for High-Precision 3D Metrology in Lightweight EV Platforms | +2.3% | Global, with concentration in China, Germany, United States | Medium term (2-4 years) |
| Additive-First Aerospace Design Workflows Require Native 3D Scan Inputs | +1.8% | North America and Europe, expanding to Asia Pacific | Long term (≥4 years) |
| Shift to Predictive Maintenance Twins in Process-Industries | +1.5% | Global, led by North America and Middle East energy corridors | Medium term (2-4 years) |
| Adoption of LiDAR-on-Chip Modules in Next-Gen Smartphones | +1.2% | Asia Pacific manufacturing hubs, North America design centers | Short term (≤2 years) |
| Government Digitisation of Cultural-Heritage Assets | +0.8% | Europe and Middle East, selective adoption in Asia Pacific | Long term (≥4 years) |
| Falling ASPs of Handheld Scanners Below USD 10,000 | +1.9% | Global, accelerating in South America, Africa, Southeast Asia | Short term (≤2 years) |
| Source: Mordor Intelligence | |||
Rising Demand For High-Precision 3D Metrology In Lightweight EV Platforms
Battery-pack architectures that double as structural elements require dimensional tolerances tighter than 0.025 millimeter. Automakers therefore push metrology upstream, driving tier-two suppliers to replace go-no-go gauges with optical scanners that verify extrusions in under two minutes. Standards such as China’s GB/T 43239-2023 compel traceable records, reinforcing scanner uptake among electric-vehicle lines. Early adopters such as Tesla’s Berlin plant reported double-digit scrap reductions after deploying portable arms. The convergence of lightweighting and zero-defect policies positions 3D scanners market solutions as a core production asset rather than an optional quality tool.
Additive-First Aerospace Design Workflows Require Native 3D Scan Inputs
NASA-STD-6030 and 6033 formalized scan-based validation for powder-bed-fusion parts, making the point cloud a first-class design artifact. GE Aerospace demonstrated 12% fuel-burn savings by reverse engineering turbine foils using 50-micron scans. Airbus integrated laser trackers to send real-time deviation maps to lay-up robots, aligning fiber placement within sub-millimeter limits. EASA’s CS-25 Amendment 28 now accepts scan-derived geometry for structural substantiation, removing a previous regulatory bottleneck. These aligned standards embed 3D scanning inside the aerospace digital thread and lift the long-term growth outlook for the 3D scanners market.[1]National Aeronautics and Space Administration, “NASA-STD-6030,” NASA, nasa.gov
Shift To Predictive Maintenance Twins In Process-Industries
Gas-turbine operators use quarterly LiDAR sweeps to detect blade-tip creep six months sooner than borescope checks, cutting unplanned outages by one-fifth. Oil and gas majors apply monthly scans to topside piping and report 22% fewer shutdowns. ISO 55011 provides formal guidance for fusing spatial data with asset-management systems, enabling uptake by utilities and chemical processors that lacked in-house data science. As firms link point clouds to vibration and thermal feeds, 3D scanners market vendors earn service revenue from periodic resurvey contracts.
Falling ASPs Of Handheld Scanners Below USD 10,000
Component miniaturization and globalized optics supply chains have pulled entry-level scanner pricing below USD 10,000, expanding the customer base among small fabricators. Budget devices from China and Southeast Asia compete with professional units using open-source photogrammetry stacks. The affordability shift prompts incumbents to add artificial-intelligence workflows and ease-of-use features, mirroring consumer-electronics expectations set by smartphone LiDAR. Rapid price erosion therefore widens global penetration and introduces a fresh competitive dynamic in the 3D scanners market.
Restraints Impact Analysis*
| Restraint | (~) % Impact on CAGR Forecast | Geographic Relevance | Impact Timeline |
|---|---|---|---|
| Persistent Shortage of Metrology-Grade Talent | -1.1% | Global, acute in North America and Europe | Long term (≥4 years) |
| Data-Processing Bottlenecks in >1-Billion-Point Cloud Projects | -0.9% | Global, pronounced in AEC and infrastructure sectors | Medium term (2-4 years) |
| Fragmented Global Regulatory Standards for Laser Safety | -0.7% | Global, with divergence between FDA, IEC, and national regimes | Long term (≥4 years) |
| High TCO for Photogrammetry Rigs in Emerging Markets | -0.6% | South America, Africa, Southeast Asia | Medium term (2-4 years) |
| Source: Mordor Intelligence | |||
Persistent Shortage Of Metrology-Grade Talent
Two-thirds of U.S. manufacturers cannot recruit certified scanning technologists, while Europe counts fewer than 4,000 VDI/VDE-accredited professionals. Education pipelines lag behind industry needs, and community colleges often teach analog methods rather than point-cloud workflows. Vendors add automated alignment and defect recognition to reduce operator burden, but small and medium enterprises still struggle to justify scanner purchases without available talent. The shortage therefore caps near-term diffusion of 3D scanners market solutions despite growing technical capability.
Data-Processing Bottlenecks In >1-Billion-Point Cloud Projects
Highway interchanges, airports, and urban corridors can create three-terabyte datasets that overwhelm desktops with less than 64 GB RAM. Software providers have introduced cloud decimation pipelines, yet annual licenses can exceed USD 12,000, straining municipal budgets. Competing file formats add interoperability hurdles, forcing engineers to maintain several toolchains. Until compression standards harmonize and affordable cloud compute becomes ubiquitous, processing drag will temper the practical speed of large-scale scanning projects and weigh on the 3D scanners market growth curve.
*Our forecasts treat driver/restraint impacts as directional, not additive. The impact forecasts reflect baseline growth, mix effects, and variable interactions.
Segment Analysis
By Type: Software Suites Outpace Hardware On Recurring Revenue
Hardware generated 70.22% of 2025 turnover for the 3D scanners market, driven by structured-light, laser triangulation, LiDAR, and photogrammetry rigs. Software and services are, however, accelerating at 14.76% CAGR as vendors bundle inspection, metrology, and reverse-engineering modules with subscription renewals that build lifetime value. Hexagon disclosed that its Manufacturing Intelligence division derived 48% of 2025 sales from software versus 39% in 2023.[2]Hexagon AB, “Annual Report 2025,” Hexagon, hexagon.com
The recurring model encourages frequent feature updates such as artificial-intelligence defect mapping and direct CAD integrations. Open-source pipelines have commoditized basic scanning tasks, so commercial suites compete on regulated traceability and enterprise security. Photogrammetry rigs remain niche because of lighting constraints, but they offer favorable cost per scan for fuselages and heritage monuments. Conversely, optical scanners dominate unit shipments due to versatility across automotive, aerospace, and healthcare, maintaining the largest fragment of the 3D scanners market share. Across both categories, vendors leverage software to lock users into proprietary ecosystems, reinforcing margin resilience even as hardware prices decline.


By Range: Short-Range Dominance Masks Long-Range Acceleration
Short-range devices covering up to one meter captured 56.32% of 2025 revenue in the 3D scanners market, buoyed by dental, jewelry, and smartphone-form-factor inspection that demands micron-level precision. Medium-range systems between one and 30 meters serve typical automotive and aerospace shop-floor tasks, but commoditization from both ends narrows their differentiation window. Long-range scanners above 30 meters are the fastest riser at 14.12% CAGR to 2031 as governments digitize highways, mines, and renewable-energy corridors.
Leica’s BLK ARC wearable LiDAR captures 420,000 points per second at 150 meters, while Trimble’s X12 extends range to 600 meters with millimeter accuracy. Drone-mounted LiDAR at Rio Tinto mines replaced 48-hour terrestrial surveys with 90-minute autonomous flights, underscoring productivity gains that justify the six-figure equipment cost. Although unit volumes still favor short-range models, high average selling prices mean long-range systems are closing the revenue gap and altering the mix of the 3D scanners market.
By Application: BIM Workflows Eclipse Traditional Metrology Growth
Industrial metrology retained 29.42% 3D scanners market share in 2025 thanks to entrenched automotive, aerospace, and electronics requirements. Building information modeling now expands at 15.36% CAGR as regulators in the United Kingdom and the European Union require point-cloud deliverables for public projects over certain spending thresholds. Scan-first renovation workflows cut rework and enable digital twin maintenance regimes, drawing architecture and construction firms into regular resurvey cycles.
Reverse engineering remains critical for defense and energy assets where OEM support has lapsed, while rapid prototyping compresses consumer-goods development timelines. Heritage preservation scans illustrate public-relations value even when revenue impact is limited. Quality-in-process inspection blurs lines with industrial metrology but gains relevance under zero-defect initiatives. The result is that BIM and scan-to-CAD solutions increasingly drive incremental revenue for the 3D scanners market, whereas classical fixture-based inspection holds but no longer commands the fastest budget growth.

By End-User Vertical: Healthcare Outpaces Automotive On Reimbursement Tailwinds
Automotive maintained 26.86% of 2025 revenue yet faces plateauing unit growth as production volumes stabilize. Healthcare advances at 14.46% CAGR because dental insurers reimburse digital impressions at parity with alginate molds and orthopedic planners rely on personalized implants. The American Dental Association reported 62% intraoral scanner adoption in 2025, up 14 points in two years. Align Technology processed 2.8 million scans in 2024, exemplifying the throughput potential.
Aerospace and defense preserve long-term contracts owing to traceability mandates that archive laser-tracker results for decades. Architecture, engineering, and construction shows the fastest proportional climb due to BIM, while media and entertainment retains a niche of high-value projects. Energy utilities leverage LiDAR for vegetation management and asset integrity, broadening scanner use beyond manufacturing. Together these patterns diversify the 3D scanners market and reduce dependence on any single vertical.
Geography Analysis
North America led the 3D scanners market with 32.28% revenue in 2025, anchored by Seattle and Montreal aerospace clusters, Michigan automotive tooling, and federal standards that mainstream dimensional verification. The U.S. Department of Defense channels additive-manufacturing grants to depots, requiring reverse-engineering scanners for obsolete parts. Canada’s National Research Council offers subsidized calibrations, easing adoption by small manufacturers. Nearshoring activities in Mexico inject scanner demand into maquiladoras that must match U.S. quality tiers.
Asia Pacific is the fastest climber at 15.92% CAGR. China’s battery and rail supply chains must submit GB/T-compliant metrology records, while India’s production-linked incentive scheme reimburses capital equipment, including scanners, driving momentum in automotive and electronics factories. Japan’s precision machinery sector offers a stable base for premium systems, and Australia deploys drone LiDAR across mining sites under heightened tailings-dam oversight. Vietnam and Thailand attract foreign direct investment, but scarcity of certified talent and high total cost of ownership restrain penetration, leaving ample headroom for expansion of the 3D scanners market.
Europe benefits from ISO 10360 and VDI/VDE 2634, which favor established vendors with accredited labs. Germany’s machine-tool excellence powers hardware sales, and the European Chips Act funds cleanroom-compatible scanners for new fabs. The United Kingdom mandates BIM Level 2 with structured point clouds on public infrastructure over GBP 5 million, maintaining demand despite broader construction slowdowns. Middle Eastern sovereign-wealth funds finance heritage digitization programs such as Saudi Arabia’s USD 200 million project to scan 500 archaeological sites, showcasing non-industrial use cases. Scanner adoption in Africa clusters around South African mining and Nigerian oil assets, whereas South America lags due to high import tariffs that inflate landed costs by roughly 30 percent, limiting regional share of the 3D scanners market.

Competitive Landscape
The top five vendors controlled about 45% of 2025 revenue. Hexagon leverages a broad hardware catalog plus QUINDOS, Inspire, and PC-DMIS software to sell turnkey metrology cells with multi-year service contracts. Faro emphasizes usability with wireless Quantum Max FaroArm but saw margin squeeze as sub-USD 10,000 handheld entrants eroded share among small shops. Trimble acquired Faro’s software assets for USD 1.2 billion in January 2025 to pivot from hardware margins to software annuities, signaling convergence between surveying and scanning eco-systems.[3] Reuters, “Trimble Acquires Faro Software Assets,” Reuters, reuters.com
Carl Zeiss Industrial Quality Solutions filed patents for neural networks that adjust scan paths based on ambient temperature, promising predictive tolerance control. Budget players like Revopoint and Shining 3D market consumer-grade devices under USD 1,000 and rely on open-source ecosystems, forcing incumbents to justify higher prices with after-sales support. ISO 10360-13 introduced handheld acceptance tests that give buyers objective benchmarks, narrowing information asymmetry.[4] International Organization for Standardization, “ISO 10360-13,” ISO, iso.org Software rivalry is intense as Autodesk ReCap, Bentley ContextCapture, and new cloud-native entrants compete against open-source Meshroom, driving license bundling strategies to preserve renewal rates. Overall, competition is turning on software stickiness rather than pure hardware throughput, reshaping revenue structures inside the 3D scanners market.
3D Scanners Industry Leaders
3D Systems Inc.
Topcon Corporation
Autodesk Inc.
Hexagon AB
Creaform (AMETEK)
- *Disclaimer: Major Players sorted in no particular order


Recent Industry Developments
- June 2025: Hexagon AB finalized the USD 850 million purchase of Nikon’s industrial-metrology division, adding iGPS large-volume positioning and laser radar to its catalog.
- May 2025: Topcon and FARO agreed to co-develop integrated laser-scanning solutions for construction and BIM, pooling channel assets.
- April 2025: APPLE TREE launched the wireless KSCAN-X in Japan to tap aerospace and heavy-machinery demand for untethered wide-area capture.
- January 2025: Trimble closed its USD 1.2 billion acquisition of Faro software assets to embed RealWorks engines directly into AutoCAD 2026.


Research Methodology Framework and Report Scope
Market Definitions and Key Coverage
Our study defines the 3D scanners market as all hardware and tightly linked software that capture surface geometry or volume data through laser, structured light, photogrammetry, or LiDAR modules to create measurable three-dimensional point clouds and meshes, valued in USD at first sale. The scope tracks shipments and associated software licenses sold to end users in manufacturing, healthcare, construction, heritage, media, and other verticals.
Scope exclusion: After-market service contracts, stand-alone CAD/CAM suites, and custom one-off scanning rigs are excluded.
Segmentation Overview
- By Type
- Hardware
- Optical Scanners
- Structured-Light Scanners
- Laser Scanners
- LiDAR Modules
- Photogrammetry Rigs
- Other Hardwares
- Software
- Scanning Software
- Inspection / Metrology Suites
- Reverse-Engineering Suites
- Hardware
- By Range
- Short Range (≤1 m)
- Medium Range (1-30 m)
- Long Range (≥30 m)
- By Application
- Reverse Engineering
- Rapid Prototyping
- Quality Control / Inspection
- Industrial Metrology
- Face and Body Scanning
- Digital Modeling / Animation
- BIM and Scan-to-CAD
- Heritage Preservation and Archaeology
- By End-User Vertical
- Aerospace and Defense
- Automotive
- Healthcare (Incl. Dental, Orthotics)
- Manufacturing and Industrial
- Architecture, Engineering and Construction
- Media and Entertainment
- Energy and Utilities
- Consumer Electronics
- Academia and Research
- By Geography
- North America
- United States
- Canada
- Mexico
- South America
- Brazil
- Argentina
- Colombia
- Chile
- Rest of South America
- Europe
- Germany
- United Kingdom
- France
- Italy
- Spain
- Netherlands
- Sweden
- Russia
- Rest of Europe
- Asia Pacific
- China
- Japan
- South Korea
- India
- Australia and New Zealand
- ASEAN
- Rest of Asia Pacific
- Middle East
- Saudi Arabia
- United Arab Emirates
- Qatar
- Turkey
- Rest of Middle East
- Africa
- South Africa
- Nigeria
- Egypt
- Kenya
- Rest of Africa
- North America
Detailed Research Methodology and Data Validation
Primary Research
Mordor analysts interviewed scanner OEM engineers, metrology lab managers, heritage conservators, dental lab owners, and BIM consultants across North America, Europe, and Asia Pacific. These conversations refined average selling prices, usable life, and emerging adoption hurdles, and they validated our segmentation splits before numbers were locked.
Desk Research
We begin with open datasets from bodies such as the National Institute of Standards and Technology, United States International Trade Commission, Eurostat Comext, and the World Customs Organization to map cross-border scanner flows. Industry associations such as the Association for Advancing Automation, the American Dental Association, and the International Committee for Documentation assist us in sizing vertical demand pockets. Public filings, patent counts accessed through Questel, and press releases enrich trend tracking. D&B Hoovers supports revenue checks on key producers. This list is illustrative; many other public and subscription sources fed the baseline.
Market-Sizing & Forecasting
A top-down reconstruction from production plus trade data is cross-checked with sampled bottom-up roll-ups of supplier revenues and channel checks. Variables fed into the model include average scanner ASP progression, installed base retirement rates, automotive and aerospace production indices, dental CAD/CAM procedure counts, and BIM project penetration. Multivariate regression blended with short-term ARIMA captures both structural drivers and near-term cycles, while scenario analysis stress tests currency and supply chain shocks. Missing bottom-up datapoints are bridged by range-specific ASP proxies gathered during interviews.
Data Validation & Update Cycle
Outputs pass two analyst reviews, variance checks against independent indicators, and anomaly flags are re-queried with sources. Reports refresh every twelve months, with interim updates triggered by material events such as major technology launches or tariff shifts.
Why Mordor's 3D Scanners Baseline Earns Decision-Maker Trust
Published estimates often diverge because firms choose different product mixes, price points, and refresh cadences. By anchoring on clearly defined hardware and bundled software revenue and refreshing annually, Mordor Intelligence limits those distortions.
Key gap drivers stem from whether value-added software is counted, if rental and service revenue is rolled in, and how price normalization across short, medium, and long-range devices is handled. Our disciplined scope, verified ASP ladder, and yearly model review reduce these swings.
Benchmark comparison
| Market Size | Anonymized source | Primary gap driver |
|---|---|---|
| USD 4.09 Bn | Mordor Intelligence | - |
| USD 4.65 Bn | Regional Consultancy A | Omits bundled inspection and reverse-engineering suites, narrowing scope |
| USD 6.10 Bn | Global Consultancy B | Adds service bureau and rental revenue that inflates totals |
| USD 2.25 Bn | Trade Journal C | Counts hardware shipments only and uses list prices without range weighting |
The comparison shows that when scope creep or scope shrink occurs, headline values swing widely. Our model, rooted in transparent variables and repeatable steps, therefore offers the balanced, traceable baseline buyers can rely on.


Key Questions Answered in the Report
How large is the 3D scanners market in 2026 and what growth is expected?
The 3D scanners market reached USD 4.65 billion in 2026 and is forecast to grow to USD 8.60 billion by 2031 at a 13.11% CAGR.
Which segment is growing fastest within the 3D scanners space?
Software suites for inspection and reverse engineering post the fastest expansion at 14.76% CAGR as vendors move to recurring license models.
Why is healthcare adoption of 3D scanning accelerating?
Insurers now reimburse digital impressions and personalized implants, pushing dental and orthopedic practitioners toward intraoral and body-scan workflows growing at 14.46% CAGR.
Which region will add the most new revenue through 2031?
Asia Pacific is projected to record a 15.92% CAGR, driven by China’s battery-pack standards and India’s production-linked incentive subsidies that fund quality-control equipment.
How are falling hardware prices affecting market competition?
Sub-USD 10,000 handheld scanners widen the customer base but force incumbents to differentiate through advanced software and service contracts rather than pure device performance.
Page last updated on:


