All Flash Array Market Size and Share
Market Overview
| Study Period | 2020 - 2031 |
|---|---|
| Market Size (2026) | USD 27.73 Billion |
| Market Size (2031) | USD 65.09 Billion |
| Growth Rate (2026 - 2031) | 18.62% CAGR |
| Fastest Growing Market | Asia Pacific |
| Largest Market | North America |
| Market Concentration | Medium |
Major Players *Disclaimer: Major Players sorted in no particular order Image © Mordor Intelligence. Reuse requires attribution under CC BY 4.0. | |
All Flash Array Market Analysis by Mordor Intelligence
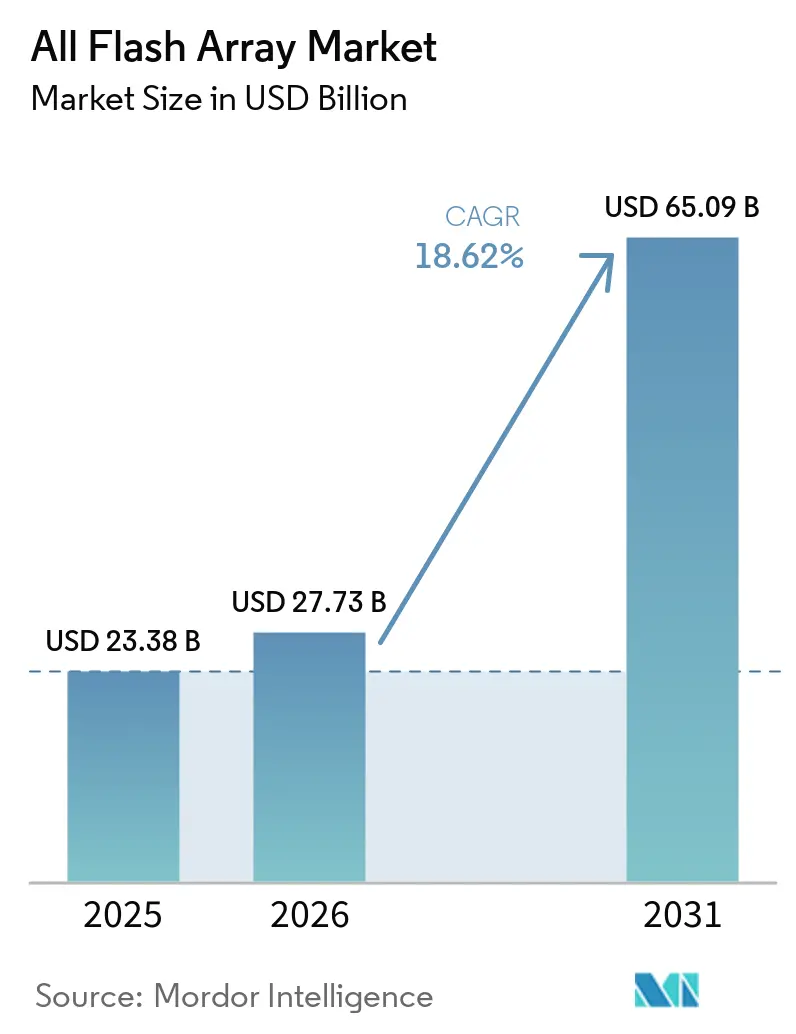
The All Flash Array market size is expected to grow from USD 23.38 billion in 2025 to USD 27.73 billion in 2026 and is forecast to reach USD 65.09 billion by 2031 at 18.62% CAGR over 2026-2031. Momentum comes from enterprises shifting mission-critical databases, AI training clusters, and real-time analytics pipelines onto flash systems that deliver reliable sub-millisecond latency. Hyperscale operators are scaling new GPU data centers at a record pace, national regulators are tightening energy-efficiency rules, and NAND suppliers continue to cut cost per bit, removing the last barriers that kept hybrid arrays in place. Parallel advances in NVMe-over-Fabrics (NVMe-oF) and in-array data-reduction engines now let organizations consolidate larger data sets while maintaining performance, which further tilts budgets toward flash deployments. Vendors that combine purpose-built software with efficient hardware are gaining mindshare as end users prioritize predictable quality of service during AI inference, edge analytics, and cyber-recovery scenarios.[1]“Press Release – Pure Storage DirectFlash Module Collaboration,” Pure Storage, purestorage.com
Key Report Takeaways
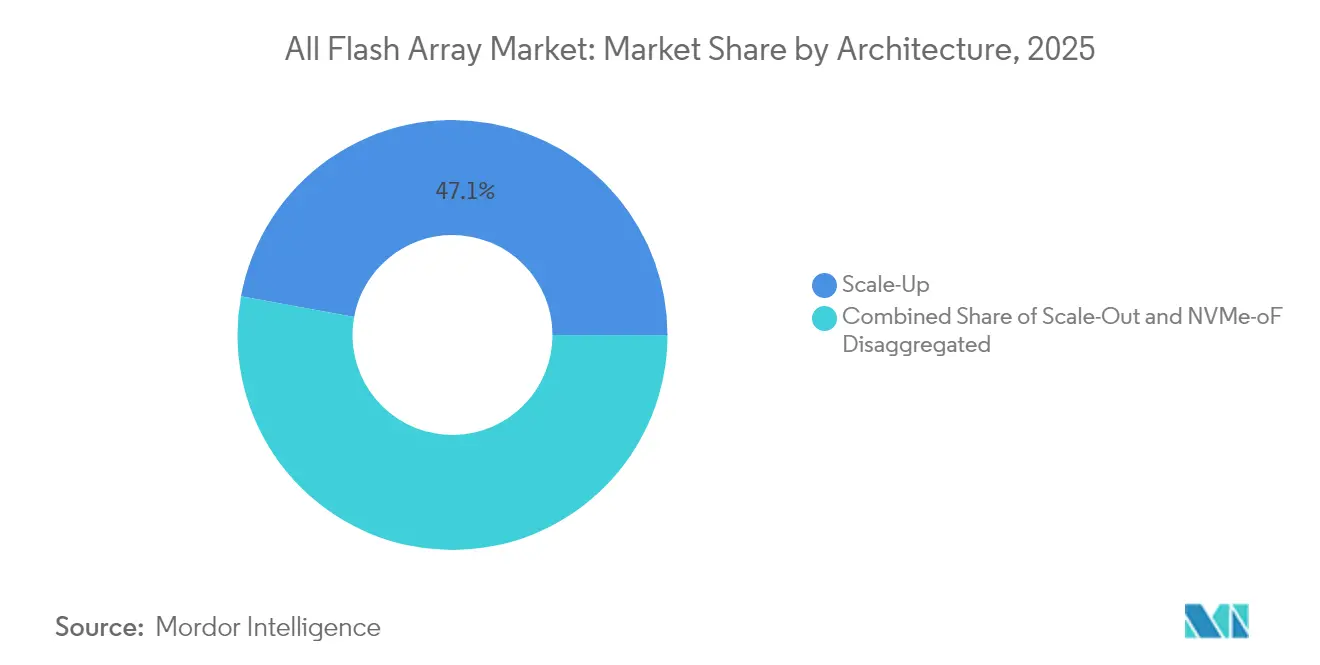
- By architecture, scale-up arrays led with 47.12% of the All Flash Array market share in 2025, while NVMe-oF disaggregated systems are advancing at a 19.45% CAGR through 2031.
- By capacity, the 20–100 TB band accounted for 49.25% of deployments in 2025 of the All Flash Array market; systems above 100 TB are set to expand at a 19.61% CAGR to 2031.
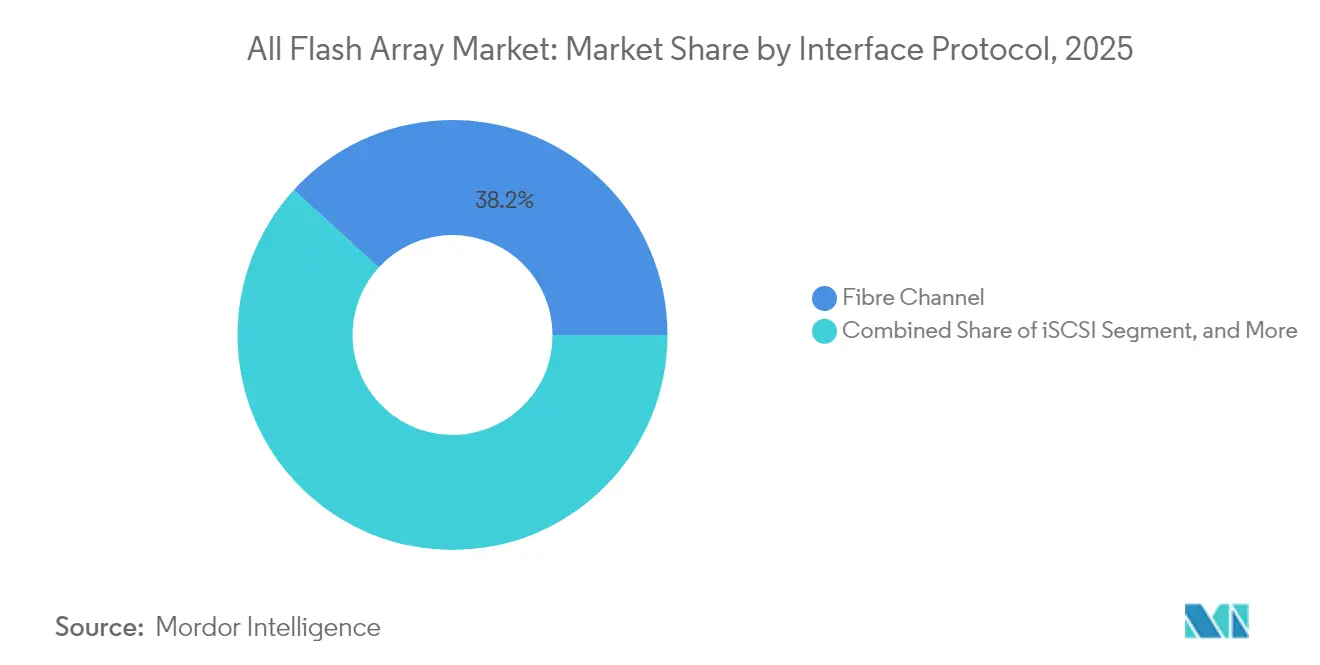
- By interface protocol, Fibre Channel held 38.22% share of the All Flash Array market size in 2025, yet NVMe solutions record the fastest growth at 20.05% CAGR.
- By end-user industry, IT and Telecom retained 34.35% share of the All Flash Array market in 2025; Healthcare and Life Sciences are projected to rise at a 20.54% CAGR through 2031.
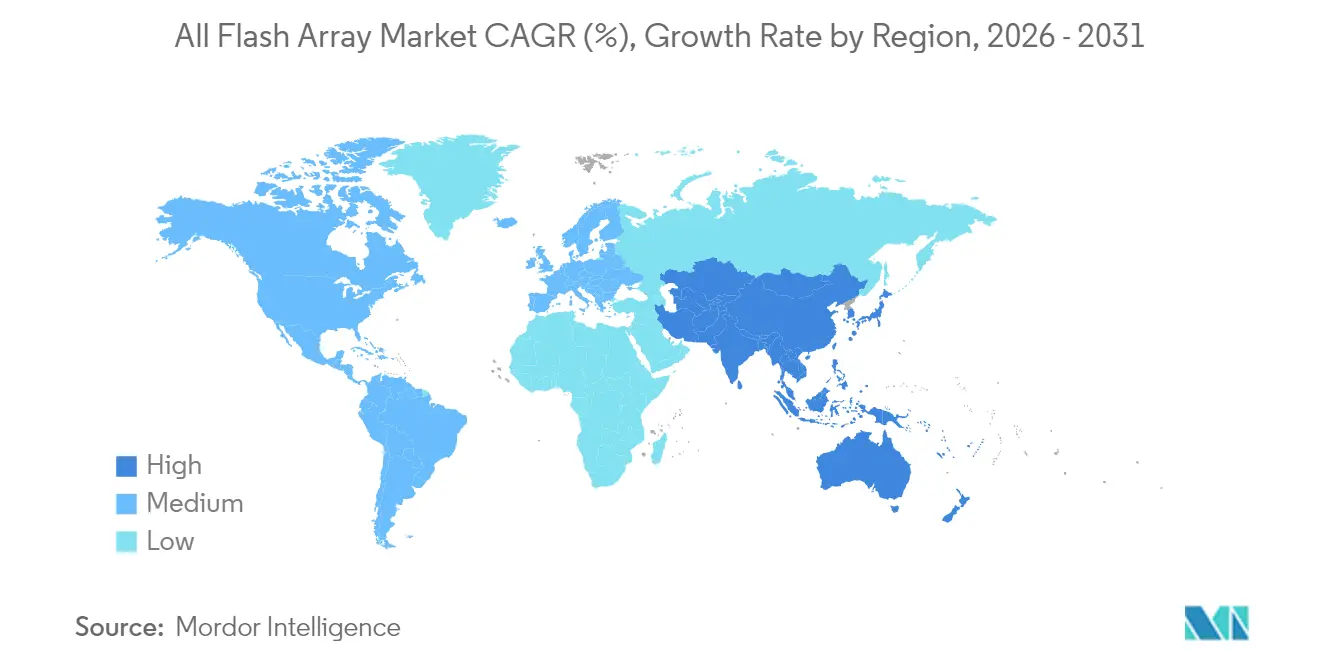
- By geography, North America commanded 38.24% revenue of the All Flash Array market in 2025, while Asia-Pacific is expanding at a 20.30% CAGR to 2031.
Note: Market size and forecast figures in this report are generated using Mordor Intelligence’s proprietary estimation framework, updated with the latest available data and insights as of 2026.
Global All Flash Array Market Trends and Insights
Drivers Impact Analysis*
| Driver | (~) % Impact on CAGR Forecast | Geographic Relevance | Impact Timeline |
|---|---|---|---|
| Surging hyperscale and edge data-center buildouts | +4.2% | Global, concentrated in North America and Asia-Pacific | Medium term (2-4 years) |
| Rapid decline in NAND cost per bit | +3.8% | Global | Short term (≤ 2 years) |
| Performance-critical AI and real-time analytics workloads | +5.1% | North America and Europe, expanding to Asia-Pacific | Long term (≥ 4 years) |
| Energy-efficiency mandates for enterprise IT | +2.7% | Europe and North America, regulatory spillover globally | Medium term (2-4 years) |
| Tier-0 database consolidation in financial trading hubs | +1.9% | North America and Europe financial centers | Short term (≤ 2 years) |
| Cyber-recovery architectures demanding immutable flash snapshots | +1.3% | Global, emphasis on regulated industries | Medium term (2-4 years) |
| Source: Mordor Intelligence | |||
Surging hyperscale and edge data-center buildouts
Hyperscale cloud operators collectively allocated more than USD 130 billion in 2025 capex for AI-optimized campuses, and storage now captures roughly one-fifth of that spend.[2]“NVIDIA and Storage Industry Leaders Unveil New Class of Enterprise Infrastructure for the Age of AI,” NVIDIA, nvidia.com New facilities require dense, low-latency flash tiers to feed thousands of GPUs that process large language model parameters. In parallel, edge deployments at retail outlets, cell towers, and manufacturing sites favor compact flash systems that tolerate vibration and temperature variations yet still deliver consistent throughput. Vendors are responding with unified controller code that scales from two-node edge appliances to rack-scale NVMe-oF fabrics inside core data centers. Utility-driven power caps in major metros further accelerate the move from hybrid drives to flash that delivers higher IOPS per watt. As a result, the All Flash Array market benefits from synchronized demand across centralized clouds and distributed edge nodes.
Performance-critical AI and real-time analytics workloads
AI model training saturates storage links with sequential writes, while inference workloads depend on microsecond random reads. These dual-workload profiles expose the latency and queue-depth limits of hybrid arrays, accelerating adoption of AI powered Storage and pushing banks, insurers, and e-commerce platforms toward all-flash systems. Financial institutions deploying algorithmic trading engines report tangible revenue gains after migrating tick-data stores to all-flash platforms validated under STAC benchmarks. Hospitals leverage flash-based PACS archives to let AI diagnostic engines review MRI and CT scans without delay, accelerating time to diagnosis. Manufacturers run predictive maintenance models on edge-hosted GPUs that ingest sensor telemetry in real time, a workflow that collapses if storage stalls. The convergence of retrieval-augmented generation, graph queries, and streaming analytics positions the All Flash Array market as foundational for next-generation data pipelines.
Rapid decline in NAND cost per bit
NAND fabs now transition to 232-layer QLC designs, dropping cost per bit and lifting endurance through improved error-correction algorithms.[3]“Silicon Motion Blog – Outlook 2025: Charting a Revolution in Storage,” Silicon Motion, siliconmotion.com Enterprise SSD average selling prices fell 12% in 2024, enabling vendors to price all-flash configurations within reach of mid-range hybrid budgets. Lower media cost lets OEMs bundle larger raw capacities with built-in deduplication and compression, delivering effective capacities that exceed spinning-disk systems at a similar cost point. Price elasticity widens the addressable base for departmental IT, edge analytics, and secondary data copies, increasing the velocity of All Flash Array market adoption.
Energy-efficiency mandates for enterprise IT
The revised EU Energy Efficiency Directive and expanded U.S. ENERGY STAR standards elevate power consumption to a top-three buying criterion. Modern flash arrays consume up to 80% less energy than comparable hybrid racks, reducing both operating expense and scope-3 emissions. Major cloud providers now report ESG metrics that include storage watt-hours per useful terabyte, motivating procurement teams to swap disk-heavy tiers for flash pools. National-level utilities in Ireland, Singapore, and Virginia impose power access quotas that reward data centers with higher performance per kilowatt, a parameter where flash thrives. This policy trend supports a sustainable demand trajectory for the All Flash Array market.
Restraints Impact Analysis*
| Restraint | (~) % Impact on CAGR Forecast | Geographic Relevance | Impact Timeline |
|---|---|---|---|
| Up-front capex premium versus hybrid arrays | -2.8% | Global, particularly price-sensitive emerging markets | Short term (≤ 2 years) |
| Controller bottlenecks in scale-up architectures | -1.9% | North America and Europe legacy installations | Medium term (2-4 years) |
| Supply-chain volatility for high-density NAND | -1.4% | Global, concentrated impact on high-capacity systems | Short term (≤ 2 years) |
| Limited endurance for write-intensive logging use-cases | -0.9% | Global, sector-specific impact on high-write workloads | Long term (≥ 4 years) |
| Source: Mordor Intelligence | |||
Up-front capex premium versus hybrid arrays
Even with falling SSD prices, an entry-level all-flash node still lists 40% to 60% higher than a hybrid alternative of equal usable capacity. CFOs in price-sensitive verticals often prioritize initial purchase cost over five-year TCO, delaying flash migration projects. SMEs in Latin America and parts of Southeast Asia extend the life of disk-based arrays by adding cache upgrades rather than shifting workloads outright. Economic uncertainty following inflationary cycles has elongated procurement approvals, further suppressing near-term All Flash Array market conversions.
Controller bottlenecks in scale-up architectures
Most incumbent dual-controller designs saturate CPU threads before NVMe drives reach full bandwidth. As SSD counts per chassis grow, command queues deepen and latency variance climbs, undercutting the deterministic performance AI pipelines need. Enterprises that invested heavily in Fibre Channel SANs hesitate to rip and replace, yet incremental controller refreshes do not remove the bottleneck. The gap motivates spend on NVMe-oF disaggregated nodes that can shard I/O processing across an Ethernet fabric, but skills shortages in modern storage networking hinder swift migration for many IT teams.
*Our forecasts treat driver/restraint impacts as directional, not additive. The impact forecasts reflect baseline growth, mix effects, and variable interactions.
Segment Analysis
By Architecture: Disaggregation Challenges Scale-Up Dominance
Scale-up arrays delivered 47.12% of 2025 revenue, keeping them the largest contributor to the All Flash Array market. The familiar dual-controller footprint integrates with existing SAN orchestration, explaining its staying power. Yet the same architecture struggles to utilize ever-denser NVMe drives, nudging performance-critical buyers toward scale-out or fully disaggregated NVMe-oF designs. Vendors mitigate risk by adding stateless compute shelves and caching layers, but these retrofits cannot erase fundamental controller constraints.
In contrast, NVMe-oF disaggregated clusters are projected to post a 19.45% CAGR to 2031, the fastest within the All Flash Array market. Disaggregation eliminates single-chassis bottlenecks by pushing storage logic to Ethernet-attached nodes that scale linearly. Pure Storage and several software-defined entrants showcase petabyte-scale GPU farms built on this model, citing sustained line-rate throughput figures during AI model checkpoints. Adoption still hinges on data-center teams mastering RDMA, congestion control, and multi-pathing across high-speed Ethernet, creating a skills gap that tempers near-term rollouts.


By Capacity: High-Density Systems Accelerate Growth
The 20–100 TB band held 49.25% of 2025 deployments, representing the sweet spot for database consolidation and VM sprawl elimination. This range balances price, rack power, and rebuild windows, making it the default for mid-sized enterprise refresh cycles. QLC flash plus aggressive inline compression yields effective capacities that dwarf predecessor hybrids without forcing operators into exotic chassis designs.
Systems above 100 TB are forecast to grow at 19.61% CAGR through 2031, outpacing the overall All Flash Array market. Hyperscalers favor these dense shelves to feed GPU clusters where locality lowers east-west traffic costs. Financial trading hubs also gravitate toward high-density builds, consolidating tick history and back-testing libraries onto singular ultra-low-latency pools. Micron’s 150 TB DirectFlash Module, co-engineered with Pure Storage, exemplifies the vendor push toward multi-petabyte racks that promise fewer cables, fewer watts, and uncompromised bandwidth.
By Interface Protocol: NVMe Disrupts Fibre Channel Leadership
Fibre Channel claimed 38.22% of 2025 revenue, underscoring its entrenched status in mission-critical environments that value deterministic latency. Compatibility with existing host bus adapters and switch matrices makes FC a conservative refresh path for core ERP databases and mainframe offloads. That inertia shields FC from immediate displacement, even though the protocol’s roadmap lags emerging NVMe features such as multipath namespaces.
NVMe interfaces, covering PCIe-direct, NVMe-oF RoCE, and NVMe-over-TCP, are projected to rise at a 20.05% CAGR. New installs rarely start on SAS or SATA, and several Fortune 100 banks specify NVMe-native front-ends for every tier-0 purchase. NetApp’s integration of ONTAP with Google Distributed Cloud demonstrates cross-site replication over NVMe-oF that meets strict data-sovereignty rules. The direction of travel points toward Ethernet fabrics carrying converged compute and storage traffic, which shifts capital from specialized SAN switches to more economical 100 GbE and 400 GbE leaf-spine fabrics.
By End-User Industry: Healthcare Accelerates Beyond IT Leadership
IT and Telecom retained 34.35% of 2025 revenue, reflecting the sector’s ongoing lift-and-shift of virtual machines from on-prem clusters to colocation racks that favor flash for mixed workloads. Yet growth decelerates as cloud migration matures, making room for Healthcare and Life Sciences, which are set to post a 20.54% CAGR. Diagnostic imaging archives, genomics pipelines, and patient record analytics each mandate high I/O and compliance with immutable snapshot policies.
Hospitals deploying AI-assisted radiology systems run inference against petabyte-scale image libraries and cannot accept spinning disk latency. Pharmaceutical labs conducting high-throughput gene sequencing use flash arrays to stage run data that feed real-time base-calling algorithms, shortening discovery cycles. Government and Public Sector agencies follow, purchasing all-flash nodes for tax analytics, census workloads, and secure cloud environments that ban physical disk destruction. Across end users, sustainability metrics drive flash preference because power budgets remain constrained despite higher computational demands.
Geography Analysis
North America generated 38.24% of 2025 revenue, anchored by U.S. hyperscalers expanding AI clusters and Wall Street trading firms modernizing market-data lakes. The region allocates well over USD 50 billion each year to AI infrastructure, and all-flash tiers sit at the heart of every GPU pod. Strict SEC and FINRA rules also require write-once-read-many compliance, which modern flash arrays fulfill through immutable snapshot frameworks.
Asia-Pacific is the fastest-growing territory, registering a 20.30% CAGR to 2031 as factories automate quality control and national AI strategies proliferate sovereign data centers. China channels subsidies to local storage brands to offset export controls, while Japan and South Korea retrofit 5G edge nodes with compact flash shelves that process video analytics in place. India’s IT-services hubs deploy all-flash racks inside next-generation co-location campuses to lower application response times for global clients. Singapore and Hong Kong twin their financial districts with regional disaster-recovery flash clusters to comply with faster clearing and settlement rules. Europe balances energy policy with digital innovation, driving enterprises toward storage that shrinks watt-hour footprints. Germany funds Industry 4.0 pilot lines that embed AI vision systems needing rapid data recall, while France invests in sovereign cloud regions equipped with all-flash backbone tiers. Nordic nations lure hyperscale entrants to hydro-powered campuses, securing new demand for high-density flash trays. Meanwhile, Middle East oil majors adopt flash arrays for seismic modeling rigs, and African telecoms roll out flash-backed mobile-money platforms that require 24 × 7 availability despite regional power volatility. Collectively, geographic diversification supports a resilient growth path for the All Flash Array market.

Competitive Landscape
Industry concentration sits at a moderate level as Pure Storage, Dell Technologies, NetApp, Hewlett Packard Enterprise, IBM, and Huawei compete with nimbler disruptors. Pure Storage pairs proprietary DirectFlash Modules with software modules that integrate tightly with NVIDIA GPU platforms, positioning itself as an AI infrastructure specialist. Dell updates its PowerStore line with NVMe-oF support to protect a vast installed base, while NetApp courts hybrid-cloud buyers through native ties with hyperscale providers.
New entrants such as VAST Data, Solidigm, and Silk emphasize disaggregated namespaces and software-defined architectures. Their scale-as-you-grow nodes sidestep controller bottlenecks and embed tiering algorithms that automatically place cold blocks on cheaper QLC. High-growth segments like cyber-recovery and edge AI present white-space opportunities where brand loyalty is less entrenched, allowing challengers to convert first-time buyers.
Strategic alliances shape differentiation more than hardware specs. IBM’s FlashSystem C-series integrates on-box AI inference engines to manage data placement. Hitachi Vantara extends its VSP One portfolio with end-to-end telemetry that helps clients report carbon metrics at the array level.[4]“Hitachi Vantara Accelerates AI Readiness,” Hitachi Vantara, hitachivantara.com Partnerships such as Nutanix and Pure Storage combine hyperconverged compute with external NVMe-oF arrays to address virtualization customers seeking license flexibility. The mix of tight cloud integrations, energy metrics, and AI-specific optimizations will dictate share shifts inside the All Flash Array market over the forecast window.
All Flash Array Industry Leaders
Pure Storage Inc.
Dell Technologies Inc.
NetApp Inc.
Hewlett Packard Enterprise Company
IBM Corporation
- *Disclaimer: Major Players sorted in no particular order


Recent Industry Developments
- June 2025: Pure Storage and Micron expanded their collaboration to integrate Micron QLC NAND into future DirectFlash Modules targeting hyperscale deployments.
- May 2025: Nutanix and Pure Storage announced an integrated solution combining Nutanix Cloud Infrastructure with FlashArray over NVMe-TCP.
- March 2025: NVIDIA unveiled the AI Data Platform reference design in collaboration with Pure Storage, Dell Technologies, HPE, IBM, NetApp, and VAST Data.
- January 2025: IBM launched FlashSystem C200 all-flash array with AI-enhanced features to address mid-range enterprise performance demands.


Global All Flash Array Market Report Scope
The All Flash Array contains only flash memory drives instead of spinning-disk drives, which offer speed, performance, and agility for business applications. The All Flash Array Market is segmented by Type (Traditional and Custom), End-User Application (IT and Telecom Industry, BFSI, Healthcare, Government), and Geography (North America, Europe, Asia Pacific, Rest of the World). The market sizes and forecasts are provided in terms of value (USD million) for all the above segments.
| Scale-Up |
| Scale-Out |
| NVMe-oF Disaggregated |
| ≤20 TB |
| 20 – 100 TB |
| >100 TB |
| SAS/SATA |
| Fibre Channel |
| iSCSI |
| NVMe |
| IT and Telecom |
| BFSI |
| Healthcare and Life Sciences |
| Government and Public Sector |
| Media and Entertainment |
| Manufacturing and Energy |
| Other End-User Industries |
| North America | United States | |
| Canada | ||
| Mexico | ||
| South America | Brazil | |
| Argentina | ||
| Chile | ||
| Rest of South America | ||
| Europe | Germany | |
| United Kingdom | ||
| France | ||
| Italy | ||
| Spain | ||
| Rest of Europe | ||
| Asia-Pacific | China | |
| Japan | ||
| South Korea | ||
| India | ||
| Singapore | ||
| Australia | ||
| Rest of Asia-Pacific | ||
| Middle East and Africa | Middle East | Saudi Arabia |
| United Arab Emirates | ||
| Turkey | ||
| Rest of Middle East | ||
| Africa | South Africa | |
| Nigeria | ||
| Egypt | ||
| Rest of Africa | ||
| By Architecture | Scale-Up | ||
| Scale-Out | |||
| NVMe-oF Disaggregated | |||
| By Capacity (Usable) | ≤20 TB | ||
| 20 – 100 TB | |||
| >100 TB | |||
| By Interface Protocol | SAS/SATA | ||
| Fibre Channel | |||
| iSCSI | |||
| NVMe | |||
| By End-User Industry | IT and Telecom | ||
| BFSI | |||
| Healthcare and Life Sciences | |||
| Government and Public Sector | |||
| Media and Entertainment | |||
| Manufacturing and Energy | |||
| Other End-User Industries | |||
| By Geography | North America | United States | |
| Canada | |||
| Mexico | |||
| South America | Brazil | ||
| Argentina | |||
| Chile | |||
| Rest of South America | |||
| Europe | Germany | ||
| United Kingdom | |||
| France | |||
| Italy | |||
| Spain | |||
| Rest of Europe | |||
| Asia-Pacific | China | ||
| Japan | |||
| South Korea | |||
| India | |||
| Singapore | |||
| Australia | |||
| Rest of Asia-Pacific | |||
| Middle East and Africa | Middle East | Saudi Arabia | |
| United Arab Emirates | |||
| Turkey | |||
| Rest of Middle East | |||
| Africa | South Africa | ||
| Nigeria | |||
| Egypt | |||
| Rest of Africa | |||


Key Questions Answered in the Report
What is the projected revenue for the All Flash Array market in 2031?
The market is forecast to reach USD 65.09 billion by 2031, expanding from USD 23.38 billion in 2025 and reaching USD 27.73 billion in 2026.
How fast is NVMe-over-Fabrics expected to grow relative to other architectures?
NVMe-oF disaggregated systems are set to grow at a 19.45% CAGR, the highest among architectural segments.
Which industry vertical is forecast to grow the fastest?
Healthcare and Life Sciences lead with a 20.54% CAGR through 2031 as AI diagnostics and genomics workloads scale.
Why are energy-efficiency mandates boosting flash adoption?
Flash arrays consume up to 80% less power than hybrid storage, helping enterprises comply with EU and U.S. efficiency regulations.
What region shows the highest growth outlook?
Asia-Pacific is projected to register a 20.30% CAGR, driven by manufacturing digitization and sovereign AI spending.
How concentrated is supplier power in this space?
The market scores 6 on a 10-point concentration scale, signifying moderate concentration with room for disruptors to gain share.
Page last updated on:


