Aircraft Sensors Market Size and Share
Market Overview
| Study Period | 2020 - 2031 |
|---|---|
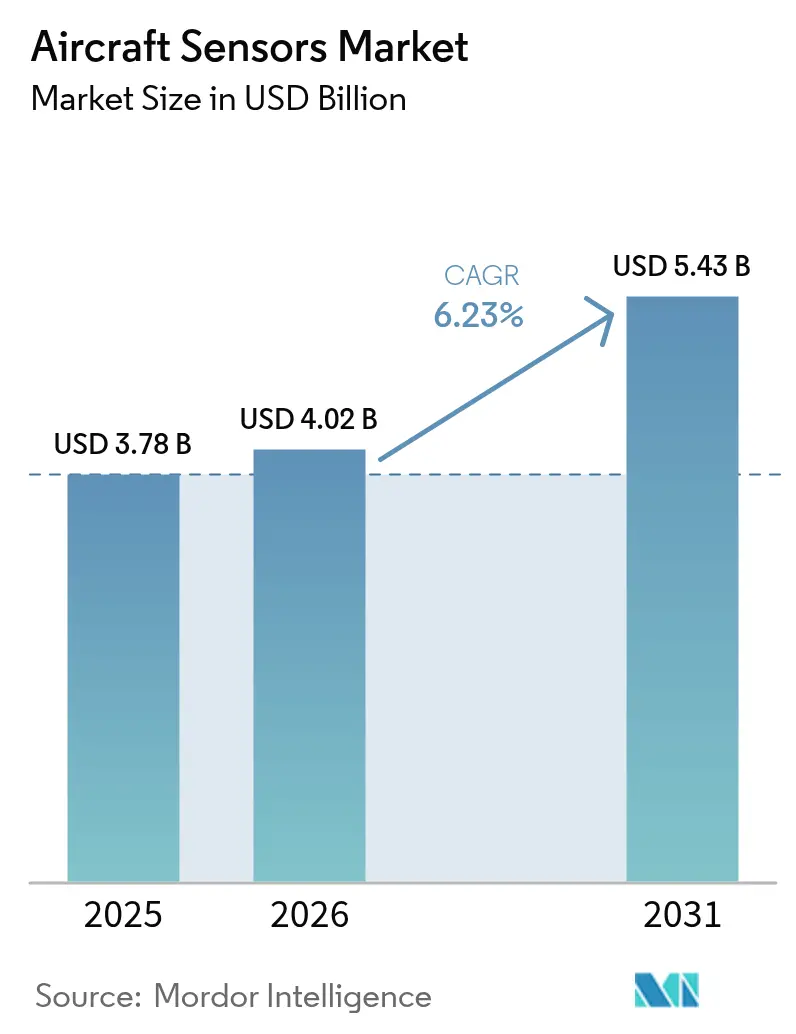
| Market Size (2026) | USD 4.02 Billion |
| Market Size (2031) | USD 5.43 Billion |
| Growth Rate (2026 - 2031) | 6.23% CAGR |
| Fastest Growing Market | Asia Pacific |
| Largest Market | North America |
| Market Concentration | Medium |
Major Players *Disclaimer: Major Players sorted in no particular order Image © Mordor Intelligence. Reuse requires attribution under CC BY 4.0. | |
Aircraft Sensors Market Analysis by Mordor Intelligence
Aircraft sensors market size in 2026 is estimated at USD 4.02 billion, growing from 2025 value of USD 3.78 billion with 2031 projections showing USD 5.43 billion, growing at 6.23% CAGR over 2026-2031. This trajectory reflects sustained fleet expansion, the migration to fly-by-wire control systems, and rising adoption of predictive maintenance services. Operators are compelled to upgrade sensing suites after the Federal Aviation Administration (FAA) tightened airborne collision-avoidance rules in 2024, while engine makers introduced higher-temperature sensors that support sustainable aviation fuel (SAF) combustion. Radar-based weather and hazard-avoidance products gained momentum as carriers sought to mitigate climate-driven turbulence risk. Military buyers accelerated modernization, funding a USD 270 million infrared upgrade for the F-22 Raptor and expanding orders for autonomous platforms that depend on dense, rugged sensor networks.[1]Source: Federal Aviation Administration, “Equipment, Systems, and Network Information Security Protection,” federalregister.gov Suppliers that combined sensor hardware with cloud analytics captured premium contracts, yet global shortages of aerospace-grade semiconductors stretched lead times and intensified qualification hurdles.
Key Report Takeaways
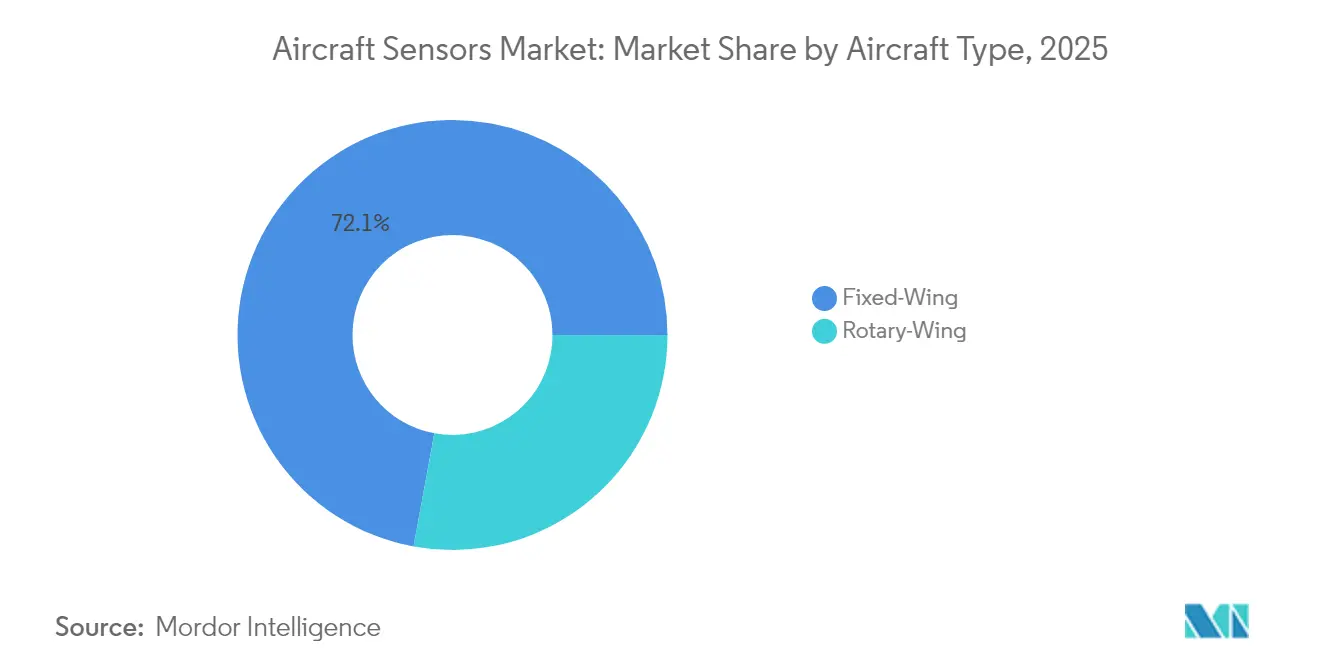
- By aircraft type, fixed-wing platforms held 72.10% of the aircraft sensors market share in 2025, while the military aviation sub-segment is projected to record an 8.18% CAGR through 2031.
- By sensor type, pressure sensors led with 29.20% revenue share in 2025; radar sensors are forecasted to expand at a 9.61% CAGR to 2031.
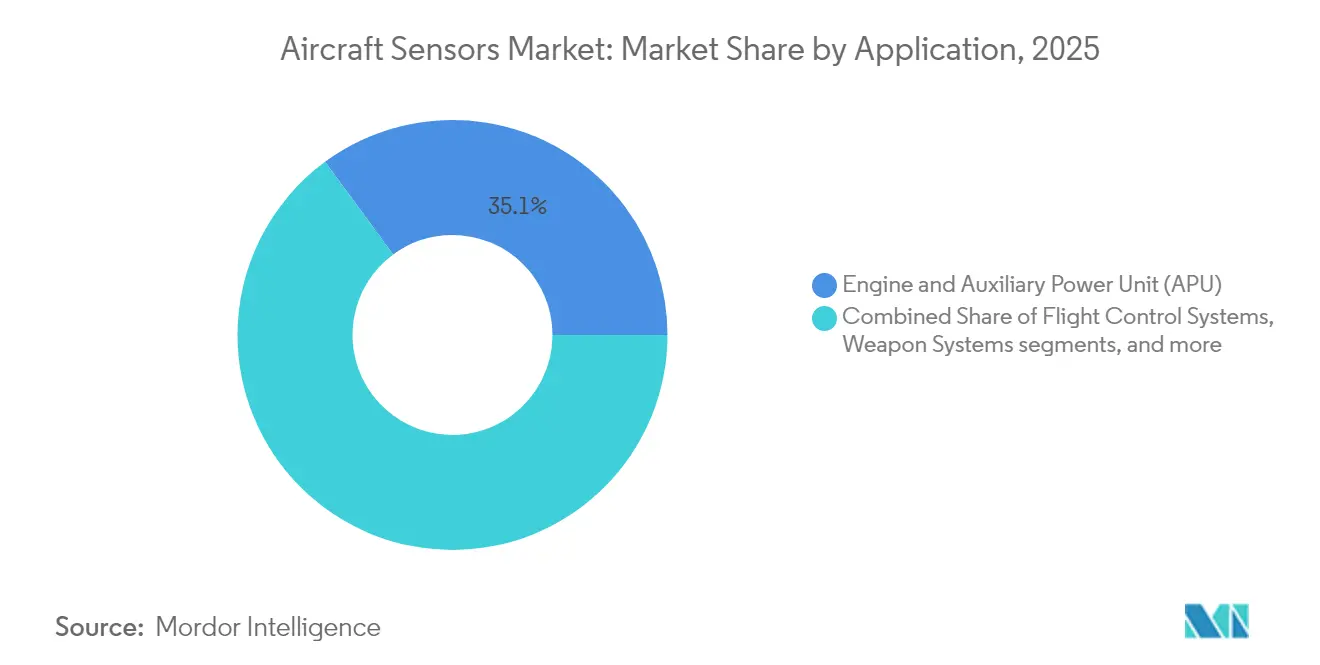
- By application, engine and APU systems accounted for a 35.10% share of the aircraft sensors market size in 2025, whereas flight-control systems are set to grow at a 7.42% CAGR over the same horizon.
- By end user, OEM installations represented 74.65% of total demand in 2025; the aftermarket/MRO segment is advancing at a 7.54% CAGR on predictive-maintenance uptake.
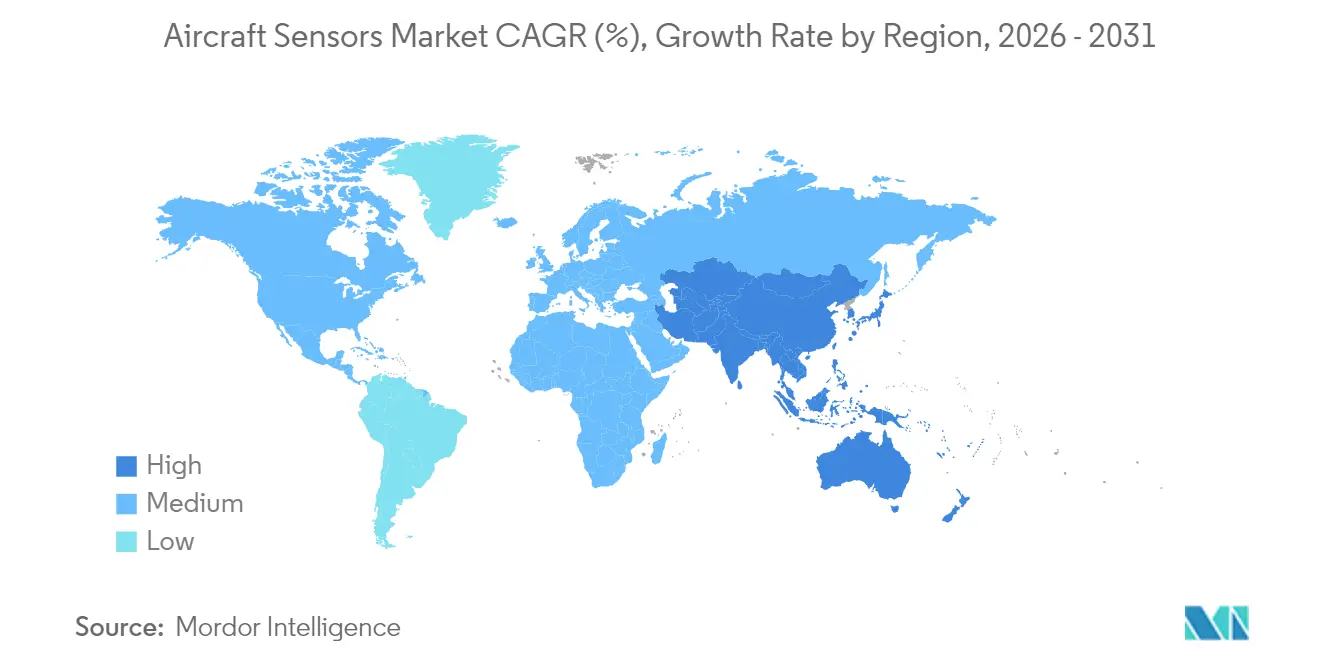
- By geography, North America retained 42.10% of the aircraft sensors market in 2025, but Asia–Pacific is poised for the fastest expansion, with a 7.71% CAGR through 2031.
Note: Market size and forecast figures in this report are generated using Mordor Intelligence’s proprietary estimation framework, updated with the latest available data and insights as of 2026.
Global Aircraft Sensors Market Trends and Insights
Drivers Impact Analysis*
| Driver | (~) % Impact on CAGR Forecast | Geographic Relevance | Impact Timeline |
|---|---|---|---|
| Accelerated adoption of fly-by-wire and health-monitoring architectures | +1.2% | Global, concentrated in North America and Europe | Medium term (2-4 years) |
| Shift to SAF-ready engines driving high-accuracy thermal sensing | +0.8% | Global, led by North America and EU regulatory zones | Long term (≥ 4 years) |
| FAA mandate on airborne collision-avoidance upgrades | +0.9% | North America primary, spillover to international operators | Short term (≤ 2 years) |
| Mainstream drivers-as-a-service platforms for connected fleets | +0.7% | Global, early adoption in North America and Asia-Pacific | Medium term (2-4 years) |
| Additive-manufactured sensor housings reducing unit cost | +0.5% | Global manufacturing hubs, focused in North America and Europe | Long term (≥ 4 years) |
| Edge-AI-enabled self-calibrating sensors lowering MRO spend | +0.6% | Global, faster uptake in developed markets | Medium term (2-4 years) |
| Source: Mordor Intelligence | |||
Accelerated Adoption of Fly-by-Wire and Health-Monitoring Architectures
Aircraft programs shifted from mechanical linkages to electronic flight-control systems that rely on triple-redundant sensors for every critical parameter. Collins Aerospace demonstrated its Enhanced Power and Cooling System on the F-35, doubling thermal capacity to support energy-intensive sensor loads.[2]Source: RTX, “Collins Aerospace EPACS Power and Thermal Management System Ready for Aircraft Integration,” rtx.com Airlines integrated structural-health-monitoring suites that cut downtime by 30% when combined with predictive analytics from real-time sensor streams. Sensor fusion software stitched pressure, inertial, and radar feeds into a unified flight picture, improving autopilot responsiveness and enabling single-pilot operations.
Shift to SAF-Ready Engines Driving High-Accuracy Thermal Sensing
SAF blends alter combustor temperature profiles, prompting engine makers to specify thermocouples capable of surviving 1,400°F environments—nearly triple the limit of erstwhile transducers. The US Department of Energy’s SAF Grand Challenge targeted 3 billion gallons of annual output by 2030, stimulating demand for fuel-quality and emissions sensors across supply chains. Airlines are deploying SAF-equipped digital fuel-flow meters and exhaust-gas sensors to verify carbon-reduction claims required for tax credits.
FAA Mandate on Airborne Collision-Avoidance Upgrades
In 2024, the FAA moved from TCAS II to ACAS Xa protocols, obliging carriers to retrofit transponder-linked radar and optical sensors that simultaneously process multilateration, ADS-B, and satellite inputs. EUROCONTROL projected a fivefold decline in mid-air collision risk once ACAS penetrated the fleet. Military adoption surged as the US Army selected Northrop Grumman’s ATHENA sensor to enhance low-altitude threat recognition.
Mainstream Drivers-as-a-Service Platforms for Connected Fleets
Sensor-enabled subscription services accelerated, led by Honeywell’s Ensemble platform, which streamed engine and environmental data to cloud dashboards, slashing unscheduled events by 35%. The Airbus-Delta-GE Skywise alliance added thousands of aircraft, illustrating the economics of outcome-based maintenance contracts. Vendors monetized data through predictive algorithms while guaranteeing dispatch reliability, creating recurring revenue that insulated them from aircraft production cycles.
Restraints Impact Analysis*
| Restraint | (~) % Impact on CAGR Forecast | Geographic Relevance | Impact Timeline |
|---|---|---|---|
| Persistent supply-chain crunch of aerospace-grade ASICs | -1.1% | Global, acute impact in North America and Europe | Short term (≤ 2 years) |
| Certification backlog slowing new sensor design-ins | -0.8% | Global, concentrated in major certification authorities | Medium term (2-4 years) |
| Cyber-hardening requirements inflating BOM cost | -0.6% | Global, stricter rules in developed markets | Long term (≥ 4 years) |
| Export-control tightening on MEMS IMUs | -0.4% | Global, notably Asia-Pacific supply chains | Medium term (2-4 years) |
| Source: Mordor Intelligence | |||
Persistent Supply-Chain Crunch of Aerospace-Grade ASICs
Lead times for radiation-tolerant processors and mixed-signal ASICs lengthened to 40 weeks, overshadowing pre-pandemic norms of 12 weeks. Aviation represented less than 2% of global chip demand, leaving it low on foundry priority lists. Consultancies reported that 66% of aerospace Tier-1s struggled with allocation shortfalls in 2025. Airframers stocked safety-critical devices, yet inventory buffers raised working-capital needs and delayed retrofit schedules.
Certification Backlog Slowing New Sensor Design-ins
New DO-178C and DO-254 rules expanded software and hardware assurance artifacts, pushing average avionics approval cycles to three years. EASA’s revision of Technical Standard Orders aimed to streamline reviews but still demanded extensive documentation for AI-enabled sensors, where algorithms evolve during service. Smaller suppliers struggled to fund test campaigns, delaying the entry of innovative MEMS devices and curbing competitive pressure.
*Our forecasts treat driver/restraint impacts as directional, not additive. The impact forecasts reflect baseline growth, mix effects, and variable interactions.
Segment Analysis
By Aircraft Type: Military Aviation Drives Modernization
Fixed-wing programs dominated demand, capturing 72.10% of the aircraft sensors market share in 2025 on the strength of commercial jet deliveries. The aircraft sensors market size for fixed-wing applications is projected to exceed USD 3.6 billion by 2031 at a 5.69% CAGR. Within that total, military aviation sensors are advancing 8.18% annually as defense ministries retrofit legacy fighters with wide-area infrared, radar, and electronic-warfare suites. Lockheed Martin’s F-22 upgrade illustrated the premium paid for 360-degree passive surveillance.
Rotorcraft and tilt-rotor fleets embraced multispectral cameras and lidar for obstacle avoidance during low-altitude operations. Collins Aerospace’s perception-sensing system enabled automated landing in degraded visual conditions. Cross-pollination of software-defined sensor processors between rotorcraft and fighter jets cut non-recurring engineering costs, compressing time-to-market for export variants. As autonomous cargo drones scale, demand for lightweight inertial and barometric modules will reinforce the expansion of the aircraft sensors market across all airframe classes.


By Sensor Type: Radar Systems Lead Innovation
Pressure devices remained foundational underlying pitot-static, environmental-control, and engine-oil systems with stable, high-volume shipments. Still, radar units registered the steepest growth at 9.61% CAGR as airlines sought advanced turbulence prediction and de-icing advisory features. The aircraft sensors market size for radar is forecast to reach USD 1.34 billion by 2031, reflecting both retrofit and line-fit programs. ACAS Xa requirements further boosted airborne surveillance radars for regional jets.
Edge-AI packages integrated radar, lidar, and optical inputs on a single board, reducing wiring by 20% and enabling condition-based antenna calibration. MEMS accelerometers and proximity detectors benefited from automotive cost curves yet continued to undergo supplemental screening to meet RTCA DO-160 vibration profiles. Temperature and flow sensor designers added cybersecurity wrappers to satisfy imminent FAA network-security mandates, raising bill-of-materials cost but cementing long-term service revenue prospects.
By Application: Flight Control Systems Accelerate Growth
Propulsion-related installations generated the largest revenue pool, accounting for 35.10% of the aircraft sensors market size in 2025 as turbofan makers embedded hundreds of sensors to monitor combustion dynamics and bearing loads. The shift toward geared turbofan and open-rotor architectures introduced higher thermal and vibratory stresses, which required next-generation fiber-optic strain gauges. Meanwhile, fly-by-wire expansion drove a 7.42% CAGR in flight-control-system sensors, a pace that outperformed all other domains.
Digital control-surface actuators demanded position and torque feedback with 10-bit resolution, spurring volume orders for contactless Hall-effect devices. Cabin-environment applications gained from increased humidity-control requirements on long-haul jets, integrating air-quality and particulate sensors derived from industrial cleanroom technology. Landing-gear load sensors migrated to wireless formats to trim wiring weight, while weapons-bay pressure devices incorporated fail-safe redundancy to achieve two-fault tolerance demanded by defense customers.
By End User: Aftermarket Gains Momentum
OEM fitment accounted for 74.65% of 2025 unit shipments as airframes left factories with full sensor suites. However, predictive maintenance platforms triggered a 7.54% CAGR in the aftermarket, pushing operators to retrofit wireless gateway modules that stream health data once aircraft land. The aircraft sensor industry witnessed airlines allocate capital for sensor-as-a-service arrangements that transfer ownership to vendors in exchange for guaranteed availability.
Component pooling widened, and MROs stocked standard-fit MEMS inertial units that cater to multiple fleets, cutting turnaround times. Asia–Pacific’s maintenance spending is projected to reach USD 109 billion by 2043, implying sustained demand for replacement sensors that meet regional Civil Aviation Administration of China guidelines. Independent repair stations invested in automated calibration benches to reduce cycle times from weeks to days.
Geography Analysis
North America retained 42.10% of global demand in 2025, benefiting from major airlines' elevated Pentagon outlays and fleet-modernization campaigns. Domestic sensor suppliers leveraged early engagement with the FAA to shape standards, enhancing export prospects once rules were adopted abroad. Yet the reliance on offshore chip fabrication prompted Washington to allocate USD 52 billion under the CHIPS Act to bolster local microelectronics capacity.
Asia–Pacific recorded the highest growth rate at 7.71% CAGR as carriers expanded narrowbody fleets and governments funded Indigenous sensor programs to mitigate export-control risks. China's aviation services value was forecast to hit USD 61 billion by 2043, eclipsing every single country market. Japanese and Korean manufacturers collaborated on MEMS inertial modules for urban-air-mobility vehicles, while India advanced roadmaps for domestically produced air-data sensors to support regional jet projects.
Europe remained a technology bellwether, enforcing stringent sustainability and cybersecurity rules that fostered sensor innovation. Thales completed the Cobham Aerospace Communications acquisition, reinforcing avionics portfolios that blend sensors and secure datalinks. EASA's harmonization with the FAA facilitated reciprocal acceptance of approvals, but suppliers still navigated separate documentation streams. The region emphasized SAF validation instrumentation and non-CO₂ emissions monitoring as part of its Fit-for-55 climate package.

Competitive Landscape
The aircraft sensors market displayed moderate concentration. Honeywell, Collins Aerospace, and Thales remained entrenched through extensive certification credentials and vertically integrated offerings that stretch from MEMS fabrication to analytics dashboards. Their scale allowed multi-year fixed-price bids that newcomers could not match. Strategic plays focused on digital services: Honeywell acquired Civitanavi Systems to deepen inertial navigation know-how, while Collins Aerospace launched subscription-based health-monitoring modules for the A320 and B737 families.
Supply-chain resilience became a differentiator. GE Aerospace applied 3D printing to bleed-air valves, yielding 35% cost savings and freeing capacity for chip allocations. Mid-tier firms pursued specialization; Curtiss-Wright secured a USD 80 million IDIQ contract for high-speed data-acquisition recorders supporting the US Air Force flight-test programs. Cybersecurity standards such as the FAA Aircraft Network Security Program favored incumbents able to embed encryption and intrusion detection directly in sensor firmware, erecting entry barriers for low-cost competitors.
White-space opportunities persisted in AI-enabled sensor fusion, additive-manufactured housings, and condition-based lubrication sensors for electric-propulsion architectures. Venture-backed start-ups targeted these niches, yet long certification queues and capital intensity limited their near-term influence. Overall, price competition centered on mature pressure and temperature devices, while high-performance radar and infrared modules commanded double-digit operating margins.
Aircraft Sensors Industry Leaders
Honeywell International Inc.
Safran SA
TE Connectivity Corporation
AMETEK Aerospace, Inc.
RTX Corporation
- *Disclaimer: Major Players sorted in no particular order

Recent Industry Developments
- September 2025: Crane Company announced the USD 1.06 billion purchase of Precision Sensors & Instrumentation, strengthening its pressure-sensor line for environmental control and engine monitoring systems.
- January 2025: Lockheed Martin received a USD 270 million contract to outfit the F-22 with advanced infrared defensive sensors that deliver 360-degree threat awareness.
- January 2025: Honeywell and NXP Semiconductors deepened their cooperation on AI-enabled avionics processors for next-generation cockpits.


Research Methodology Framework and Report Scope
Market Definitions and Key Coverage
Our study defines the aircraft sensors market as revenue generated from factory-installed and major retrofit sensors that monitor pressure, temperature, position, flow, radar, accelerometer, proximity, and other critical parameters aboard fixed-wing and rotary-wing civil and military aircraft throughout their life cycle. According to Mordor Intelligence, this includes hardware, supporting electronics, and firmware sold by OEMs and tier-one suppliers for new-build and heavy-maintenance events.
Scope exclusion: sensors used only on ground test rigs, space launchers, or airport infrastructure fall outside this assessment.
Segmentation Overview
- By Aircraft Type
- Fixed-Wing
- Commercial Aviation
- Narrowbody Aircraft
- Widebody Aircraft
- Regional TJets
- Business and General Aviation
- Business Jets
- Light Aircraft
- Military Aviation
- Fighter Aircraft
- Transport Aircraft
- Special Mission Aircraft
- Commercial Aviation
- Rotary-Wing
- Commercial Helicopters
- Military Helicopters
- Fixed-Wing
- By Sensor Type
- Pressure
- Temperature
- Position
- Flow
- Torque
- Radar
- Accelerometers
- Proximity
- Other Sensors
- By Application
- Fuel,Hydraulic and Pneumatic Systems
- Engine and Auxiliary Power Unit (APU)
- Cabin and Cargo Environmental Controls
- Flight Control Systems
- Flight Decks
- Landing Gear Systems
- Weapon Systems
- Others
- By End User
- OEM
- Aftermarket/MRO
- Geography
- North America
- United States
- Canada
- Mexico
- South America
- Brazil
- Mexico
- Rest of South America
- Europe
- United Kingdom
- France
- Germany
- Italy
- Spain
- Russia
- Rest of Europe
- Asia-Pacific
- China
- Japan
- India
- South Korea
- Australia
- Rest of Asia-Pacific
- Middle East and Africa
- Middle East
- Saudi Arbaia
- Israel
- United Arab Emirates
- Rest of Middle East
- Africa
- South Africa
- Rest of Africa
- Middle East
- North America
Detailed Research Methodology and Data Validation
Primary Research
Interviews and structured surveys with avionics engineers, airline MRO planners, and sensor design leads across North America, Europe, and Asia helped us fine-tune average selling prices, verify sensors-per-aircraft ratios, and stress-test retrofit penetration curves before locking the model.
Desk Research
Mordor analysts first map the fleet and production pool using open datasets such as FAA and EASA type-certificate files, ICAO traffic statistics, UN Comtrade shipment codes for HS 903289, and defense procurement releases from SIPRI and national budget papers. Trend articles and component teardowns in journals like SAE Aerospace Engineering, together with company 10-Ks and investor decks, provide cost benchmarks and design-in rates.
To validate corporate exposure and competitive intensity, we pull revenue splits from D&B Hoovers, parse program milestones through Dow Jones Factiva, and cross-check aircraft delivery logs on Aviation Week. The sources listed are illustrative; many additional publications and portals were consulted during data collation and clarification.
Market-Sizing & Forecasting
A top-down build starting with annual aircraft deliveries, in-service fleet counts, defense platform orders, and mean sensors-per-airframe establishes the demand pool, which is then corroborated through selective bottom-up supplier roll-ups and channel checks. Key variables like airframe production schedules, defense procurement budgets, average sensor ASP, retrofit cycle length, and wireless adoption rates feed a multivariate regression with scenario analysis to project demand through 2030. Where supplier data are missing, region-specific ASP proxies are fitted using three-year moving averages before triangulation.
Data Validation & Update Cycle
Outputs pass variance checks against historical fleet growth, component shipment volumes, and import values. An internal senior analyst review flags anomalies for re-contact. Reports refresh yearly, and material events such as major program delays trigger interim revisions so clients receive our latest view.
Why Mordor's Aircraft Sensors Baseline Commands Reliability
Published estimates often diverge because firms pick different sensor families, pricing ladders, and forecast start dates. Our disciplined scope definition, live fleet reconciliation, and annual refresh minimize such drift.
Key gap drivers include whether UAV payloads are folded in, how retrofit spend is treated, and the aggressiveness of ASP inflation assumptions. Mordor excludes ground-only systems, reports civilian and military aircraft together, yet splits retrofit separately, and applies transaction-level pricing captured through active interviews.
Benchmark comparison
| Market Size | Anonymized source | Primary gap driver |
|---|---|---|
| USD 3.78 B (2025) | Mordor Intelligence | - |
| USD 7.36 B (2025) | Global Consultancy A | Bundles avionics-wide electronics, counts full MRO labor spend, limited primary validation |
| USD 4.00 B (2021) | Industry Journal B | Uses pandemic-year baseline, merges UAV sensors, linear extrapolation without supplier roll-ups |
These comparisons show that when scope inflation and unverified price lifts are stripped out, Mordor's figure offers the most transparent, reproducible baseline for planners seeking dependable market intelligence.


Key Questions Answered in the Report
What is the current aircraft sensors market size and expected growth?
The aircraft sensors market size reached USD 4.02 billion in 2026 and is projected to rise to USD 5.43 billion by 2031, reflecting a 6.23% CAGR.
Which aircraft segment is expanding the fastest for sensor demand?
Military fixed-wing aviation leads, with sensor revenue forecast to climb at an 8.18% CAGR through 2031 as modernization and autonomous-systems procurement accelerate.
Why are radar sensors growing more quickly than other sensor types?
Regulatory shifts toward ACAS Xa collision-avoidance and heightened weather-hazard awareness are driving a 9.61% CAGR for radar sensors, the highest among all categories.
How will supply-chain constraints influence sensor availability?
Extended lead times for aerospace-grade semiconductors are expected to dampen near-term growth by about 1.1 percentage points, pushing suppliers to localize or redesign electronics.
What regions present the largest growth opportunities?
Asia–Pacific is set to expand at 7.71% CAGR, propelled by fleet additions and domestic sensor-manufacturing initiatives aimed at reducing reliance on imported technology.
How are service-based business models changing market dynamics?
Platforms that bundle sensors with predictive-maintenance analytics let airlines shift capital spending to operating expenses, fostering aftermarket growth and recurring revenue for suppliers.
Page last updated on:


