Market Overview
| Study Period | 2019 - 2031 |
|---|---|
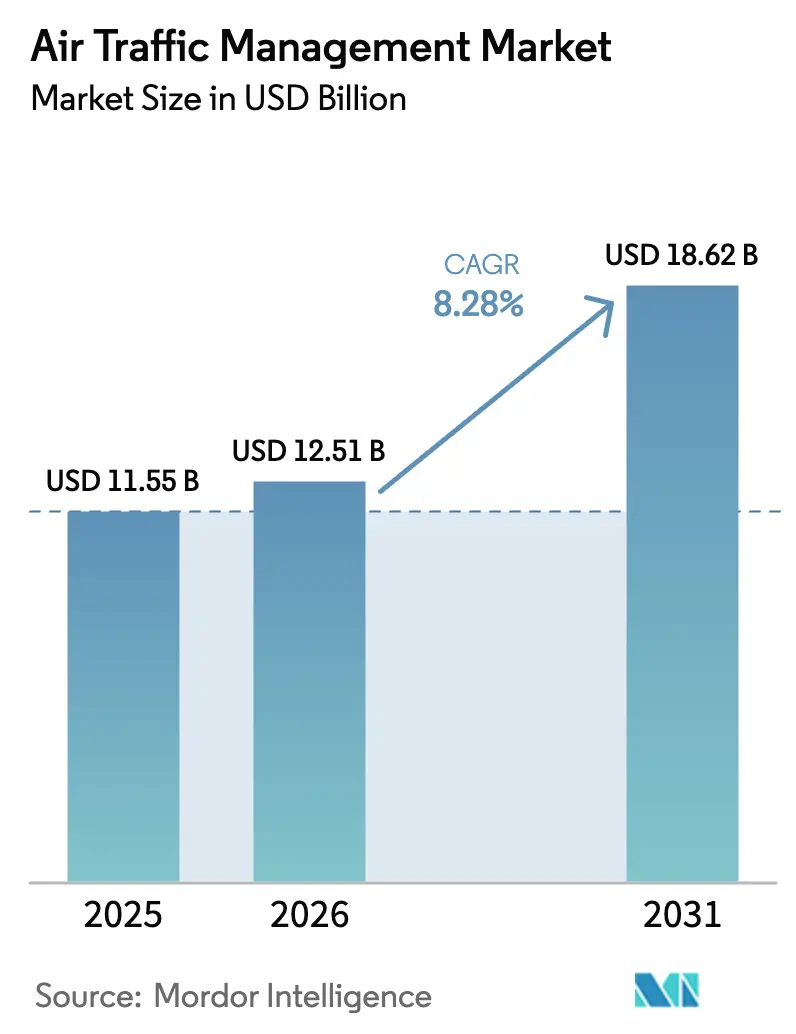
| Market Size (2026) | USD 12.51 Billion |
| Market Size (2031) | USD 18.62 Billion |
| Growth Rate (2026 - 2031) | 8.28% CAGR |
| Fastest Growing Market | Asia Pacific |
| Largest Market | North America |
| Market Concentration | Medium |
Major Players *Disclaimer: Major Players sorted in no particular order Image © Mordor Intelligence. Reuse requires attribution under CC BY 4.0. | |
Air Traffic Management Market Analysis by Mordor Intelligence
The air traffic management market size is expected to grow from USD 11.55 billion in 2025 to USD 12.51 billion in 2026 and is forecast to reach USD 18.62 billion by 2031, at an 8.28% CAGR over 2026-2031. Strong passenger demand recovery, mandated surveillance upgrades, and the expansion of drone corridors are accelerating the shift from radar-centric hardware to satellite-enabled, software-defined architectures. North America remains the revenue anchor, as NextGen deployments are largely complete; however, the Asia-Pacific region leads incremental growth, with China, India, and Southeast Asia executing parallel runway and satellite augmentation programs. Capital flows are also gravitating toward automation, with AI-based flow-management tools lowering delay minutes and boosting capacity without adding concrete. Competitive intensity is widening as software-native entrants bundle modular applications that integrate easily with legacy surveillance assets, eroding the traditional dominance of defense contractors. Finally, cyber-resilience and controller workforce gaps form a dual constraint, forcing air navigation service providers to balance technology investment with human-capital retention and security hardening.
Key Report Takeaways
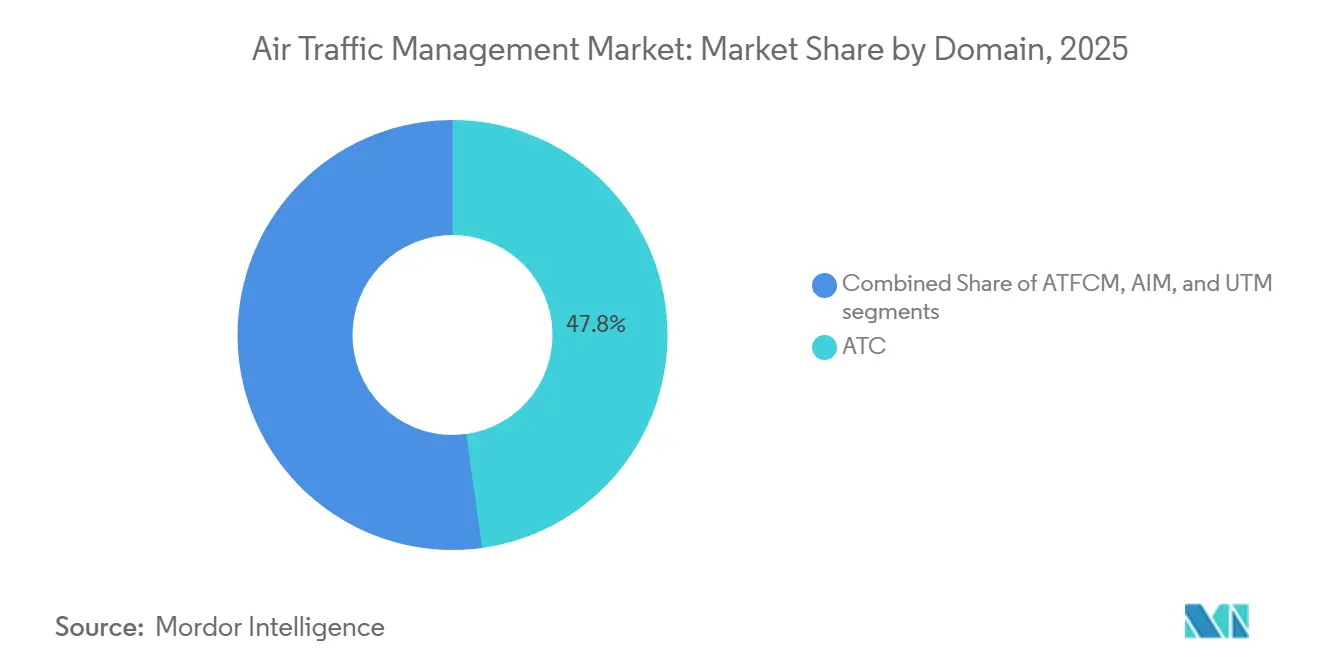
- By domain, air traffic control (ATC) held 47.80% of the air traffic management market share in 2025, while unmanned traffic management (UTM) is expected to expand at an 11.00% CAGR through 2031.
- By component, hardware accounted for 64.10% of the air traffic management market size in 2025; software is advancing at an 8.65% CAGR.
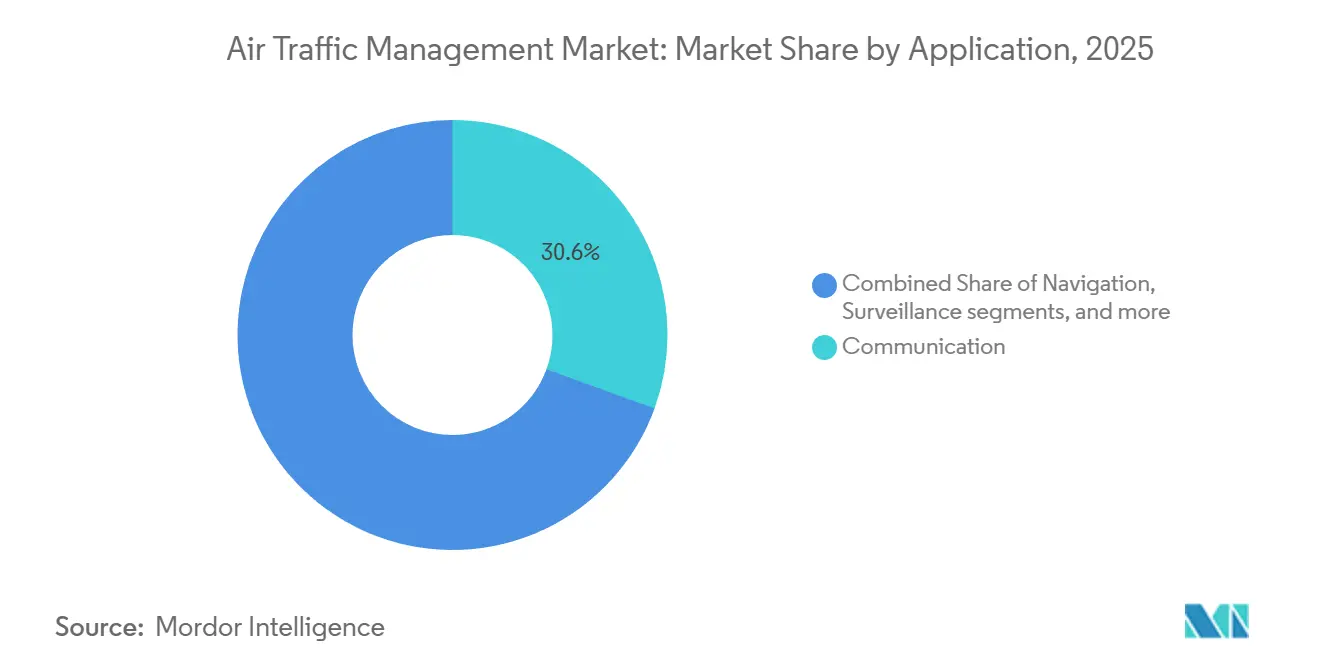
- By application, communication systems retained a 30.55% share in 2025, whereas automation and decision-support tools are growing at a 9.22% CAGR.
- By end-use, commercial aviation accounted for a 63.75% share in 2025; urban air mobility (UAM) and drone operators are projected to expand at an 11.50% CAGR through 2031.
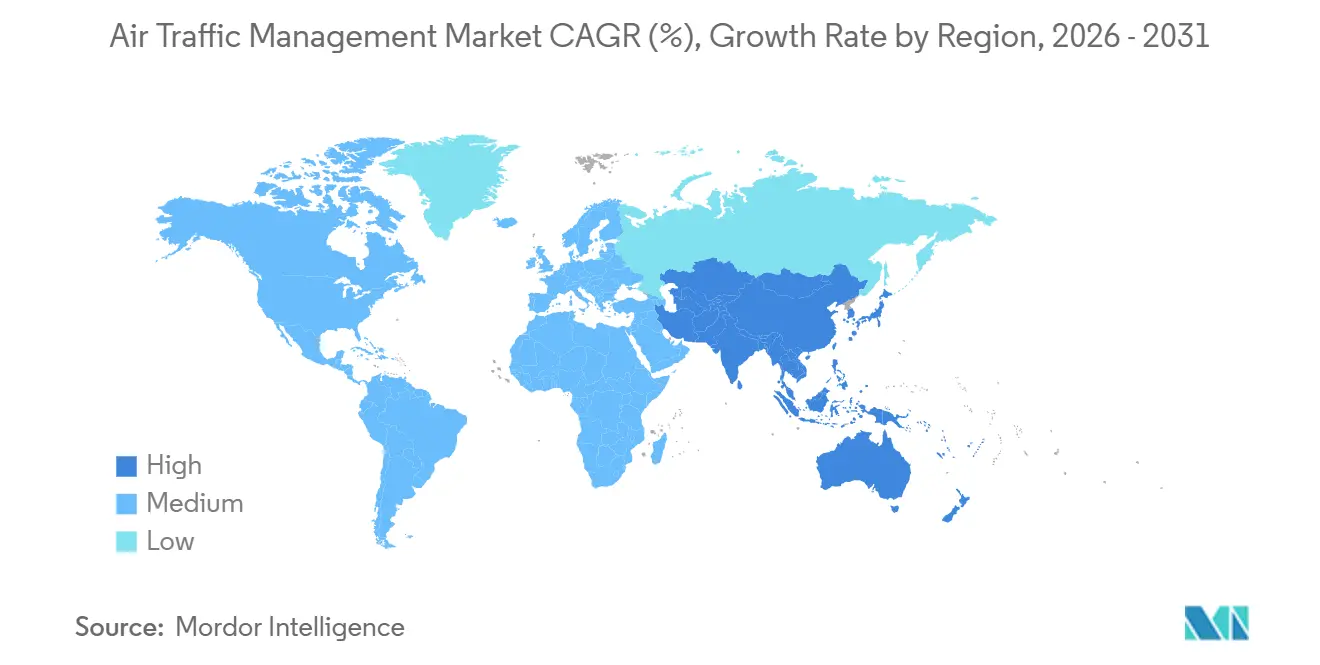
- By geography, North America captured 32.65% of the air traffic management market size in 2025; the Asia-Pacific region is the fastest-growing, with an 8.80% CAGR.
Note: Market size and forecast figures in this report are generated using Mordor Intelligence’s proprietary estimation framework, updated with the latest available data and insights as of January 2026.
Global Air Traffic Management Market Trends and Insights
Drivers Impact Analysis*
| Driver | (~) % Impact on CAGR Forecast | Geographic Relevance | Impact Timeline |
|---|---|---|---|
| Expansion of airport infrastructure to support increasing air traffic | +1.8% | Global, concentrated in APAC and MEA | Medium term (2-4 years) |
| Regulatory mandates for ADS-B and performance-based navigation (PBN) | +1.2% | North America and Europe | Short term (≤ 2 years) |
| Rising commercial drone operations necessitating U-space/UTM integration | +1.5% | North America, Europe, APAC | Medium term (2-4 years) |
| Major investments in NextGen and SESAR digital sky programs | +1.0% | North America and Europe | Long term (≥ 4 years) |
| Adoption of AI-based air traffic flow management solutions | +0.9% | Global | Medium term (2-4 years) |
| Incentives for sustainable flight paths and SAF-compatible ATM systems | +0.6% | Europe and North America | Long term (≥ 4 years) |
| Source: Mordor Intelligence | |||
Expansion Of Airport Infrastructure To Support Increasing Air Traffic
Asia-Pacific and Middle Eastern airport expansions are catalyzing orders for advanced surface-movement and multilateration systems. Beijing Daxing’s satellite terminal added capacity for 45 million annual passengers and required a next-generation A-SMGCS that fuses ground radar, ADS-B, and camera analytics in real time.[1]Source: Civil Aviation Administration of China, “Airport Expansions,” caac.gov.cn India awarded USD 1.2 billion to modernize 37 airports with digital towers and multilateration, compressing controller workload while preserving safety margins. Saudi Arabia has committed USD 800 million to upgrade two hubs with satellite-based augmentation, aiming to double passenger throughput by 2030. Each project establishes an integrated digital backbone that links runway assets, en-route centers, and cockpit avionics, positioning the region for sustained traffic growth that can no longer rely solely on legacy radar. IATA forecasts that the Asia-Pacific region will host 50% of global traffic by 2030, making modernization a necessity rather than a discretionary upgrade.
Regulatory Mandates For ADS-B And Performance-Based Navigation
ADS-B and PBN rules are compressing upgrade cycles in both hardware and software in the Air Traffic Management Market. FAA mandates already require ADS-B Out, and advisory texts issued in 2024 incentivize cockpit displays that leverage ADS-B In for traffic situational awareness. Europe extended PBN requirements to 140 airports by 2025, enabling more fuel-efficient routings and reducing average consumption by 5-8% per flight. Japan’s ADS-B rule above FL 290 drove radar retirements and satellite ground-station deployments. Compliance flows stimulate immediate hardware demand while creating sustained software opportunities, as raw ADS-B data streams require sophisticated filtering to avoid controller overload. ICAO reports 85% global ADS-B coverage by 2025, though interoperability gaps remain.
Rising Commercial Drone Operations Necessitating U-Space/UTM Integration
Drone traffic is driving the need for a parallel management fabric. EU-level rules mandate electronic IDs and automated conflict resolution in U-space zones across 28 countries, enabling high-density drone delivery while maintaining the safety of manned flights. The FAA’s UTM pilot sites now support BVLOS operations by Amazon, Wing, and UPS, demonstrating scalable coordination at low altitudes. China issued five UTM licenses covering corridors where daily drone flights top 3,000, underscoring the commercial viability of automated de-confliction. NASA trials showed 50 simultaneous urban drone flights can coexist safely using automated rulesets, a density infeasible with voice-based ATC.[2]Source: National Aeronautics and Space Administration, “UTM Pilot Program,” nasa.gov Consequently, venture capital is flowing to software-centric UTM platforms, signaling long-run convergence between legacy ATC and emerging drone ecosystems.
Major Investments In NextGen And SESAR Digital-Sky Programs
NextGen and SESAR allocate multi-billion-dollar budgets toward digitizing airspace. NextGen surpassed a cumulative spend of USD 7.8 billion by 2025, with data comm text clearances at 89 towers, shaving 3.2 minutes off the average departure times. SESAR’s Digital European Sky earmarks EUR 1.60 billion (USD 1.88 billion) through 2030 for cloud-hosted services, AI-powered trajectory prediction, and virtual centers that allow controllers to manage any sector from any certified workstation. Standardized APIs lower the entry barrier for third-party applications such as predictive maintenance and high-resolution weather feeds, mirroring the telecom shift from vertically integrated to platform ecosystems. These long-term investments underpin structural growth in the air traffic management market.
Restraints Impact Analysis*
| Restraint | (~) % Impact on CAGR Forecast | Geographic Relevance | Impact Timeline |
|---|---|---|---|
| Cybersecurity risks in virtualized and network-centric ATM systems | -0.8% | Global, heightened in developed markets | Short term (≤ 2 years) |
| High capital requirements for transitioning from radar to satellite-based CNS/ATM | -1.2% | Developing markets | Medium term (2-4 years) |
| Air navigation service provider (ANSP) workforce gaps and controller fatigue | -1.5% | North America and Europe | Short term (≤ 2 years) |
| Lack of regulatory alignment for cross-border UTM implementation | -0.7% | Global border regions | Long term (≥ 4 years) |
| Source: Mordor Intelligence | |||
Cybersecurity Risks In Virtualized And Network-Centric Systems
Migration to IP-based, cloud architectures exposes fresh attack surfaces. A GAO audit revealed authentication weaknesses in Data Comm, prompting the implementation of mandatory multi-factor logins by 2025.[3]Source: U.S. Government Accountability Office, “NextGen Cybersecurity,” gao.gov EUROCONTROL logged a 34% rise in ANSP intrusion attempts in 2025, with probes targeting satellite links and ADS-B streams. ICAO’s Annex 17 amendment mandates cybersecurity management yet allows compliance deadlines up to 2030, creating near-term risk exposure. European ANSPs plan to spend EUR 500 million (USD 586.62 million) on cyber hardening through 2028, redirecting funds from capacity projects and tempering short-term spending momentum.
High Capital Requirements For Satellite CNS/ATM
A complete migration from radar to satellite surveillance costs USD 200-400 million for a mid-sized ANSP, more than the entire annual budget in many African and South American countries. India’s 10-year plan totals USD 3.5 billion, financed through government loans, public-private partnerships, and other sources of funding. Dual-running costs during the transition amplify the burden in the Air Traffic Management Market, slowing uptake and creating a two-tier capacity landscape where mature markets leap ahead while emerging regions lag.
*Our forecasts treat driver/restraint impacts as directional, not additive. The impact forecasts reflect baseline growth, mix effects, and variable interactions.
Segment Analysis
By Domain: UTM Disrupts Traditional ATC Hegemony
ATC controlled 47.80% of 2025 revenue, UTM shows 11.00% CAGR as drone deliveries and eVTOL networks proliferate. The air traffic management market size for ATC applications remains large because 90% of global passenger flights still depend on controller-pilot voice channels. STARS upgrades at 89 US sites improved conflict detection, illustrating incremental efficiency gains inside legacy paradigms. EUROCONTROL’s AI-assisted slot allocator processed over 30,000 daily flight plans in 2025, signaling that machine-learning layers can be grafted on existing ATC without wholesale replacement. Conversely, UTM’s digital-first design supports automated de-confliction, electronic IDs, and cloud orchestration. Europe’s 28 U-space zones and China’s licensed drone corridors prove commercial viability.
Parallel infrastructure is therefore emerging. Hybrid platforms from Thales and Frequentis already bridge classical air traffic control with low-altitude drone management through shared situational-awareness layers. As global drone flights exceed ICAO’s projection of 10 million daily by 2030, demand for unified, API-rich solutions will intensify. Entrants focusing on software orchestration rather than hardware fabrication find a receptive market, creating new sources of value beyond traditional radar upgrades.


By Component: Software Emerges From Hardware’s Shadow
Hardware still holds a 64.10% share, given the long procurement cycles for radars, ADS-B antennas, and VHF radios; however, software is advancing at an 8.65% CAGR. The air traffic management market share for hardware remains anchored by multi-year contracts, such as Spain’s EUR 120 million (USD 130.50 million) Mode S rollout. L3Harris’ USD 95 million military tower upgrade shows defense demand for solid-state radars. However, virtualized flight-data processors and subscription-based decision-support suites are gaining traction. NAV CANADA cut on-premise servers by 60% after moving to a cloud flight-data system, proving cost advantages.
Software’s value increases as controllers rely on predictive analytics that ingest data from surveillance, weather, and airline preferences. SESAR allocated EUR 600 million (USD 623.54 million) through 2027 for AI trajectory prediction and virtual centers that relocate controller workstations into cloud clusters. Startups can now compete by offering lightweight API modules, as evidenced by Airspace Intelligence’s USD 34 million raise for its AI flight-optimization platform. Recurring licensing revenue reshapes vendor economics, tilting the balance of bargaining power toward agile developers.
By Application: Automation Outpaces Communication
Communication platforms, including VHF and Data Comm, accounted for 30.55% of revenue in 2025; automation solutions grew at the fastest rate, with a 9.22% CAGR. Data Comm text clearance indicates that communication is evolving, but its function remains transactional. Automation layers, in contrast, deploy AI for conflict detection and dynamic reroutes, elevating throughput with minimal human input. EUROCONTROL’s 1.8-minute delay reduction and NASA’s 12% throughput gain validate proof points.
The navigation and surveillance segments are also shifting toward satellite augmentation and space-based ADS-B. Aireon’s global coverage enabled 15-nautical-mile oceanic separation, saving USD 300 million in fuel for transatlantic carriers and demonstrating that surveillance innovations can yield rapid airline paybacks. Automation packages increasingly blend these data streams, underscoring convergence across application silos and supporting further software penetration.
By End-Use: Urban Air Mobility Reshapes Boundaries
Commercial aviation retained a 63.75% share in 2025; nonetheless, UAM and drone operators are projected to grow at an 11.50% CAGR, reshaping the total addressable air traffic management market. Passenger recovery above pre-pandemic levels reinforces commercial aviation spending on capacity upgrades such as virtual centers and digital towers. Military and government demand remains steady, but it gravitates toward commercial-off-the-shelf (COTS) solutions to reduce lifecycle costs, as illustrated by the US Air Force's adoption of COTS platforms.
UAM is scaling rapidly as Joby's type certificate and Volocopter's vertiport trials transition from concept to operation. Drone logistics, with Amazon's projected half a million autonomous flights in 2025, highlight the need for monetizable traffic that requires automated management. These new entrants operate at altitudes that have been historically unmanaged, creating incremental revenue pools for UTM vendors while pressuring regulators to craft integrated rule sets.
Geography Analysis
North America commanded 32.65% revenue in 2025, leveraging mature NextGen assets and the world’s first space-based ADS-B network. FAA Data Comm text clearances handle millions of messages, reducing controller workload and increasing runway throughput during peak periods. NAV CANADA’s polar surveillance unlocked 15-nautical-mile spacing, generating USD 300 million annual airline fuel savings and reinforcing the region’s innovation leadership. Staffing shortages persist; 14% of facilities operate below optimal headcount, which compels overtime and raises the risk of fatigue.
The Asia-Pacific region records the fastest growth at 8.80% CAGR, as China invests USD 1.7 billion in satellite augmentation and India executes a USD 1.2 billion, 37-airport modernization plan. Japan’s ADS-B mandate accelerates the retirement of radar, and Singapore’s SAF-optimized descent trials demonstrate regional leadership in sustainability. Many states leapfrog legacy radar toward satellite CNS/ATM, compressing deployment timelines and lowering long-term maintenance costs. However, financing gaps in parts of Southeast Asia and Oceania still delay full coverage, creating mixed readiness levels across the sub-region.
Europe progresses under the Single European Sky policy and the SESAR Digital Sky initiative, channeling EUR 1.6 billion (USD 1.88 billion) into cloud services and virtual centers. U-space expansion to 28 zones positions the bloc as a drone-traffic pioneer, while also emphasizing cybersecurity following a 34% surge in intrusions. The Middle East invests heavily: Saudi Arabia’s USD 800 million SBAS upgrade aims to double passenger counts by 2030. UAE deploys remote towers to centralize control, demonstrating appetite for technology leapfrogs. South America and Africa lag due to capital constraints; only 18 African states possess ADS-B infrastructure, and multilateration coverage remains patchy. World Bank loans underpin modernization efforts in Brazil, but overall uptake lags behind that of high-income peers.

Competitive Landscape
The air traffic management market is moderately concentrated, with a few multinational suppliers maintaining long-term contracts with ANSPs and possessing significant regulatory expertise. Thales’ USD 1.2 billion contract in India highlights its capability in turnkey platform integration. Collins Aerospace reported USD 1.8 billion in ATM revenue in 2024, driven by its ARINC voice systems, which serve as a foundation for broader upgrade packages. L3Harris secured a USD 95 million contract with the US Air Force for a COTS tower upgrade, demonstrating its appeal in military applications.
Disruption in the market is emerging from software-focused players. Adacel’s AUD 45 million (USD 30.01 million) contract in Australia utilizes a software-defined voice platform that reduces hardware requirements by 50%. SITA’s AirportConnect Open employs standardized APIs to create an app ecosystem similar to mobile app stores, attracting eight third-party vendors within a few months. Frequentis and Leonardo are focusing on certified UTM services in Europe’s U-space, opening a new revenue stream linked to drone traffic. Honeywell’s Forge analytics platform predicts maintenance needs for 15 ANSPs, emphasizing the growing demand for data-driven solutions to optimize system uptime.
Strategic collaborations are expanding into areas such as space-based surveillance and blockchain for data integrity. Northrop Grumman is partnering with Aireon to extend ADS-B coverage into polar regions. At the same time, ICAO’s 2024 patent filing for blockchain-based flight-plan verification indicates institutional interest in distributed ledger technologies. The competitive landscape is shifting toward expertise in cloud computing, artificial intelligence, and open-API strategies, moving beyond the traditional focus on radar manufacturing capabilities.
Air Traffic Management Industry Leaders
Thales Group
RTX Corporation
L3Harris Technologies, Inc.
Honeywell International Inc.
Indra Sistemas, S.A.
- *Disclaimer: Major Players sorted in no particular order

Recent Industry Developments
- September 2025: Thales and Stinville secured a contract with CORPAC to implement the TopSky-AMHS system, a critical step in Peru's air traffic modernization. Spanning over 35 sites, the system will enhance communication between air traffic control centers, airports, and international ANSPs, ensuring compliance with ICAO standards. This initiative strengthens Thales's position in South America's aviation sector while advancing Peru's aeronautical infrastructure. Strategically, it enhances regional connectivity across the Americas, Europe, and Central America, positioning Peru as a pivotal hub in global air traffic management and driving operational efficiency in the region.
- September 2025: SITA launched the ATC Bridge, a SaaS cloud-based platform designed to address the limitations of legacy air traffic control communication systems. This development enables Civil Aviation Authorities and ANSPs to enhance operational efficiency through secure, scalable, and cost-effective communication.


Research Methodology Framework and Report Scope
Market Definitions and Key Coverage
Our study defines the air traffic management (ATM) market as every civil-use system, sub-system, and software suite that enables aircraft to communicate, navigate, monitor, and receive automated sequencing while moving through controlled airspace or on airport surfaces. This spans conventional air traffic control centers, flow-management tools, aeronautical information services, and emerging unmanned traffic management layers.
Scope exclusion: purely military-only command-and-control networks that never interface with civil aviation regulations are outside the estimate.
Segmentation Overview
- By Domain
- Air Traffic Control (ATC)
- Air Traffic Flow and Capacity Management (ATFCM)
- Aeronautical Information Management (AIM)
- Unmanned Traffic Management (UTM)
- By Component
- Hardware
- Software
- Services
- By Application
- Communication
- Navigation
- Surveillance
- Automation and Decision-Support
- By End-use
- Commercial Aviation
- Military and Government
- Urban Air Mobility (UAM) and Drone Operators
- By Geography
- North America
- United States
- Canada
- Mexico
- Europe
- United Kingdom
- France
- Germany
- Italy
- Rest of Europe
- Asia-Pacific
- China
- India
- Japan
- South Korea
- Australia
- Rest of Asia-Pacific
- South America
- Brazil
- Rest of South America
- Middle East and Africa
- Middle East
- United Arab Emirates
- Saudi Arabia
- Qatar
- Rest of Middle East
- Africa
- South Africa
- Rest of Africa
- Middle East
- North America
Detailed Research Methodology and Data Validation
Primary Research
Interviews with air navigation service providers, airport operations heads, avionics OEM product managers, and commercial drone platform strategists across North America, Europe, Asia-Pacific, and the Gulf validated pricing corridors, deployment backlogs, and software license renewal cycles that public sources rarely quantify. The conversations also clarified regional funding constraints before model finalization.
Desk Research
We screened authoritative open data such as ICAO traffic statistics, FAA OPSNET flight movement logs, Eurocontrol PRISME dashboards, and annual traffic bulletins from ACI World and IATA. Regulatory releases on ADS-B mandates, SESAR and NextGen budget papers, and customs shipment records for radar and VHF radios supplemented the base. Where company granularity mattered, Mordor analysts tapped D&B Hoovers and Dow Jones Factiva to cross-check revenue splits and contract awards. The examples above illustrate, not exhaust, the secondary pool consulted for numbers and context.
A second pass connected policy timelines with technology adoption curves, thereby creating a chronology that guides forecast inflection points.
Market-Sizing & Forecasting
A top-down traffic-volume reconstruction begins with 2024 controlled flight movements, seat kilometers, and drone registration counts, which are then valued using sampled average selling prices and service fees. Results are corroborated through selective bottom-up supplier roll-ups and channel checks to fine-tune outliers. Key drivers inside the model include 1) runway additions and capacity utilization, 2) ADS-B equipage rates, 3) capital spending earmarked by major ANSPs, 4) commercial drone flight hour growth, and 5) inflation-adjusted avionics ASP trends. Multivariate regression coupled with scenario analysis projects these variables through 2030, and gaps in bottom-up inputs are bridged with conservative coefficient ranges discussed with interviewees.
Data Validation & Update Cycle
Outputs pass variance thresholds versus independent indicators such as satellite ADS-B feed growth and ANSP budget execution. An internal peer review flags anomalies, followed by a senior sign-off. Reports refresh every twelve months, with interim flashes after material regulatory or traffic shocks.
Why Mordor's Air Traffic Management Baseline Inspires Confidence
Published estimates diverge because firms choose different revenue inclusions, currency treatments, and refresh cadences. Buyers frequently face a spread that complicates budget setting.
Key gap drivers in the current literature stem from whether unmanned traffic platforms are counted, how consulting services are blended with hardware sales, and the rigor of primary cross-checks on regional price dispersion. Mordor's disciplined scope definition, annual refresh, and interview-anchored price books narrow those uncertainties.
Benchmark comparison
| Market Size | Anonymized source | Primary gap driver |
|---|---|---|
| USD 11.55 B (2025) | Mordor Intelligence | - |
| USD 9.38 B (2024) | Global Consultancy A | Omits UTM and values only communication hardware, creating a conservative base |
| USD 14.79 B (2024) | Industry Consultancy B | Aggregates consulting service revenue with system sales, inflating totals |
| USD 11.83 B (2025) | Regional Consultancy C | Holds FX at 2022 levels and layers uniform ASP escalation without interview validation |
Taken together, the comparison shows that Mordor's figure sits mid-range, yet it is the only one transparently tied to verifiable traffic statistics, multi-source price inputs, and a documented annual update cycle, giving decision-makers a replicable and balanced baseline.


Key Questions Answered in the Report
How fast is the air traffic management market growing between 2026 and 2031?
The air traffic management market is expanding at an 8.28% CAGR, climbing from USD 12.51 billion in 2026 to USD 18.62 billion by 2031.
Which segment is projected to be the fastest-growing by 2031?
UTM is forecasted to post an 11.00% CAGR through 2031 as drone deliveries and eVTOL networks scale.
Why is Asia-Pacific attracting the highest growth rate?
Governments in China, India, and Southeast Asia are investing heavily in satellite-based surveillance and new runways, pushing the regional CAGR to 8.80%.
What is driving the shift from hardware to software?
Cloud hosting, virtualized flight-data processors, and AI-based decision support lower capital costs and enable subscription revenue models, prompting faster software adoption.
How are cybersecurity risks being addressed?
ANSPs are implementing multi-factor authentication, allocating dedicated budgets for threat monitoring, and aligning with ICAO Annex 17 cybersecurity management requirements.
Page last updated on:


