
Technology, Media and Telecom
5th MayPricing Strategy for Semiconductor Components
3 Min Read
AI in Education Market is Segmented by Component (Solutions, Services), Deployment Mode (Cloud, On-Premises, Hybrid), End-User (K-12 Schools, Higher Education Institutions, Corporate Training and Skill Development, and More), Application (Intelligent Tutoring Systems, Virtual Facilitators and Learning Environments, and More), Technology (Machine Learning, Natural Language Processing, Computer Vision, and More) and Geography.
Market Overview
| Study Period | 2019 - 2030 |
|---|---|
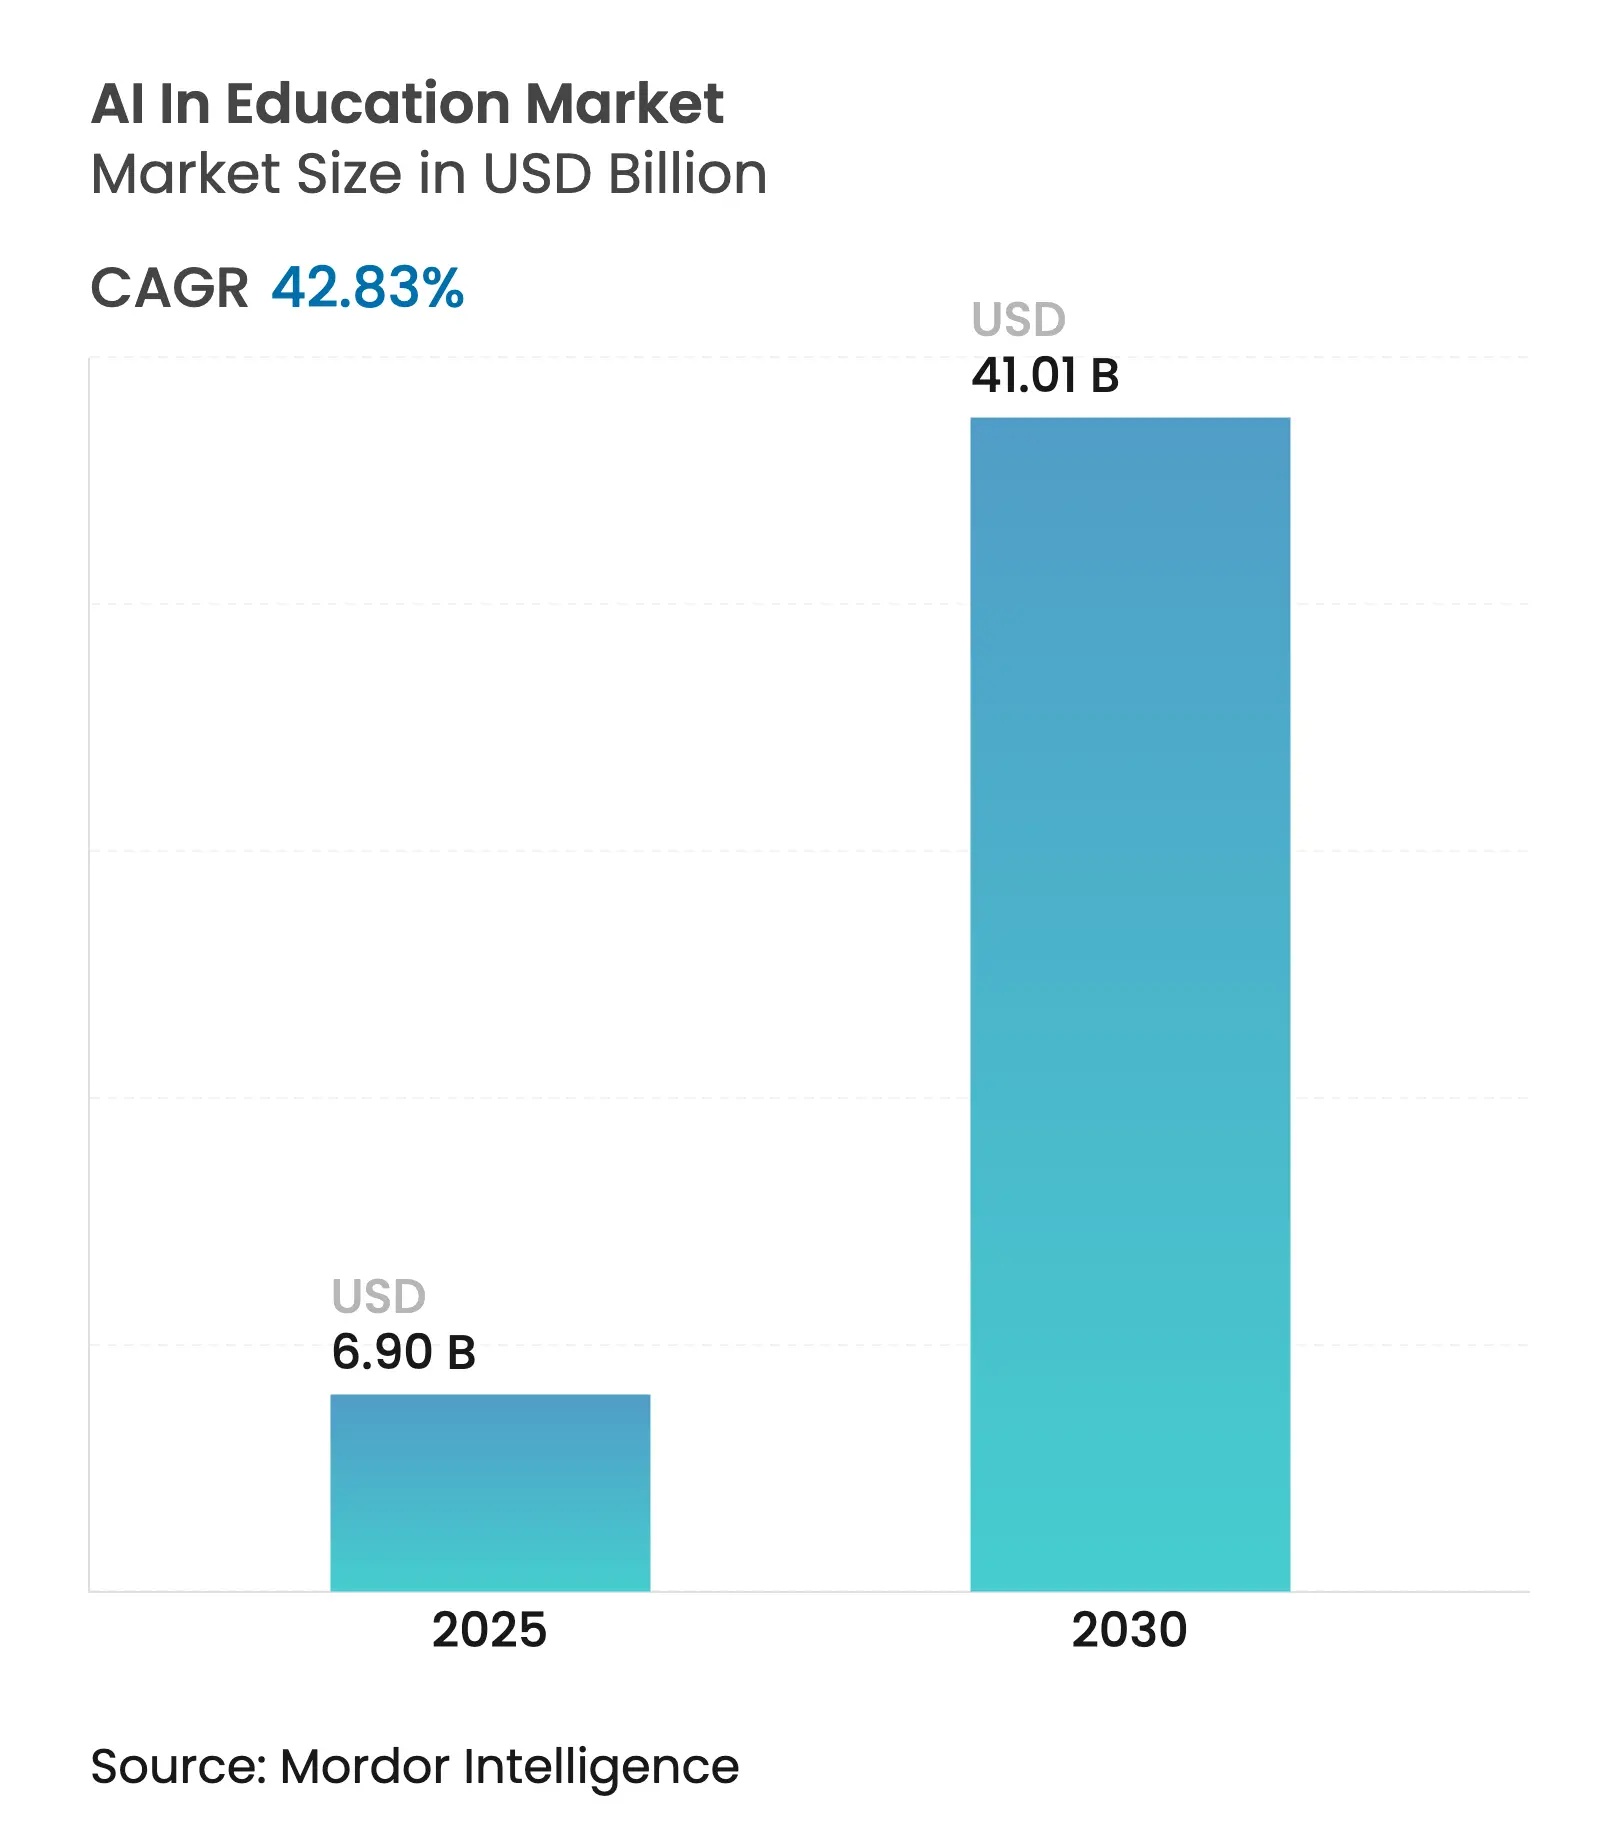
| Market Size (2025) | USD 6.90 Billion |
| Market Size (2030) | USD 41.01 Billion |
| Growth Rate (2025 - 2030) | 42.83 % CAGR |
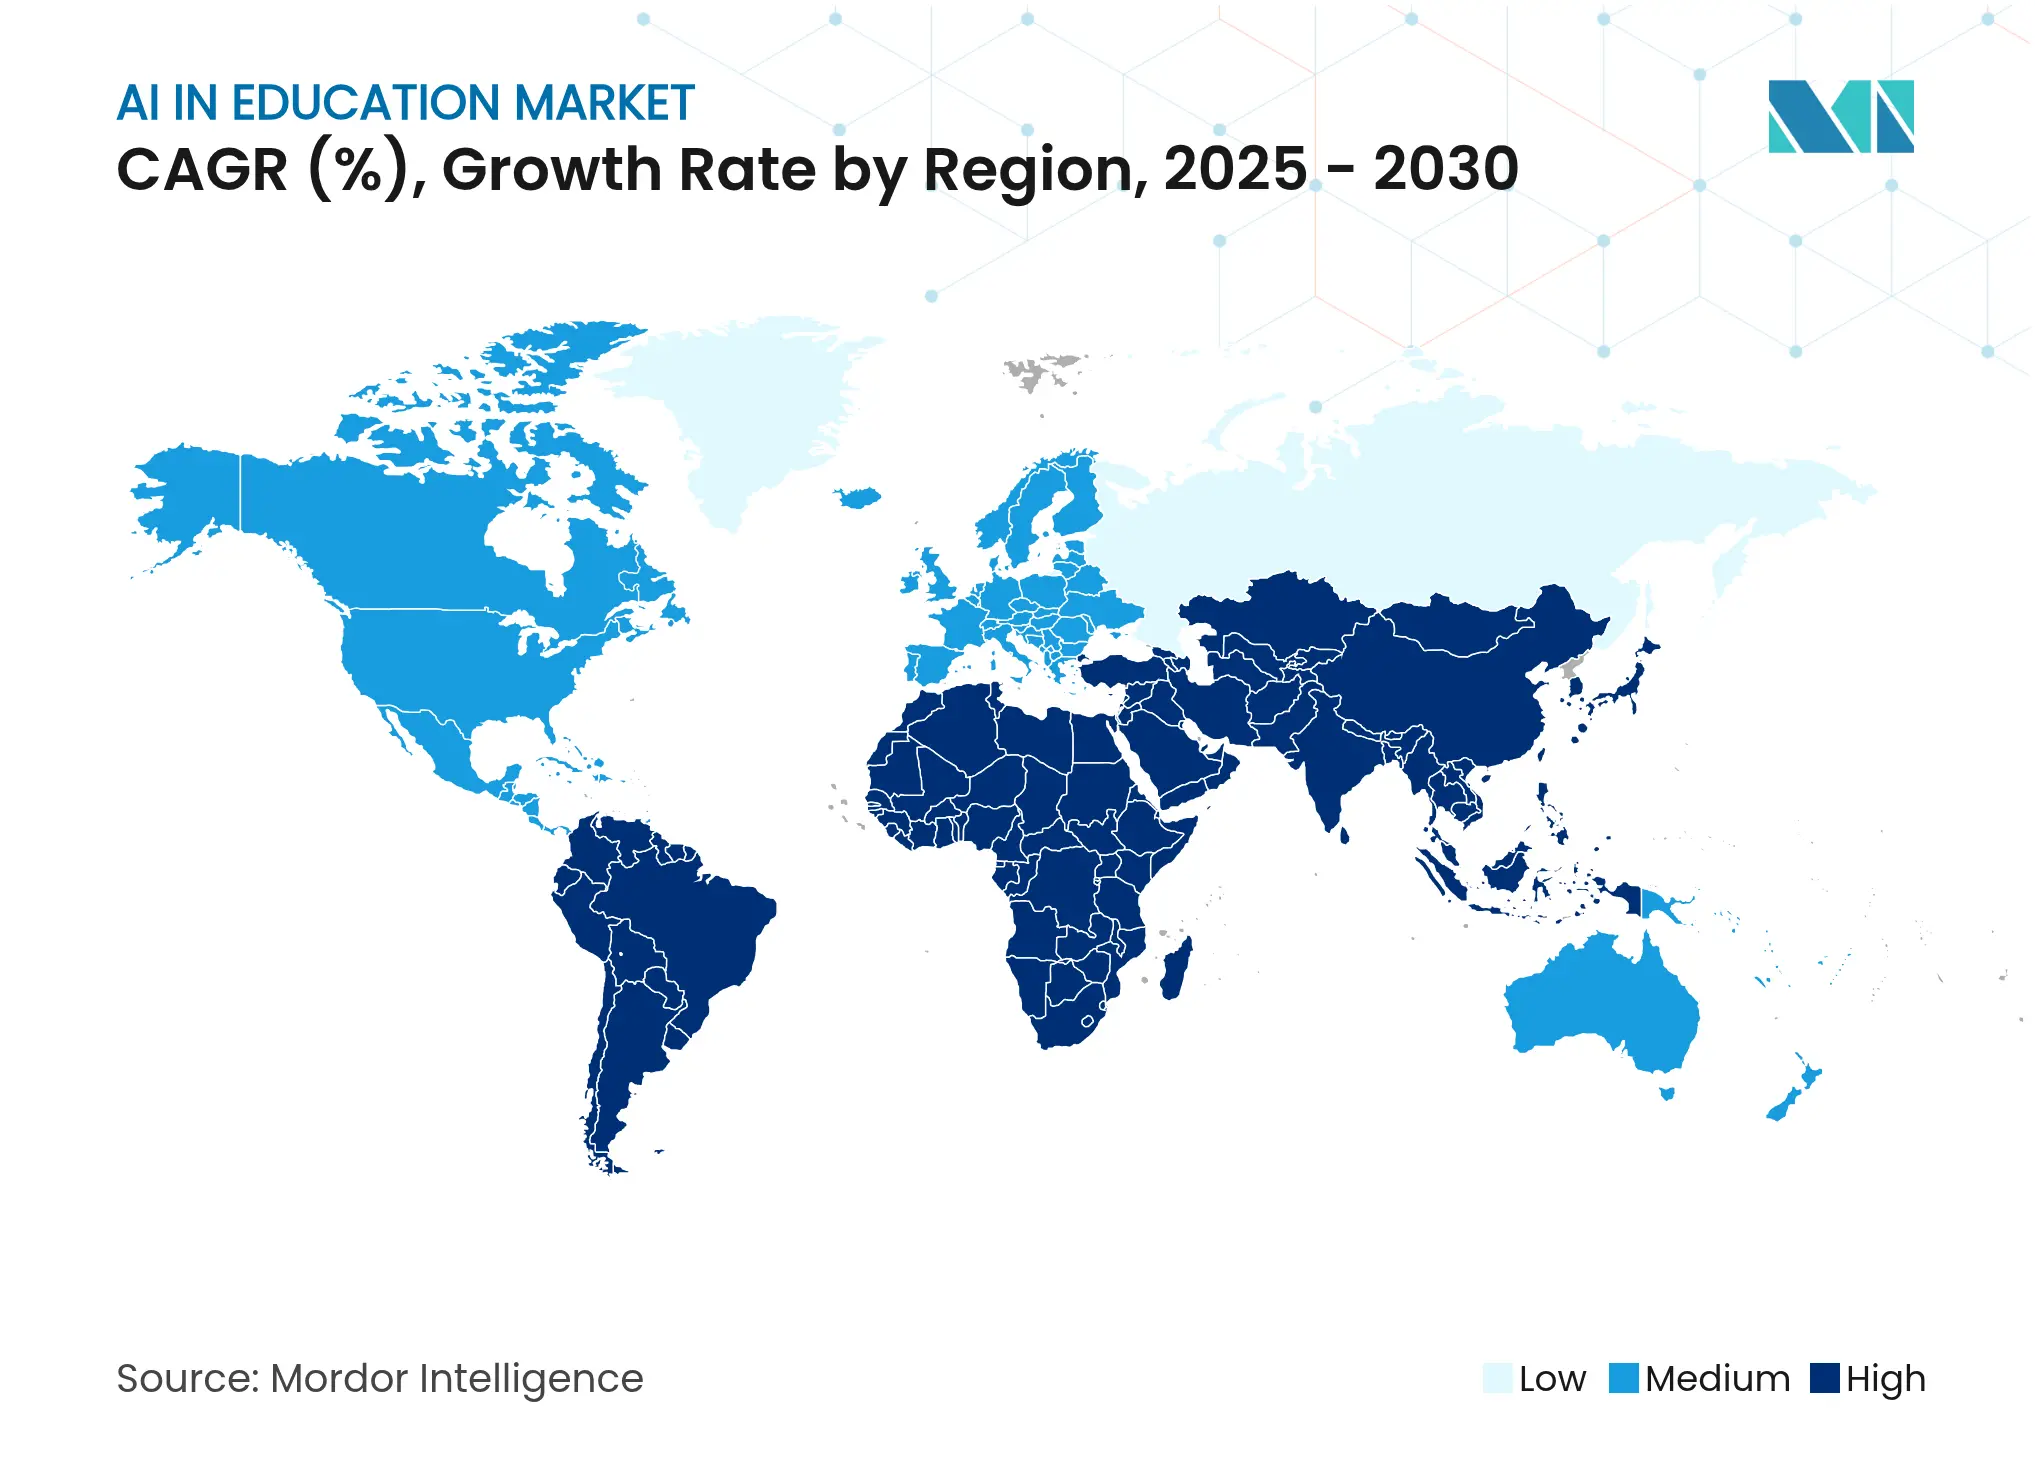
| Fastest Growing Market | Asia Pacific |
| Largest Market | North America |
| Market Concentration | Medium |
Major Players *Disclaimer: Major Players sorted in no particular order. Image © Mordor Intelligence. Reuse requires attribution under CC BY 4.0. |
Demand is propelled by mandatory digital-literacy policies, rapid cloud adoption, and measurable gains in student success that move artificial intelligence from pilot projects to core infrastructure. Institutions now view AI as the fastest route to personalized learning, reduced administrative overhead, and wider access for underserved learners. Vendors that combine content, data, and analytics inside unified platforms are outpacing point-solution rivals because buyers prefer single-stack ecosystems. Sustainability and data-privacy requirements are emerging as design constraints, steering investment toward privacy-preserving architectures and energy-efficient models.
Key Report Takeaways
Driver Impact Analyis
| Driver | ( ~ )% Impact on CAGR Forecast | Geographic Relevance | Impact Timeline | |||
|---|---|---|---|---|---|---|
Surge in demand for personalized learning ecosystems
Surge in demand for personalized learning ecosystems
| +8.5% | Global, early adoption in North America and Asia-Pacific | Medium term (2–4 years) |
( ~ )% Impact on CAGR Forecast
:
+8.5%
|
Geographic Relevance
:
Global, early adoption in North America and Asia-Pacific
|
Impact Timeline
:
Medium term (2–4 years)
|
Rapid adoption of cloud-native AI EdTech platforms
Rapid adoption of cloud-native AI EdTech platforms
| +7.2% | Global, led by North America and Europe | Short term (≤ 2 years) | |||
Government funding and policy mandates for EdTech
Government funding and policy mandates for EdTech
| +6.8% | Asia-Pacific core, spill-over to MEA and Europe | Long term (≥ 4 years) | |||
Multilingual AI voice assistants expanding cross-border
enrolments
Multilingual AI voice assistants expanding cross-border
enrolments
| +4.3% | Global, emerging markets focus | Medium term (2–4 years) | |||
Synthetic data accelerating AI model training and
localization
Synthetic data accelerating AI model training and
localization
| +3.7% | North America and EU, expanding to Asia-Pacific | Medium term (2–4 years) | |||
AI-driven micro-credentialing for workforce up-skilling
AI-driven micro-credentialing for workforce up-skilling
| +5.1% | Global, corporate focus in North America and Europe | Short term (≤ 2 years) | |||
| Source: Mordor Intelligence | ||||||
Surge in demand for personalized learning ecosystems
Adaptive platforms improve student outcomes by 28% and show 88% satisfaction with MagicSchool’s service [1]MagicSchool Press Team, “Impact Report 2024,” magicschool.ai. Effective algorithms adjust pace and difficulty within milliseconds, replacing semester-length feedback loops. Solutions such as ASSISTments report 75% gains among marginalized learners, proving that personalization narrows achievement gaps. Institutions now embed predictive analytics to flag at-risk students before grades decline, cementing AI as core to retention strategies across the AI in education market.
Rapid adoption of cloud-native AI EdTech platforms
Azure AI posts 31% annual growth, aided by GitHub Copilot deployments in universities[2]Microsoft Investor Relations, “FY25 Q2 Earnings Release,” microsoft.com. Google Cloud revenue climbed to USD 11.4 billion on strong uptake of AI infrastructure by education customer. Cloud removes capital hurdles, lets schools spin up NLP grading, computer-vision proctoring, and analytics dashboards on demand, and scales elastically through exam seasons.
Government funding and policy mandates for EdTech
China mandates eight hours of AI coursework yearly for primary learners within a USD 3.3 billion national strategy, reinforcing long-term growth in the AI in education market. The UAE requires AI from kindergarten, backed by centralized teacher-training programs. Germany’s DigitalPakt Schule allocates USD 6 billion to digitization, while Estonia’s AI Leap gives 20,000 students access to AI apps from September 2025. These long-horizon budgets anchor predictable revenue for platform vendors.
AI-driven micro-credentialing for workforce up-skilling
Accenture bought Udacity for USD 1 billion to build LearnVantage, underscoring enterprise hunger for bite-sized AI credentials. Corporations choose systems that map skill gaps, prescribe content, and certify mastery in weeks, not semesters, positioning corporate training as the next engine of AI in education market growth.
Restraint Impact Analysis
| Restraint | ( ~ )% Impact on CAGR Forecast | Geographic Relevance | Impact Timeline | |||
|---|---|---|---|---|---|---|
Data-privacy and compliance complexities
Data-privacy and compliance complexities
| −4.2% | Global, stricter in EU and North America | Short term (≤ 2 years) |
( ~ )% Impact on CAGR Forecast
:
−4.2%
|
Geographic Relevance
:
Global, stricter in EU and North America
|
Impact Timeline
:
Short term (≤ 2 years)
|
Digital and pedagogical skill-gaps among educators
Digital and pedagogical skill-gaps among educators
| −3.8% | Global, pronounced in emerging markets | Medium term (2–4 years) | |||
Algorithmic bias triggering regulatory push-back
Algorithmic bias triggering regulatory push-back
| −2.9% | Global, focus on North America and EU | Medium term (2–4 years) | |||
Sustainability concerns over AI compute energy use
Sustainability concerns over AI compute energy use
| −2.1% | Global, regulatory pressure in EU | Long term (≥ 4 years) | |||
| Source: Mordor Intelligence | ||||||
Data-privacy and compliance complexities
The EU AI Act tags education as high-risk, imposing audit trails and human oversight that many vendors still lack. Overlapping GDPR, FERPA, and COPPA rules elevate legal cost and elongate procurement cycles. Half of institutions rank data security as their chief concern, per Lenovo’s 2024 global educator survey. Consent management for minors and cross-border data transfers remain unresolved friction points.
Digital and pedagogical skill-gaps among educators
71% of K-12 teachers report no formal AI training even as 83% already use generative tools, according to the National Education Association [3]National Education Association, “Generative AI in K-12 Survey 2024,” nea.org. Only 16 US states have issued classroom guidance, leaving practitioners to self-navigate ethical and instructional pitfalls. Microsoft has trained 14 million learners worldwide, yet scale still trails demand, especially in emerging markets where basic connectivity challenges compound training needs across the AI in education market.
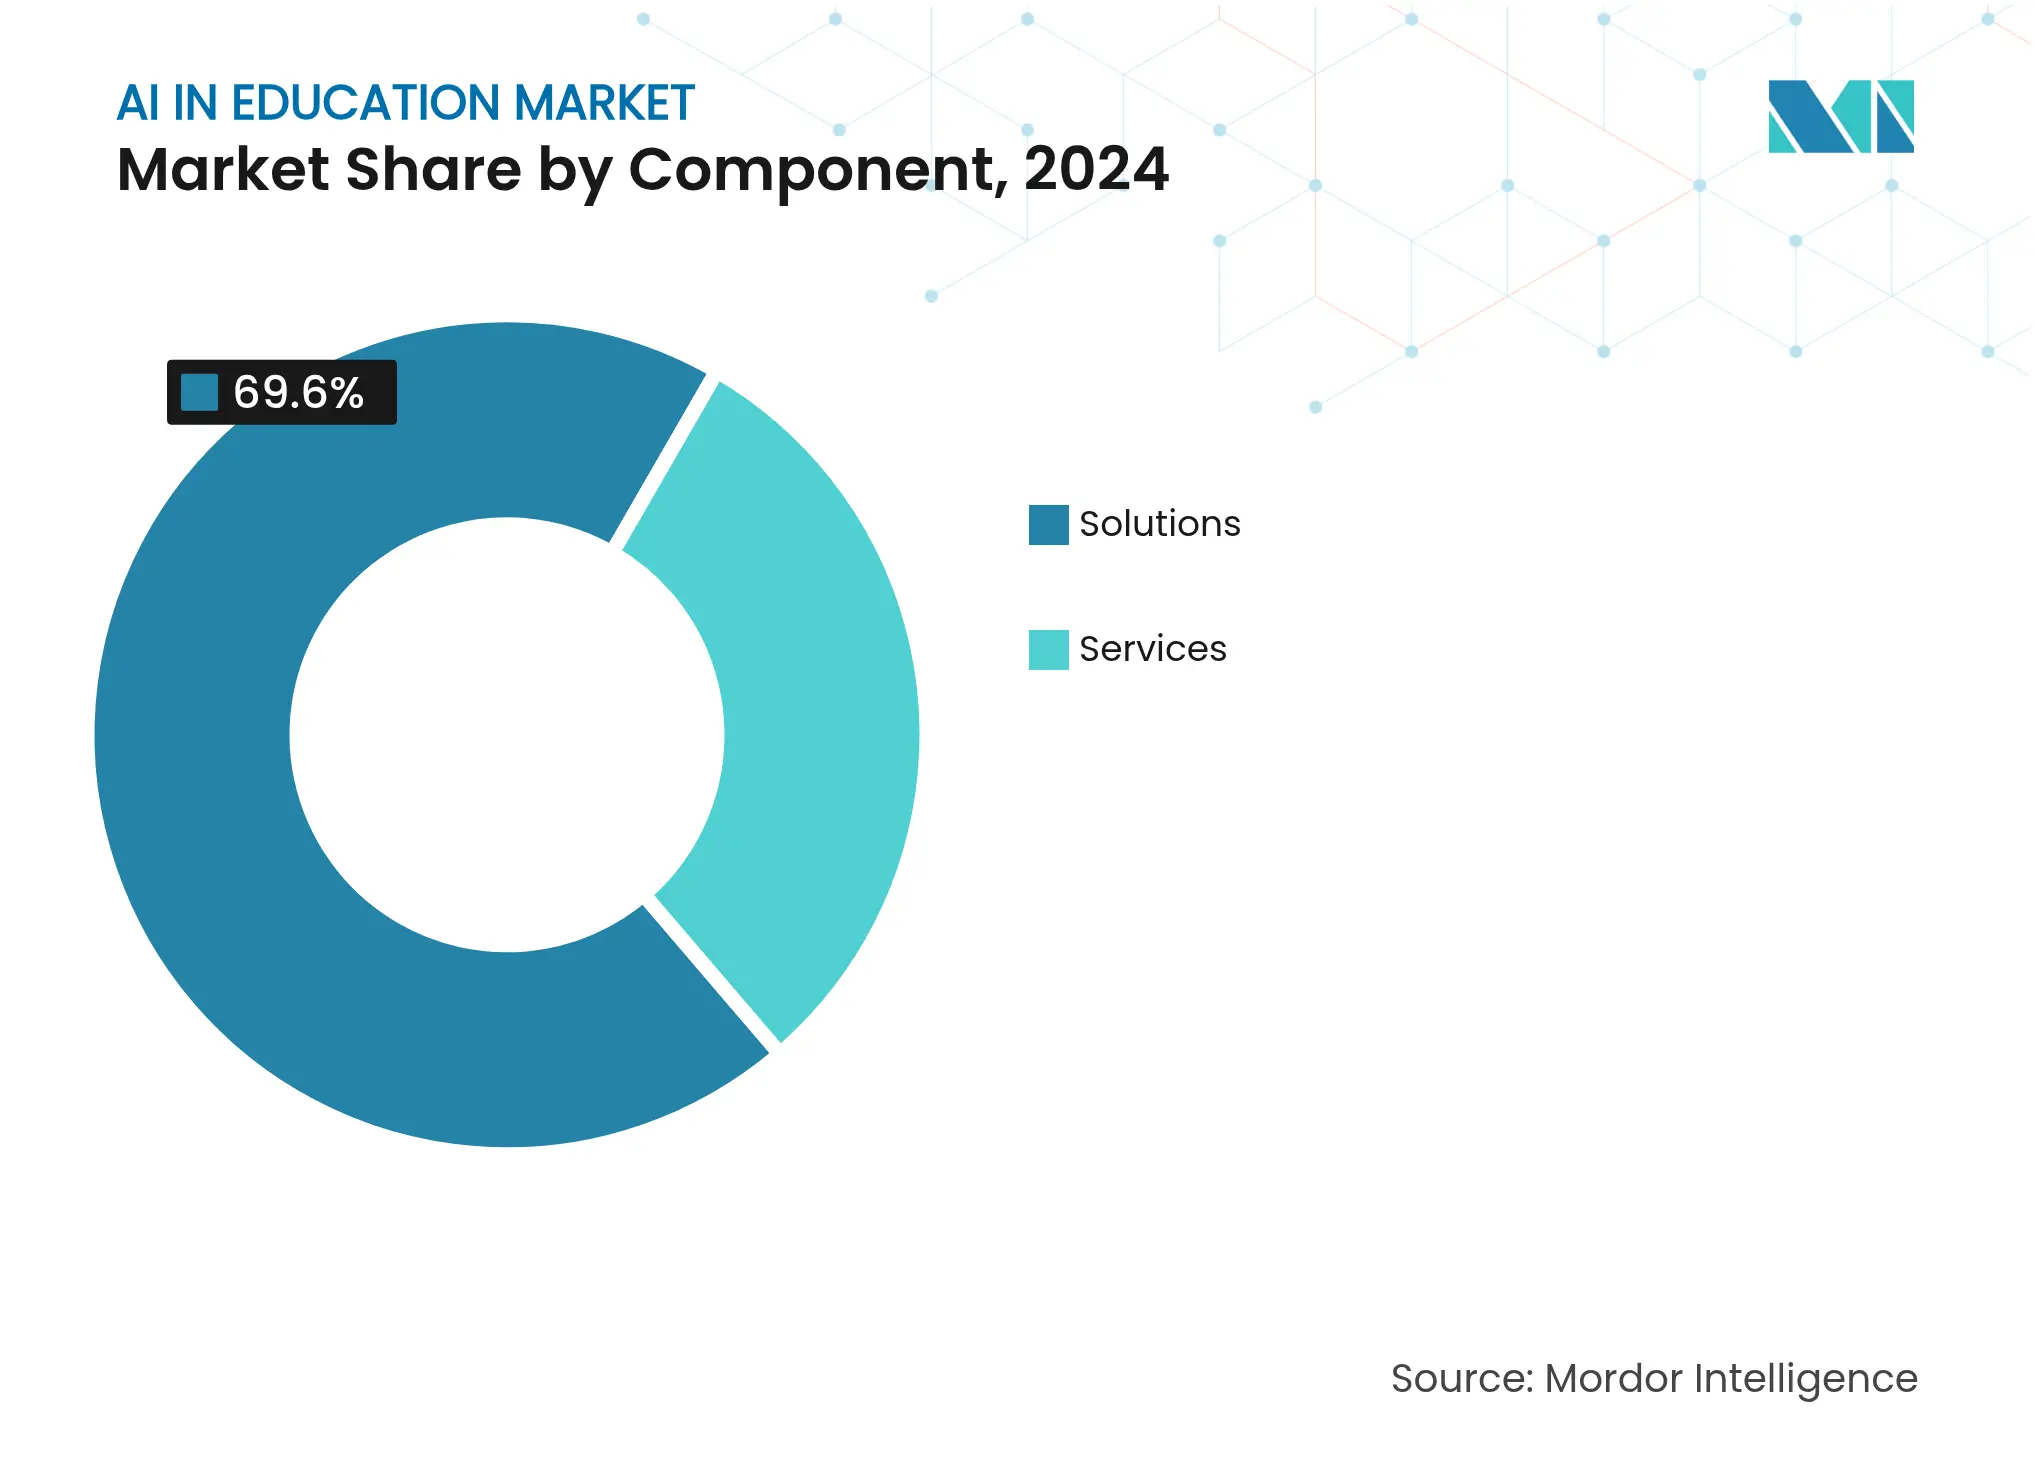
By Component: Integrated Platforms Dominate Adoption
Solutions captured 69.60% of 2024 revenue, underscoring buyers’ preference for single-vendor stacks that blend tutoring, grading, and analytics into one interface. The AI in education market size for Solutions stood at USD 4.79 billion in 2024, while Services covered the remaining demand through integration, training, and support engagements. Microsoft 365 Copilot is in use at 70% of Fortune 500 organizations for learning applications, illustrating how platform breadth sways procurement decisions.
Services expand at a 38.20% CAGR to 2030 as schools seek migration road-maps, data-lake architecture, and change-management services that internal departments cannot deliver. Consulting firms translate pedagogical needs into AI feature sets and orchestrate pilot-to-scale rollouts. This advisory premium reinforces that professional expertise remains essential even where out-of-the-box platforms lead the AI in education market.
Note: Segment shares of all individual segments available upon report purchase
By Deployment Mode: Cloud Infrastructure Underpins Scale
Cloud deployments account for 59.30% revenue today and are rising at 41.30% CAGR. This dominance anchors elastic compute for NLP graders and computer-vision invigilators without on-premise hardware lock-in. Institutions prefer operational expense models after pandemic budgets tightened, and cloud vendors respond with education-specific AI bundles. Alphabet notes that one-third of its latest USD 11.4 billion cloud sales involve learning workloads.
On-premise still serves districts with strict data-sovereignty rules, while hybrid architectures balance latency and security. Flexible models advance resilience, reassuring boards that sensitive student data can remain local even as AI scale explodes. Cloud momentum, therefore, cements vendor ecosystems and accelerates the AI in education market’s mainstream status.
By End-User: Corporate Training Surges
Higher Education maintained 45.00% revenue share in 2024 as universities automate advising, research support, and grading. Yet Corporate Training registers a blistering 44.80% CAGR through 2030, the fastest inside the AI in education industry. Employers confront talent shortages in data science and prompt engineering, so they finance micro-learning suites that issue stackable certificates within weeks. Accenture’s LearnVantage strategy exemplifies the pivot, marrying content and assessment into continuous learning flows that both hires and incumbent employees complete on demand.
K-12 Schools adopt AI chiefly for administrative workflows and differentiated learning. Government agencies and professional bodies round out other end-users, validating that applications now extend beyond classroom walls. This broadening base underpins resilience against cyclical education budgets and widens the addressable AI in education market.

Recognized by Experts. Trusted by Leaders.
A trusted intelligence partner to global decision-makers across 90+ countries.


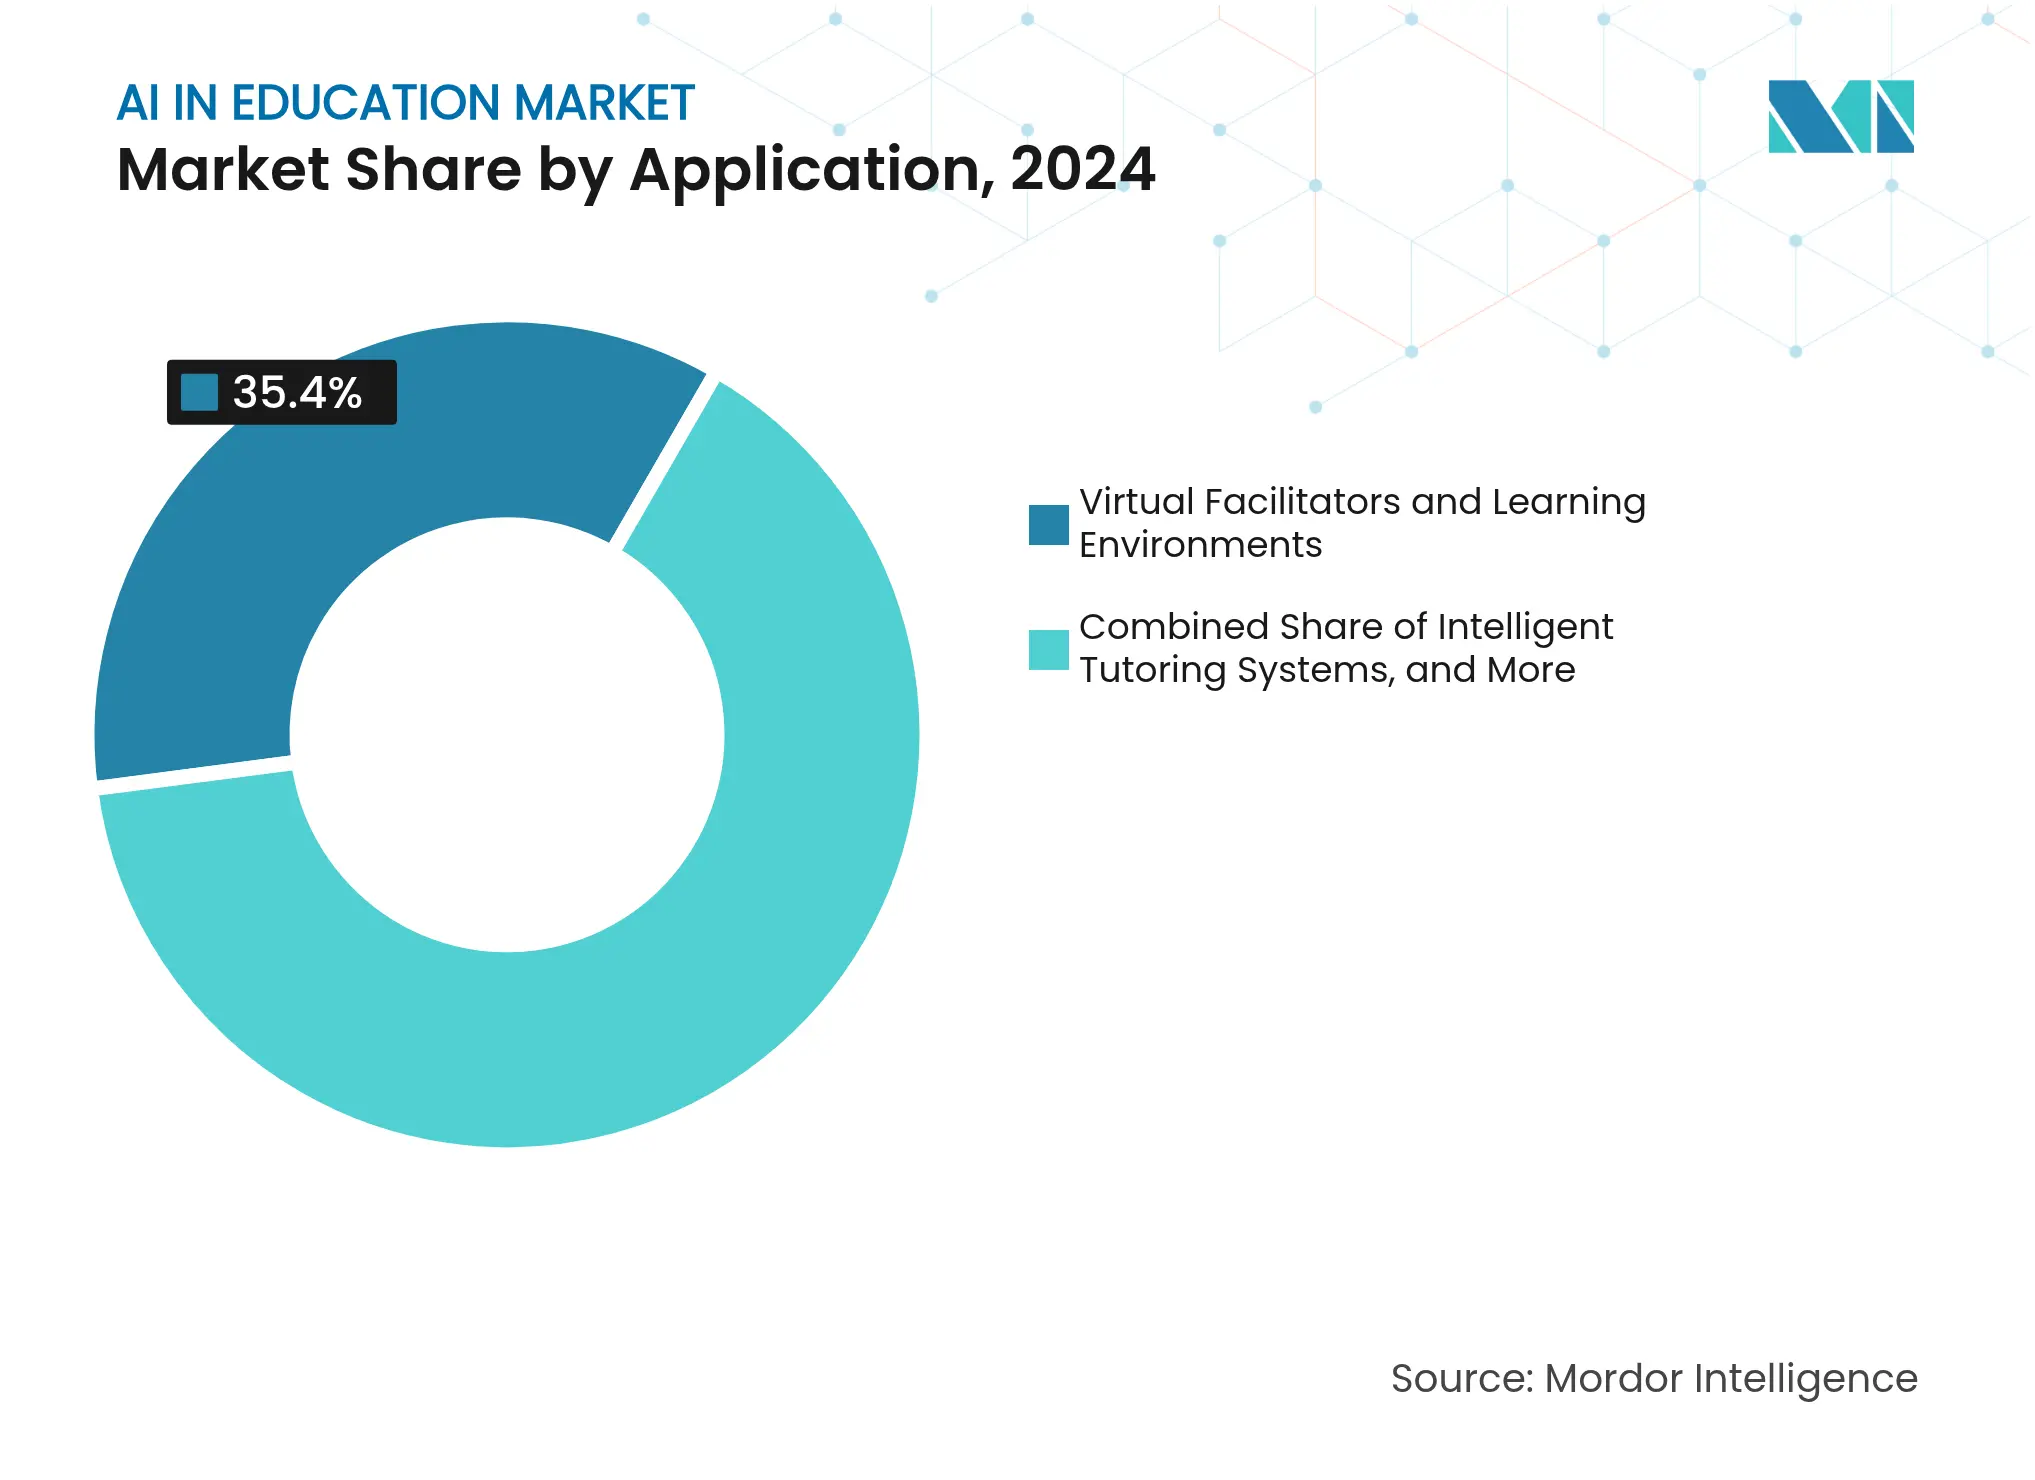
By Application: Assessment Innovation Gains Speed
Virtual Facilitators and Learning Environments held the largest 2024 slice at 35.40%, reflecting early interest in AI tutors and immersive simulations. The AI in education market share for Adaptive Assessment and Grading, however, is accelerating, with a 46.70% CAGR forecast. AI graders cut essay review from 10 minutes to 30 seconds while offering rubric-aligned feedback, freeing instructors to focus on mentoring.
Continuous assessment now eclipses periodic testing. More than 67% of universities rely on automated systems, enabling real-time performance dashboards that surface misconceptions before they calcify. This shift positions assessment engines as both learning companions and accountability frameworks, solidifying their pivotal role in the AI in education market.
Note: Segment shares of all individual segments available upon report purchase
By Technology: Generative AI Opens New Frontiers
Machine Learning underpins 62.90% of current solutions, but Deep Learning and Generative AI are expanding at 48.30% CAGR, the highest by technology segment. Large-language-model tutors such as ChatGPT’s Advanced Voice Mode offer emotionally aware, multilingual dialogue that adapts on the fly. Educators deploy generative tools to draft lesson plans, quizzes, and differentiated content in seconds, reclaiming prep time.
Edge AI rises in tandem, processing data locally to satisfy privacy rules while maintaining low latency. Speech recognition, computer vision, and NLP converge into multimodal experiences, merging spoken, visual, and written cues across devices. These innovations advance inclusivity and reinforce AI’s ubiquity within every learning touchpoint.
North America holds 38.80% of 2024 revenue in the AI in education market, boosted by deep venture-capital pools, dense cloud datacenters, and a culture of early technology adoption. Microsoft and Khan Academy now provide free AI tutoring for US educators, supporting rapid penetration despite uneven state guidance. Canada’s federal grants for AI research fuel a pipeline of spin-out EdTech ventures, and both nations benefit from mature broadband infrastructure that supports high-bandwidth AI applications.
Asia-Pacific leads growth at 44.20% CAGR as governments embed AI into compulsory curricula. China’s eight-hour requirement for first-graders anchors durable demand, while Japan integrates AI across core subjects under its new teaching guidelines. India leverages Microsoft’s global skilling program, having trained 14 million residents, to bridge capability gaps. A composite of public-private projects propels the AI in education market size in Asia-Pacific toward leadership by 2030.
Europe advances along a privacy-first trajectory. The EU AI Act designates education as high-risk, so vendors must build auditable systems that align with GDPR. Germany’s USD 6 billion DigitalPakt Schule and Estonia’s AI Leap initiative illustrate targeted investment. Erasmus+ projects such as Generation AI nurture teacher readiness. This managed approach delivers steady but policy-guarded expansion that differentiates the region in the global AI in education market.
Market Concentration
Competition is moderate and tilts toward vendors with ecosystem depth in the AI in education market. No single firm holds overriding power, but Microsoft’s 2025 Pearson partnership and USD 13 billion AI run rate underline the clout of hyperscalers that control compute, models, and distribution simultaneously. Google and Amazon play similar roles, pairing infrastructure with developer kits that accelerate third-party courseware.
EdTech specialists such as DreamBox Learning and Carnegie Learning defend their share by embedding domain-specific pedagogy. AI-native disruptors like MagicSchool report 28% outcome improvement and 88% satisfaction, proving that nimble innovation can outshine sheer scale. Consolidation looms as smaller firms seek capital to match GPU costs and regulatory compliance overhead. Vendors that offer tight integration, privacy safeguards, and measurable impact will shape future share moves in the AI in education market.

*Disclaimer: Major Players sorted in no particular order
1. INTRODUCTION
2. RESEARCH METHODOLOGY
3. EXECUTIVE SUMMARY
4. MARKET LANDSCAPE
5. MARKET SIZE AND GROWTH FORECASTS (VALUE)
6. COMPETITIVE LANDSCAPE
7. MARKET OPPORTUNITIES AND FUTURE TRENDS
Market Definitions and Key Coverage
Segmentation Overview
Detailed Research Methodology and Data Validation
Primary Research
Desk Research
Market-Sizing & Forecasting
Data Validation & Update Cycle
Why Mordor's AI in Education Baseline Inspires Stakeholder Confidence
Benchmark comparison
| Market Size | Anonymized source | Primary gap driver | ||
|---|---|---|---|---|
USD 6.90 B (2025) | Mordor Intelligence | - | Anonymized source:Mordor Intelligence | Primary gap driver:- |
USD 8.30 B (2025) | Global Consultancy A | Includes tutoring hardware and broad e-learning spend within AI total | ||
USD 2.21 B (2024) | Research Publisher B | Counts only software licenses, excludes cloud service fees and Asia data | ||
USD 7.52 B (2025) | Industry Analyst C | One-off survey; model not refreshed since publication |
Pricing Strategy for Semiconductor Components
3 Min Read
Accelerating Additive Manufacturing Adoption in India
3 Min Read
Unlocking Saudi Arabia’s Regional Tourism Growth Potential
5 Min Read
When decisions matter, industry leaders turn to our analysts. Let’s talk.