Africa Maize Market Analysis by Mordor Intelligence
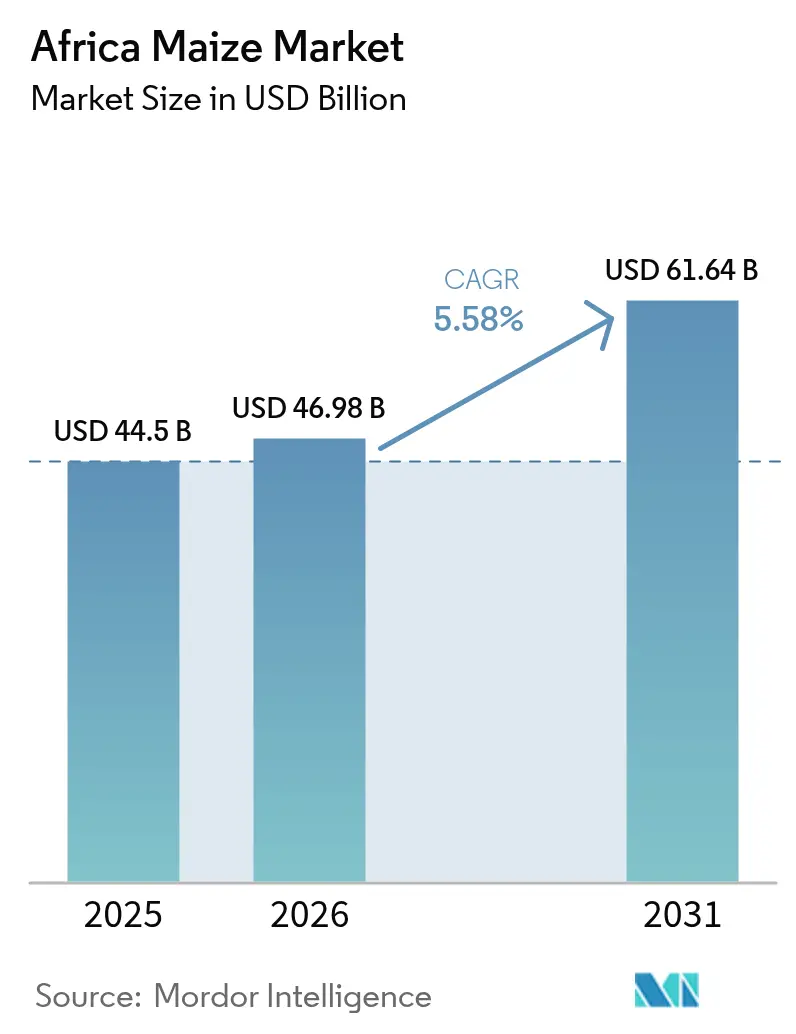
The Africa maize market size was valued at USD 44.5 billion in 2025 and estimated to grow from USD 46.98 billion in 2026 to reach USD 61.64 billion by 2031, at a CAGR of 5.58% during the forecast period (2026-2031). The upward trajectory reflects population-driven demand for fortified staples, rapidly scaling animal-feed capacity, and the commercial pivot toward starch-based biomaterials in South and East Africa. Nigeria, South Africa, and Ethiopia anchor current spending, yet the fastest incremental growth is concentrated in Ethiopia, Tanzania, and Uganda where irrigation, digital extension, and concessional finance are closing yield gaps. Structural yield constraints, fragmented storage, and pest incursions still temper expansion, but widespread subsidy and e-voucher programs partially offset cost pressures for smallholders. Forward integration by trading houses and millers, coupled with blockchain traceability pilots, is compressing farm-gate-to-consumer lead times and unlocking premium channels that reward aflatoxin-compliant grain.
Key Report Takeaways
- By geography, Nigeria has the largest market share, accounting for around 22.4% of the Africa maize market in 2025. South Africa is the fastest-growing market at 18.9% CAGR, between 2026-2031.
Note: Market size and forecast figures in this report are generated using Mordor Intelligence’s proprietary estimation framework, updated with the latest available data and insights as of 2026.
Africa Maize Market Trends and Insights
Drivers Impact Analysis*
| Driver | (~) % Impact on CAGR Forecast | Geographic Relevance | Impact Timeline |
|---|---|---|---|
| Population-driven food-grain demand surge | +0.8% | West Africa (Nigeria, Ghana, Côte d'Ivoire), East Africa (Ethiopia, Kenya, Tanzania) | Medium term (2-4 years) |
| Expansion of compound animal feed mills | +0.7% | Nigeria, South Africa, Kenya, Ghana, and Uganda | Medium term (2-4 years) |
| National subsidy and e-voucher programs | +0.5% | Ghana, Zambia, Mali, Niger, Kenya, and Rwanda | Short term (≤ 2 years) |
| Rise of starch-based biomaterials and bioplastics | +0.4% | South Africa, Ethiopia, Kenya, and Egypt | Long term (≥ 4 years) |
| Adoption of digital agronomy for yield gains | +0.3% | Kenya, Tanzania, Nigeria, Ghana, and Côte d'Ivoire | Medium term (2-4 years) |
| Soil-carbon credit revenue streams | +0.1% | Kenya, Tanzania, Zambia, Malawi, and South Africa | Long term (≥ 4 years) |
| Source: Mordor Intelligence | |||
Population-Driven Food-Grain Demand Surge
Between 2020 and 2025, Africa's urban population grew significantly. This growth led to an increase in maize meal consumption in countries like Nigeria and Ethiopia[1]Source: United Nations Population Division, “World Population Prospects 2024,” un.org . In Sub-Saharan Africa, maize serves as a vital staple food, with demand projected to rise by over 300% by 2050. Urban centers, with their concentrated purchasing power, are leaning towards factory-milled, vitamin-fortified flour. This trend is boosting profit margins for processors who prioritize shelf stability. To stabilize retail prices and mitigate civil unrest, Nigeria implemented a price ceiling, a measure that held firm through December 2025. Ethiopian cities saw a rise in maize consumption after the government redirected wheat subsidies to bolster local cereals. With projections indicating Africa's urban populace will continue to grow, the continent's maize consumption value market is poised to thrive.
Expansion of Compound Animal Feed Mills
Nigeria expanded its poultry population, while aquaculture growth in Ghana increased the demand for yellow maize. Integrators adjusted maize inclusion in broiler feed formulations to address foreign exchange fluctuations. South Africa leads the market with major producers such as Meadow Feeds, Epol (RCL Foods), and AFGRI, collectively producing approximately 11 million metric tons of compound feed annually. South African feed mills favored yellow maize over white maize due to its higher energy density. According to the National Agriculture Production Report 2025 by the Kenya National Bureau of Statistics (KNBS), maize cultivation in Kenya spanned 2.41 million hectares, yielding 4.03 million metric tons. In Kenya, dairy cooperatives improved yields by combining maize silage with Napier grass. In Uganda, fish farms incorporated maize into their feed, reflecting the link between Africa's maize consumption and the growing demand for protein. Additionally, De Heus has made notable investments in East and West Africa, including a 240,000-metric-ton plant in Kenya set for completion in 2026 and a new aqua feed factory in Uganda.
National Subsidy and E-Voucher Programs
Zambia supported smallholder farmers with fertilizer and seeds, enabling a substantial harvest despite challenging weather conditions. In Mali, a World Bank-backed platform improved efficiency by reducing input leakage and procurement time. Kenya's blockchain pilot connected farmers to suppliers, eliminating excessive markups. According to the Ministry of Agriculture and Livestock Development (MoALD), about 3.5 million 50-kilogram (kg) bags of subsidized fertilizer had been distributed in 41 of the country’s 47 counties from the inception of the Kenyan National Fertilizer Subsidy Program (NFSP) through July 30, 2023. Malawi has implemented a national fertilizer subsidy program to promote the use of inorganic fertilizers, increase domestic maize production, and enhance food security and self-sufficiency among smallholder farmers. The Kenya Cereal Enhancement Programme-Climate Resilient Agricultural Livelihoods (KCEP-CRAL) program employs a mobile-based e-voucher system to support more than 68,000 smallholder farmers in obtaining subsidized, high-quality agricultural inputs such as fertilizers and seeds. These subsidies strengthen Africa's maize consumption market during periods of cost increases.
Rise of Starch-Based Biomaterials and Bioplastics
South African converters sourced maize starch to produce compostable films compliant with European regulations. Studies conducted in countries such as Ethiopia, Ghana, and Uganda demonstrate the potential for producing bioplastics from corn and cassava. Bioplastics contribute to addressing plastic pollution, particularly in countries with inadequate waste management systems like Rwanda and South Africa, while also providing value-added opportunities for local farmers. Research indicates that local production can be economically viable, with reported payback periods as short as 1.33 years. Kenya’s Bio-Packaging Alliance prepaid for non-Genetically Modified Organism (GMO) starch at a premium price. Nigeria’s draft guidelines for compostable food-contact materials are anticipated to increase starch demand further, specifically for the production of biodegradable plastic films derived from cassava. This segment is driving significant growth in Africa's maize consumption value market.
Restraints Impact Analysis*
| Restraint | (~) % Impact on CAGR Forecast | Geographic Relevance | Impact Timeline |
|---|---|---|---|
| Fall Armyworm and emerging pest pressures | -0.5% | West Africa (Nigeria, Ghana, Benin), East Africa (Kenya, Tanzania, Uganda), Southern Africa (Zambia, Malawi) | Short term (≤ 2 years) |
| High post-harvest losses in storage and logistics | -0.4% | Nigeria, Tanzania, Mozambique, Madagascar, Democratic Republic of Congo | Medium term (2-4 years) |
| Soil nutrient depletion and micronutrient gaps | -0.2% | Ethiopia, Kenya, Tanzania, Uganda, Malawi, Zimbabwe | Long term (≥ 4 years) |
| Fertilizer price volatility for smallholders | -0.1% | Global, with acute impact in Nigeria, Kenya, Ethiopia, Ghana, Côte d'Ivoire | Short term (≤ 2 years) |
| Source: Mordor Intelligence | |||
Fall Armyworm and Emerging Pest Pressures
The fall armyworm(FAW) is a significant pest affecting Africa's farming systems. Yield losses in maize have been reported to have reached up to 58% due to its impact, worth annual economic losses of USD 9.4 billion[4]Source: Food and Agriculture Organization, “Fall Armyworm Impact Brief 2025,” fao.org. Infestations severely impacted maize production, forcing farmers to rely heavily on insecticides in the previous few years. However, most chemical pesticides are highly toxic to the environment, and the FAW insect has the ability to develop resistance to many available pesticides, thereby reducing their effectiveness. According to a study conducted in December 2025 on the impact of fall armyworm (FAW) infestation on nutrition security outcomes in eastern Uganda, low FAW intensity led to a reduction in maize sales by 122 kg, while high FAW intensity caused a decrease of 265 kg. Nigeria introduced bio-fortified hybrids with partial resistance, but adoption remained low due to slow seed multiplication. In Kenya, push-pull intercropping significantly reduced larval density, though scaling its impact requires broader extension efforts. Tanzania approved biopesticides as cost-effective alternatives to pyrethroids, which are increasingly facing resistance.
High Post-Harvest Losses in Storage and Logistics
Sub-Saharan Africa experienced significant maize losses due to inadequate storage methods. Post-harvest losses (PHL) for maize in Sub-Saharan Africa are substantial, estimated between 11.7% and over 30% of total production, significantly affecting food security. Approximately 66% of these losses occur during storage, primarily due to pests, rodents, moisture, and inadequate handling during threshing and transportation. Inadequate storage infrastructure an dineffecient logistics in Africa result in up to 25% of maize being lost post-harvest due to pests, mold, and moisture, posing risks to food security and farmers' incomes[2]Source: Agricultural Indicators,” World Bank, worldbank.org . In Nigeria, the adoption of hermetic bags reduced aflatoxin levels and extended shelf life. Tanzania improved loan accessibility through strategic warehousing initiatives. However, Madagascar's poor road infrastructure continues to hinder trade by increasing freight costs, limiting market access for remote growers.
*Our forecasts treat driver/restraint impacts as directional, not additive. The impact forecasts reflect baseline growth, mix effects, and variable interactions.
Geography Analysis
Nigeria dominates the African maize market with a 22.4% share in 2025 due to its large population and diversified processing base. However, growth is anticipated to moderate due to declining soil organic carbon in key zones. Poultry firms in Lagos and Ogun sourced yellow maize at a premium for aflatoxin-free feed. Subsidies reached many farmers but covered only a portion of the area, leaving others reliant on recycled seeds.
In Ethiopia, growth is supported by Hawassa Industrial Park’s starch plant, which offers premiums for white maize. Production increased due to the distribution of hybrid seeds and fertilizer by the Agricultural Transformation Agency. The Home-Grown School Feeding Programme also supported post-harvest prices. Meanwhile, Tanzania, Kenya, and Uganda collectively hold a notable share and are anticipated to grow steadily, driven by corridor projects and rising dairy feed demand.
South Africa is projected to grow at the fastest rate among major markets from 2026-2031 with the fastest growing 18.9% CAGR. It is experiencing slower growth due to saturated per-capita intake and limited land expansion. The feed sector processed substantial volumes, and fortified meals saw strong retail sales. Maize futures on the Johannesburg Securities Exchange influenced planting decisions for both commercial farmers and contracted smallholders. A drought in the western Free State reduced yields, driving up prices.
Regulatory Landscape
Regional maize trade regulation in Africa is shaped by overlapping frameworks from the African Continental Free Trade Area (AfCFTA) and sub-regional blocs. In March 2026, the AfCFTA Secretariat advanced sanitary and phytosanitary (SPS) coordination through its SPS Sub-Committee to address non-tariff measures under the Trade in Goods Protocol, strengthening the move toward more consistent cross-border requirements for agricultural commodities, including maize.
At the sub-regional level, compliance continues to hinge on grain-quality standards and border testing protocols. The East African Community formalized updated maize grain requirements via EAS 2:2025 (sampling and test methods for maize grain intended for human consumption). Cross-border shipments across partner states commonly require conformity on parameters such as moisture content and aflatoxin limits. Separately, Nigeria approved 2026 fiscal policy and tariff amendments (April 2026), showing how national trade measures can still affect maize-related products alongside broader regional harmonization efforts.
Value Chain Analysis
The Africa maize value chain starts with input supply (hybrid and open-pollinated seed, fertilizer, and crop protection), then moves into production that is dominated by smallholders with a smaller base of commercial farms in markets such as South Africa. Grain is handled by aggregators and cooperative bulking points before storage (on-farm, community, and commercial silos), trading, and warehousing. It then flows into processors, including millers of fortified maize meal and industrial users such as compound feed mills and starch processors. Export and inter-regional flows depend on corridor logistics and the ability to document quality and food safety compliance for mycotoxins and moisture.
Post-harvest handling and logistics remain the main friction points: storage losses and inconsistent drying raise aflatoxin risk. Congestion at grain terminals and limited bulk road and rail capacity can also slow movement of surpluses to deficit areas, particularly when South Africa supplies neighboring markets. Upstream, productivity constraints are being addressed through seed-system partnerships and advisory programs, including IITA and CIMMYT launching the Resilient Maize Hybrids for Africa initiative (2026-2028) to accelerate hybrid adoption in West and Central Africa. The advisory pipeline also expanded in March 2026, when IFC approved a USD 600,000 project to support Senegalese AgTech Tolbi in improving maize productivity using improved practices and digital tools.
Competitive Landscape
In 2025, the top suppliers dominated Africa's maize market revenue, highlighting a moderate fragmentation that favors regional specialists[3]Source: AFGRI, “Integrated Report 2025,” afgri.co.za. Olam Agri led the market, operating silos and mills in multiple countries to aggregate smallholder grain through digital procurement systems. Export Trading Group followed, sourcing significant volumes across numerous nations with a focus on mycotoxin-compliant exports. Bakhresa Group maintained its position through integrated milling and snack plants, while Seaboard Corporation leveraged multi-country flour and feed complexes to capture market share.
AFGRI's (AFGRI Agri Services Proprietary Limited) market presence is supported by its extensive cross-border storage and an in-house futures desk that hedges farmer deliveries well in advance. Major players are focusing on vertical integration, incorporating hermetic storage, pre-cooked flour lines, and blockchain traceability, which has significantly reduced documentation time. In Ethiopia and Tanzania, farmer-run cooperatives are pooling volumes to negotiate long-term supply contracts and reinvesting trading margins into mechanization. Exporters targeting buyers in the Middle East and Asia are adhering to international food safety standards and aflatoxin caps to maintain compliance.
Opportunities exist in fortified sachets and extruded snacks, which are priced higher than commodity meals. However, scaling these products requires substantial investment, and cold-chain distribution remains underdeveloped outside major cities. Traders optimizing harvest windows across biomes are moving surpluses from upcountry areas to coastal zones facing deficits, capturing significant price spreads. Logistics providers with advanced facilities, such as Louis Dreyfus Company's Mombasa operation, are reducing inland freight costs and securing preferred supplier status with Gulf feed mills.
Market Opportunities and Future Outlook
Opportunities cluster around seed-system upgrades, post-harvest infrastructure, and value-added processing that moves maize into higher-margin food, feed, and industrial outputs. Scaling climate-resilient hybrid seed and accelerating varietal turnover are key entry points: IITA and CIMMYT launched the Resilient Maize Hybrids for Africa program for 2026-2028 with a targeted step-up in hybrid adoption in West and Central Africa. In addition, CIMMYT announced eight new tropical maize hybrids for commercial dissemination in Eastern Africa following 2025 regional on-farm trials. These initiatives support growth in formal seed sales, localized multiplication, and bundled extension and input-finance models that reduce reliance on recycled seed.
A second opportunity centers on investment in storage, aggregation, and processing capacity to cut losses and meet tighter quality specifications for formal retail, feed integrators, and cross-border trade. In July 2026, SOMDIA announced a USD 173.8 million, five-year program in Cote d'Ivoire covering expansion into maize processing and structured value-chain development, indicating capital deployment beyond primary production. Storage capacity upgrades also point to continued demand for commercial warehousing, including MeTL-linked grain silo expansion at a Tanzanian facility (contracted July 2026). Together, these efforts support aflatoxin-compliant trade, smoother seasonal supply, and more reliable procurement by millers and feed mills.
Recent Industry Developments
- July 2026: SOMDIA announced a USD 173.8 million, five-year investment program in Cote d'Ivoire, extending beyond sugar into maize value-chain development and processing. The investment increases domestic value addition and supports structured offtake for farmers, while reducing dependence on imported intermediates for food and feed uses.
- May 2025: Ethiopia’s National Variety Release Committee approved genetically modified TELA maize for commercial planting. This approval marked a policy shift for biotechnology, enabling a broader pipeline of insect-resistant traits and affecting seed multiplication and regulatory pathways across neighboring markets.
- January 2024: The Federal Government of Nigeria approved the commercial release of genetically modified insect-resistant and drought-tolerant TELA maize varieties (SAMMAZ 72T, 73T, 74T, and 75T). The approval expanded the toolkit for managing fall armyworm and drought stress, with downstream effects on formal seed demand and grain supply consistency.


Research Methodology Framework and Report Scope
Market Definition and Coverage
For this methodology, the Africa maize market is measured as the value generated from maize produced and traded across African countries, with pricing linked to wholesale market behavior. The sizing reflects maize used for food, feed, and industrial demand, and it is expressed in USD terms.
Scope exclusions: This sizing does not count downstream processed products made from maize (such as refined starch derivatives or packaged foods) beyond the maize grain value captured at the wholesale level.
Segmentation Overview
- Geography
- Nigeria
- Production Analysis (Production Volume)
- Consumption Analysis (Consumption Value and Volume)
- Import Market Analysis (Import Value, Volume, and Key Supplying Markets)
- Export Market Analysis (Export Value, Volume, and Key Destination Markets)
- Wholesale Price Trend Analysis and Forecast
- Regulatory Framework
- List of Key Players
- Logistics and Infrastructure
- Seasonality Analysis
- South Africa
- Production Analysis (Production Volume)
- Consumption Analysis (Consumption Value and Volume)
- Import Market Analysis (Import Value, Volume, and Key Supplying Markets)
- Export Market Analysis (Export Value, Volume, and Key Destination Markets)
- Wholesale Price Trend Analysis and Forecast
- Regulatory Framework
- List of Key Players
- Logistics and Infrastructure
- Seasonality Analysis
- Ethiopia
- Production Analysis (Production Volume)
- Consumption Analysis (Consumption Value and Volume)
- Import Market Analysis (Import Value, Volume, and Key Supplying Markets)
- Export Market Analysis (Export Value, Volume, and Key Destination Markets)
- Wholesale Price Trend Analysis and Forecast
- Regulatory Framework
- List of Key Players
- Logistics and Infrastructure
- Seasonality Analysis
- Tanzania
- Production Analysis (Production Volume)
- Consumption Analysis (Consumption Value and Volume)
- Import Market Analysis (Import Value, Volume, and Key Supplying Markets)
- Export Market Analysis (Export Value, Volume, and Key Destination Markets)
- Wholesale Price Trend Analysis and Forecast
- Regulatory Framework
- List of Key Players
- Logistics and Infrastructure
- Seasonality Analysis
- Kenya
- Production Analysis (Production Volume)
- Consumption Analysis (Consumption Value and Volume)
- Import Market Analysis (Import Value, Volume, and Key Supplying Markets)
- Export Market Analysis (Export Value, Volume, and Key Destination Markets)
- Wholesale Price Trend Analysis and Forecast
- Regulatory Framework
- List of Key Players
- Logistics and Infrastructure
- Seasonality Analysis
- Uganda
- Production Analysis (Production Volume)
- Consumption Analysis (Consumption Value and Volume)
- Import Market Analysis (Import Value, Volume, and Key Supplying Markets)
- Export Market Analysis (Export Value, Volume, and Key Destination Markets)
- Wholesale Price Trend Analysis and Forecast
- Regulatory Framework
- List of Key Players
- Logistics and Infrastructure
- Seasonality Analysis
- Nigeria
Data Sources, Market Sizing, and Validation
Desk Research
Desk research was used to build the starting data spine for area, yield, production, trade, and price direction, before assumptions were tested in the field. We relied on public agriculture statistics and trade references such as FAOSTAT, USDA PSD, International Trade Centre trade maps, World Bank macro indicators, and national statistics offices and agriculture ministries across major producing countries.
To anchor the market in commercial signals, we also reviewed company annual reports and investor presentations where available, exchange and market bulletin updates, and reputable press coverage on crop conditions and policy changes. When needed, a paid subscription for company financials and a shipment-level import and export database were used to cross-check trade flows and participant positioning. These sources are illustrative only, and many other public references were also used to collect data, validate numbers, and clarify open questions.
Primary Interviews and Surveys
Primary work focused on interviews and structured surveys with growers and aggregators, grain traders, millers, feed buyers, and logistics and storage participants, since these groups see the practical link between volumes and realized pricing. We covered major maize corridors across APAC, EMEA, and the Americas trade interfaces into Africa, and then used these conversations to tighten assumptions on yields, post-harvest losses, cross-border movement, and wholesale price formation.
Distribution of primary research fieldwork respondents
| Company type | Respondent position | Region |
|---|---|---|
| Top tier: 28% | CXOs: 14% | APAC: 49% |
| Mid tier: 58% | Functional/Unit leaders: 28% | EMEA: 29% |
| Smaller Players: 14% | Managers: 58% | Americas: 22% |
Market-Sizing & Forecasting
The core model starts with a top-down reconstruction where harvested area and yield trends are translated into production volumes by country, then adjusted using import and export movements to reflect available supply and market flow. Those volumes are converted into USD value using wholesale price series, while tracking seasonality and the typical spread between surplus and deficit countries.
Selective bottom-up checks were then used to keep totals realistic, including trader and aggregator throughput discussions, channel checks on storage turnover, and sampled price points for major markets to validate the implied average price per ton. When gaps appeared, they were handled with transparent proxies such as neighboring-country yield behavior, weather event impact bands, and trade substitution logic for deficit years.
For forecasting, scenario analysis was used because maize outcomes in Africa are often shaped by rainfall variability, input cost swings, and policy signals on trade controls and strategic reserves. The forward path was shaped using variables such as planted area shifts, yield improvement pace, fertilizer affordability, post-harvest loss rates, and import dependency indicators, and then aligned to the consensus ranges shared by interviewed experts.
Data Validation & Update Cycle
Validation was done through repeated cross-checks between modeled value outputs and independent signals such as production balance sheets, trade totals, and observed wholesale price direction during key harvest windows. Where unusual jumps showed up, the assumptions were re-opened and, when needed, respondents were re-contacted to confirm whether the change was driven by weather shock, policy action, or reporting revisions.
Before sign-off, the model and narrative go through multi-step internal review so unit consistency, currency timing, and country roll-ups are aligned. Reports are refreshed annually, and interim updates are made when material events occur, such as major droughts, export bans, or sharp currency moves. Right before delivery, a fresh analyst pass is completed so clients receive an up-to-date view.
Mordor Intelligence's African Maize Market Size Compared With Other Published Estimates
Published market sizes for Africa maize rarely match perfectly because the market can be defined in more than one practical way, and because volume and pricing assumptions can be updated at different times. Differences also show up when studies mix country coverage, use farmgate versus wholesale pricing, or apply exchange rates from different periods.
The main gap comes from whether the estimate converts production into value using wholesale price trend series and trade adjustments, or whether it leans more on consumption value framing and simplified price progression. By separating production and trade volumes first and then applying a consistent wholesale pricing logic, Mordor Intelligence avoids overstating value in years where output is high but prices soften, or where imports shift quickly between deficit markets.
Benchmark comparison
| Source | Market Size | Gaps in Research Methodology |
|---|---|---|
| Mordor Intelligence | USD 46.98 B (2026) | |
| Market Data Publisher A | USD 41.40 B (2024) | Uses a different base year and appears to present a value figure without clearly separating wholesale price formation from volume movements across production and trade, which can shift the implied USD per ton. |
| Industry Research Portal B | USD 36.50 B (2024) | Leans on a segmented revenue view with a longer horizon and a different CAGR window, and the base-year value can vary if farmgate-style pricing or narrower country coverage is used versus wholesale market pricing. |
The spread across the three figures is mainly explained by timing and pricing logic, not by one simple arithmetic difference. When the scope is kept tied to measurable production, trade, and wholesale pricing series, and when assumptions are rechecked with market participants, the final number becomes easier to reconcile year to year.


Key Questions Answered in the Report
How large is the Maize Production in Africa market in 2026?
The market is valued at USD 46.98 billion in 2026 and is projected to reach USD 61.64 billion by 2031.
Which country holds the largest share of African maize production?
Nigeria leads with 22.4% of Africa maize market share in 2025.
Which is the fastest-growing country in the market?
South Africa is the fastest-growing country at 18.9% CAGR, through the forecast period.
How significant are post-harvest losses?
Storage and logistics inefficiencies waste 14-18 percent of harvested maize across Africa each year.
Page last updated on:


