
Market Overview
| Study Period | 2021 - 2031 |
|---|---|
| Forecast Data Period | 2026 - 2031 |
| Base Year Market Size (2025) | USD 82.72 Million |
| Market Size (2026) | USD 92.75 Million |
| Market Size (2031) | USD 164.47 Million |
| Growth Rate (2026 - 2031) | 12.13 % |
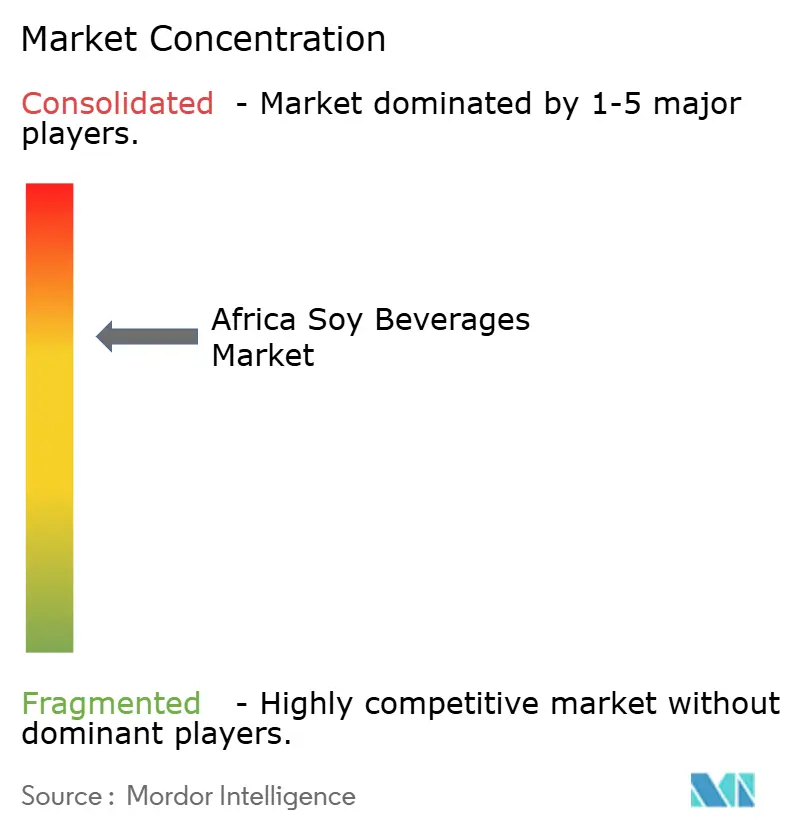
| Market Concentration | Medium |
Major Players
*Disclaimer: Major Players sorted in no particular order Image © Mordor Intelligence. Reuse requires attribution under CC BY 4.0. |
|
Africa Soy Beverages Market Analysis by Mordor Intelligence
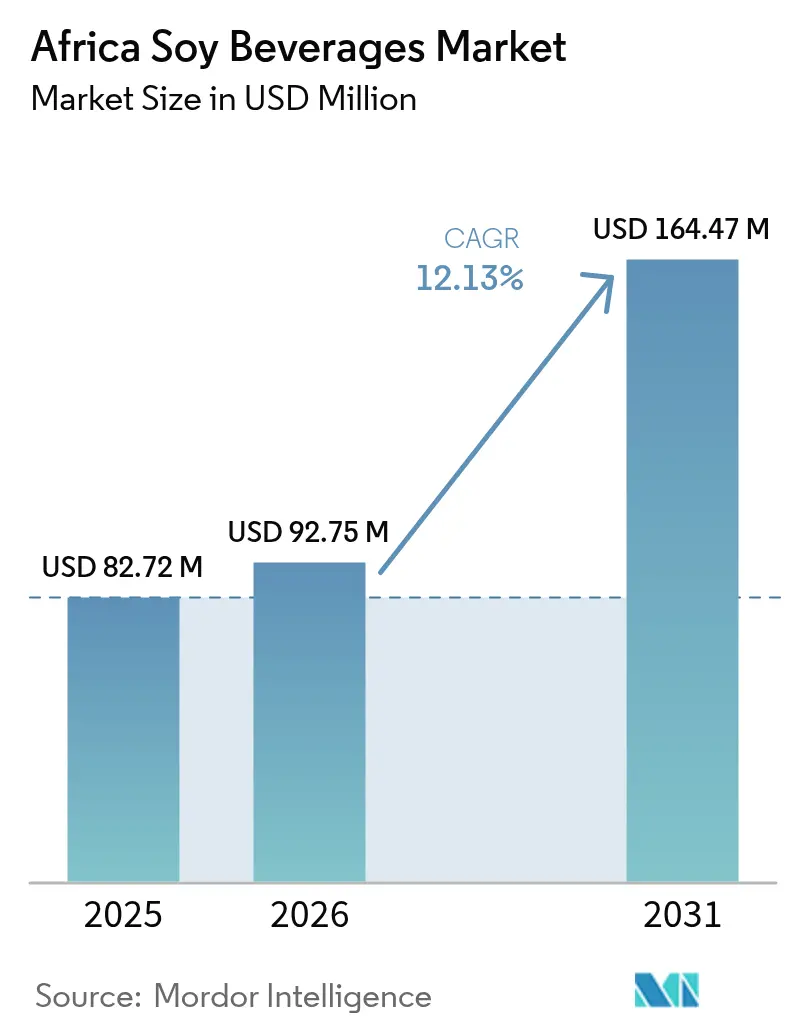
The Africa soy beverages market size is expected to grow from USD 82.72 million in 2025 to USD 92.75 million in 2026 and is forecast to reach USD 164.47 million by 2031 at 12.13% CAGR over 2026-2031. Rising lactose intolerance across majority of adult populations, rapid urbanization, supportive government agricultural policies, and continuous product innovation collectively underpin this pace of expansion within the Africa soy beverages market. Urban consumers increasingly view soy drinks as convenient sources of complete plant protein that also satisfy functional wellness expectations, especially in cities where disposable incomes and modern retail formats are growing. The Africa soy beverages market also gains resilience from domestic soybean cultivation programs that lower raw-material risk and enable localized production, boosting affordability and supply security. Competitive intensity is moderate, leaving room for regional processors and global multinationals to capture unmet demand through culturally relevant flavors, fortified recipes, and omnichannel distribution.
Key Report Takeaways
- By flavor, flavored products led with 57.65% revenue share of the Africa soy beverages market in 2025, while unflavored variants are forecast to advance at a 12.21% CAGR through 2031.
- By packaging type, Tetra Pak cartons accounted for 53.72% of the Africa soy beverages market size in 2025, whereas bottles are set to expand at a 12.84% CAGR to 2031.
- By distribution channel, supermarkets and hypermarkets commanded 41.02% of the Africa soy beverages market share in 2025, whereas online retail is projected to post a 14.31% CAGR during the outlook period.
- By geography, South Africa captured 40.05% revenue share of the Africa soy beverages market in 2025; Ethiopia is expected to register the highest growth at a 12.74% CAGR through 2031.
Note: Market size and forecast figures in this report are generated using Mordor Intelligence’s proprietary estimation framework, updated with the latest available data and insights as of 2026.
Market Trends and Insights
Drivers Impact Analysis of Africa Soy Beverages Market*
| Driver | (~) % Impact on CAGR Forecast | Geographic Relevance | Impact Timeline |
|---|---|---|---|
| Rising prevalence of lactose intolerance in Africa, increasing demand for dairy alternatives | +3.2% | Regional, strongest in East and Southern Africa | Long term (≥ 4 years) |
| Growing health consciousness and awareness of soy's nutritional benefits | +2.8% | Urban centers across South Africa, Nigeria, Kenya, Ethiopia | Medium term (2-4 years) |
| Expanding vegan and vegetarian population favoring plant-based beverages | +1.9% | South Africa, urban Nigeria, Kenya metropolitan areas | Medium term (2-4 years) |
| Product innovations including fortified and flavored soy beverages | +2.1% | South Africa, Nigeria, Morocco with spillover to other markets | Short term (≤ 2 years) |
| Government initiatives promoting nutrition and sustainable agriculture | +1.7% | Ethiopia, Nigeria, Kenya with national policy focus | Long term (≥ 4 years) |
| Availability of high-quality, affordable sources of plant protein from soy | +2.4% | Nigeria, South Africa, Zambia with processing infrastructure | Medium term (2-4 years) |
| Source: Mordor Intelligence | |||
Rising prevalence of lactose intolerance in Africa, increasing demand for dairy alternatives
The rising prevalence of lactose intolerance in Africa, where studies indicate that about 70% to 80% of many population groups are affected, is a significant driver fueling the demand for dairy alternatives like soy beverages. This widespread lactase deficiency, particularly common among African ethnic groups due to the relatively recent adoption of dairy consumption and genetic factors, causes digestive symptoms such as bloating, abdominal cramps, and diarrhea when lactose-intolerant individuals consume traditional dairy products. The high lactose intolerance rates make traditional milk consumption challenging, pushing consumers toward plant-based alternatives like soy milk, which are easier to digest and nutritionally viable. This growing consumer health awareness and intolerance prevalence are driving market growth and innovation in Africa's soy beverages sector, as product offerings diversify to cater to lactose-intolerant populations seeking nutritious, sustainable, and affordable dairy substitutes.
Growing health consciousness and awareness of soy's nutritional benefits
In Africa, urban consumers are placing a growing emphasis on functional nutrition. Soy beverages, known for their complete amino acid profiles and isoflavone compounds, are increasingly recognized for addressing protein malnutrition concerns. Research highlights that fermented soy beverages boast prebiotic activity scores of 1.24, rivaling commercial raffinose supplements in promoting gut health [1]Source: Frontiers, "Exploring prebiotic properties and its probiotic potential of new formulations of soy milk-derived beverages", www.frontiersin.org. Additionally, these beverages maintain probiotic viability, exceeding 10^6 CFU/mL, even under simulated gastrointestinal conditions, ensuring their effectiveness in supporting digestive health. Such dual functionality elevates soy beverages from being mere dairy substitutes to becoming significant players in therapeutic nutrition. Studies in South Africa indicate that consumers, particularly middle-income households focused on improving family nutrition, are willing to pay a premium for beverages with scientifically verified health claims. As advancements in nutritional science intersect with growing consumer awareness, brands have a distinct opportunity to differentiate themselves by leveraging evidence-backed health benefits, moving beyond the conventional generic plant-based narratives.
Product innovations including fortified and flavored soy beverages
In Africa, soy beverage manufacturers leverage fortification technologies to combat prevalent nutritional deficiencies, notably in calcium, vitamin D, and B12. These technologies enable the development of products that address specific dietary gaps, contributing to improved public health outcomes. By blending soy with locally sourced cereals such as millet and sorghum, manufacturers not only enhance taste profiles but also reduce production costs, making the products more accessible. Additionally, this approach supports regional agricultural value chains by creating demand for local crops. Tetra Pak's 2024 breakthroughs in UHT processing and aseptic packaging now allow for a 12-month shelf life without refrigeration, effectively overcoming cold-chain challenges in African distribution networks and ensuring product availability in remote areas. Flavor innovations, featuring African botanicals like marula and umhlonyane, craft culturally relevant products that resonate with local palates, offering a unique identity and setting them apart from imported options. These advancements empower manufacturers to market soy beverages as premium nutritional solutions, elevating them beyond mere commodity substitutes and positioning them as essential contributors to balanced diets.
Government initiatives promoting nutrition and sustainable agriculture
In Ethiopia, government initiatives are significantly boosting soybean cultivation by introducing improved seed varieties and offering comprehensive extension services [2]Source: Ethiopian Agricultural Research Organization, “National Soybean Product Profile and Market Segment Design”, www.eiar.gov.et. These efforts aim to substantially elevate the nation's production capacity, particularly to support the growing domestic beverage manufacturing industry. Meanwhile, Nigeria's Agricultural Transformation Agenda is placing a strong emphasis on the value-added processing of local crops. Specifically, soybean processing is receiving prioritized backing, demonstrated through targeted equipment subsidies and extensive technical training programs. These policy frameworks not only help reduce raw material costs but also ensure a steady and high-quality supply for beverage manufacturers, fostering industry growth. In South Africa, regulations under the Foodstuffs, Cosmetics and Disinfectants Act require transparent and accurate labeling for plant-based beverages. This regulatory measure enhances consumer confidence by ensuring clarity while preventing the misuse of dairy-related terminologies [3]Source: South African Bureau of Standards, “Over 80 Years of Quality Assurance”, www.sabs.co.za. Additionally, the alignment of agricultural policies with broader nutritional objectives creates a highly supportive environment for the expansion of the soy beverage market. This is particularly advantageous for companies that are investing in local processing infrastructures, as it enables them to capitalize on the growing demand for plant-based beverages.
Restraints Impact Analysis of Africa Soy Beverages Market*
| Restraint | (~) % Impact on CAGR Forecast | Geographic Relevance | Impact Timeline |
|---|---|---|---|
| Strong competition from other plant-based milk alternatives such as almond, coconut, and oat milk | -2.1% | South Africa, urban Nigeria, Kenya with diverse product availability | Short term (≤ 2 years) |
| Limited consumer awareness and misconceptions regarding taste and nutrition | -1.8% | Rural areas across all markets, secondary cities | Medium term (2-4 years) |
| Low penetration in rural and underdeveloped areas due to distribution challenges | -1.5% | Rural Ethiopia, Nigeria, Kenya with infrastructure constraints | Long term (≥ 4 years) |
| Supply chain challenges impacting steady raw material supply and product availability | -1.3% | Processing centers in Nigeria, South Africa, Zambia | Medium term (2-4 years) |
| Source: Mordor Intelligence | |||
Strong competition from other plant-based milk alternatives such as almond, coconut, and oat milk
The Africa soy beverages market faces strong competition from other plant-based milk alternatives such as almond, coconut, and oat milk, which act as significant market restraints. These alternative plant-based milks have gained considerable popularity due to their unique flavors, nutritional profiles, and perceived health benefits, diversifying consumer choices away from traditional soy beverages. Almond milk, known for its light texture and vitamin E content, and coconut milk, favored for its creamy consistency and distinct taste, are especially preferred in various African markets. Additionally, oat milk has surged globally due to sustainability and lactose-free benefits, attracting environmentally conscious and lactose-intolerant consumers alike. This competitive landscape challenges soy beverage manufacturers to continuously innovate in taste, formulation, and functional benefits to maintain and grow their market share amid consumers’ expanding preferences for diverse plant-based dairy alternatives.
Limited consumer awareness and misconceptions regarding taste and nutrition
Limited consumer awareness and prevalent misconceptions about the taste and nutritional value of soy beverages pose a significant restraint to the growth of the Africa soy beverages market. Despite the known health benefits of soy, many consumers remain unsure or skeptical about its flavor, leading to hesitation in widespread adoption. Additionally, a substantial portion of the population still views soy milk as inferior or suitable only for certain socioeconomic groups, further limiting its market penetration. Nutritional awareness of soy as a protein-rich, cholesterol-free alternative to dairy is relatively low compared to traditional milk, which consumers perceive as more familiar and trustworthy. These misconceptions, combined with limited exposure to soy products in many regions and price sensitivity, hinder the expansion of soy beverages. Overcoming these barriers requires targeted consumer education, marketing efforts emphasizing taste improvements, and clear communication of nutritional benefits to reshape public perception and increase acceptance across diverse consumer segments.
*Our forecasts treat driver/restraint impacts as directional, not additive. The impact forecasts reflect baseline growth, mix effects, and variable interactions.
Africa Soy Beverages Market Segment Analysis
By Flavor:
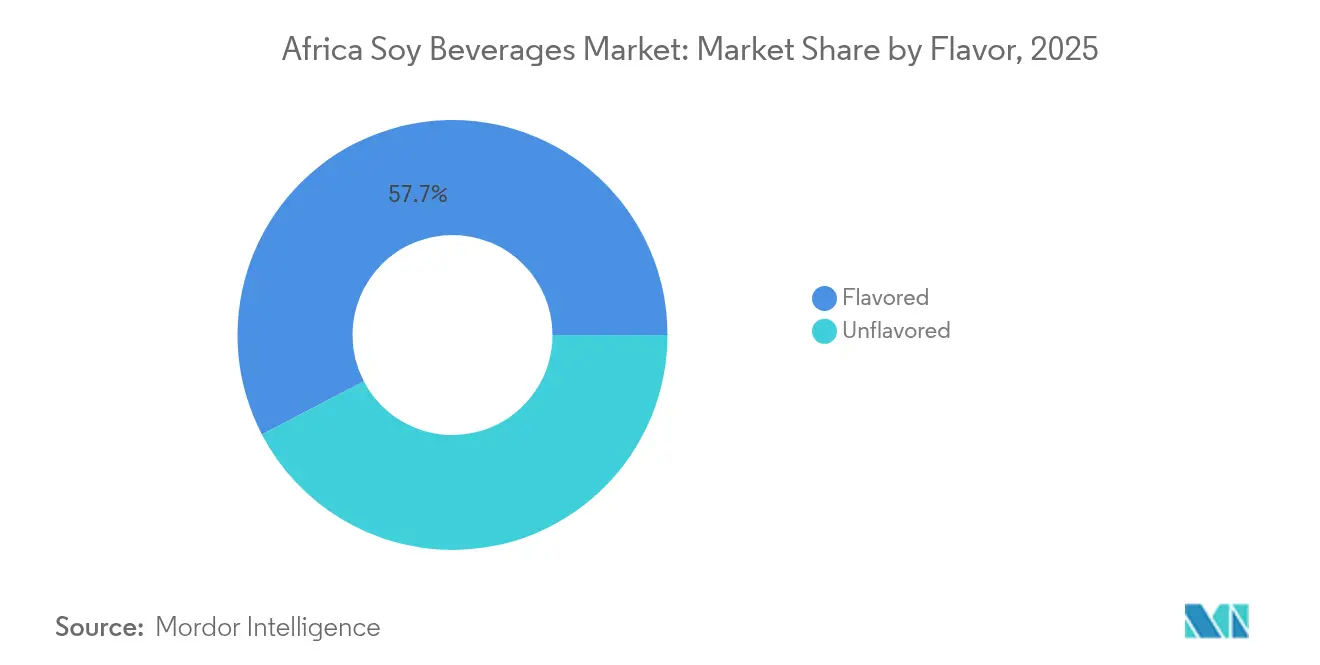
Unflavored Variants Drive Culinary IntegrationFlavored soy beverages continue to dominate the African market, accounting for the largest share of 57.65% in 2025. Their leadership position is largely attributed to strong consumer preference for taste-enhanced options that cater to everyday drinking occasions. Flavored variants are positioned as convenient dairy alternatives, appealing particularly to young consumers and urban populations who prioritize taste, texture, and variety. The availability of multiple flavor profiles also enables manufacturers to expand consumer reach and create premium product categories. In addition, marketing campaigns and wider retail distribution have reinforced the popularity of flavored soy beverages over unflavored options. Given these factors, flavored soy beverages are expected to maintain their prominent role in market leadership, driven by their alignment with mainstream consumption trends in Africa.
Unflavored soy beverages, however, represent the fastest-growing category, projected to expand at a CAGR of 12.21% through 2031. This rapid growth is influenced by evolving consumer behavior that emphasizes functionality and versatility over flavor. Growing health-consciousness and interest in plant-based diets are encouraging consumers to use unflavored soy beverages as an alternative cooking and beverage base. Their compatibility with a variety of recipes such as smoothies, soups, and baked goods has strengthened their appeal among both household and foodservice users. Additionally, the rising focus on natural, minimally processed products supports the adoption of unflavored variants in dietary routines. While unflavored soy beverages currently hold a smaller share compared to flavored ones, their growth trajectory indicates a significant long-term shift in usage patterns, highlighting their strategic importance in the African soy beverages market.



By Packaging Type:
Bottles Capture Premiumization TrendsTetra Pak remains the leading packaging format in the African soy beverages market, commanding a dominant 53.72% share in 2025. Its leadership is supported by widespread availability, cost efficiency, and strong alignment with mass-market distribution strategies. Tetra Pak packaging ensures product safety, extended shelf life, and convenient storage, making it highly suitable for regions with limited cold-chain infrastructure. Additionally, manufacturers favor Tetra Pak due to its scalability and compatibility with aseptic processing, which protects nutritional value while maintaining affordability. The format’s lightweight nature and ease of transport strengthen its presence across both rural and urban outlets. As a result, Tetra Pak is expected to retain its position as the most widely adopted packaging choice, particularly in cost-sensitive and high-volume consumption markets across Africa.
Bottles, on the other hand, are emerging as the fastest-growing packaging format with a projected CAGR of 12.84% through 2031. Growth is being driven by shifting consumer perceptions that associate bottles with higher quality, reusability, and premium appeal. Both glass and PET bottles support premium positioning strategies by differentiating branded products in competitive urban retail environments. Their compatibility with cold-chain distribution networks, which are expanding steadily across African cities, further enhances their market appeal. Bottles also cater to the rising demand for sustainable and convenient packaging among health-conscious and eco-aware consumers. Although their current market share lags behind Tetra Pak, bottles are strategically positioned to capture significant incremental demand by aligning with premiumization and lifestyle-driven purchasing trends across Africa.
By Distribution Channel:
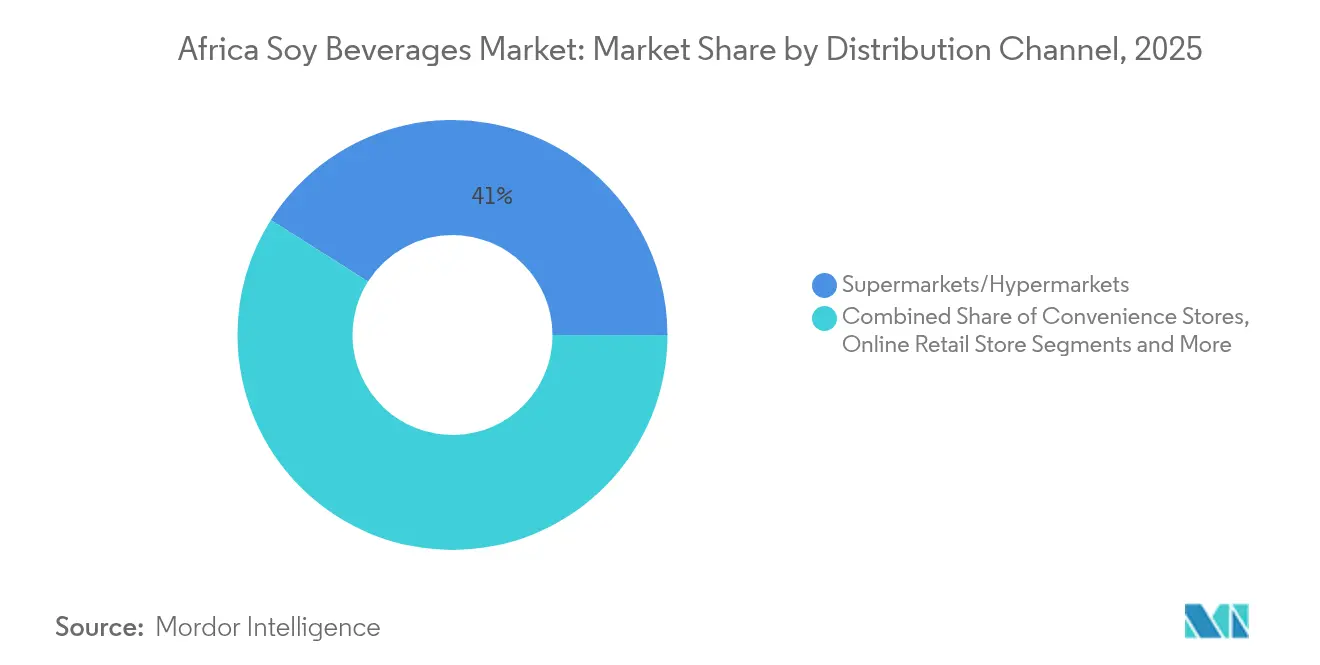
Online Retail Transforms Market AccessSupermarkets continue to dominate the distribution landscape of the African soy beverages market, accounting for the largest market share of 41.02% in 2025. Their dominance is linked to the strong presence of modern retail infrastructure in urban centers, offering wide product assortments and competitive pricing to attract diverse consumer groups. Supermarkets provide visibility and promotional opportunities for soy beverage brands, allowing them to capture impulse purchases and establish consumer familiarity. The format’s emphasis on convenience, accessibility, and consistent stocking reinforces its central role in shaping consumer buying behavior. Moreover, leading players actively use supermarkets for product launches and promotional campaigns, strengthening brand recognition and market penetration.
Online retail channels, however, represent the most dynamic growth opportunity, projected to expand at a CAGR of 14.31% through 2031. This rapid growth is supported by the rise of e-commerce adoption in Africa, alongside digital payment solutions and expanding internet connectivity. Direct-to-consumer strategies and subscription models have enabled soy beverage brands to deepen customer engagement and drive repeat purchases. Online channels are overcoming geographic barriers, making products accessible in secondary cities and suburban areas where physical modern retail networks are limited. In addition, digital marketplaces enhance brand discoverability, allowing niche and premium soy beverage products to reach targeted consumer groups. While still a smaller segment compared to supermarkets, online retail is reshaping the competitive landscape by offering convenience, personalization, and broader market access across Africa.
Geography Analysis
South Africa Soy Beverages Market
In 2025, South Africa secures a 40.05% market share, bolstered by its advanced retail infrastructure and a well-informed consumer base on plant-based nutrition. The nation's robust food processing industry not only produces high-quality soy beverages but also acts as a pivotal export center for adjacent markets. Retail giants like Shoprite, Pick n Pay, and Woolworths boast extensive distribution networks, catering to both urban and rural consumers. Their cold-chain logistics further enhance the freshness of their chilled product offerings. South African regulations, under the Foodstuffs, Cosmetics and Disinfectants Act, uphold stringent product quality standards and mandate transparent labeling, fostering consumer trust in plant-based products. Yet, while South Africa's market is mature, the competitive pressure from global brands tempers its growth, especially when juxtaposed with the more expansive potential seen in emerging African markets.
Ethiopia Soy Beverages Market
Ethiopia stands out as the fastest-growing market, projected to achieve a 12.74% CAGR through 2031. This growth is largely attributed to government-backed initiatives that champion soybean cultivation and its value-added processing. The Ethiopian Agricultural Transformation Agency plays a pivotal role, aiding smallholder farmers with superior soybean varieties and essential extension services. This support cultivates a dependable raw material supply for the nation's beverage producers. Ethiopians' cultural affinity for legume-based foods eases the acceptance of these products. Moreover, as urban populations burgeon, there's a pronounced demand for convenient protein sources that resonate with traditional diets. Processing hubs in Addis Ababa and other regional centers leverage affordable labor and government incentives, crafting competitive pricing strategies that appeal across diverse income brackets.
Africa Soy Beverages Market
Nigeria, Kenya, Morocco, and several other African nations showcase immense growth potential, fueled by urbanization, a burgeoning middle class, and a heightened health consciousness among the educated elite. Nigeria's vast population, coupled with its domestic soybean production, presents lucrative market prospects. Notably, Nestlé has made significant strides, channeling investments into local manufacturing powered entirely by Nigerian soybeans. Meanwhile, Kenya's strategic role as a trade nexus in East Africa streamlines regional distribution. Morocco, on the other hand, enjoys a geographical advantage, being close to European markets, thus amplifying its export potential for premium soy beverages. The broader African segment reaps benefits from regional trade agreements and cross-border investments, propelling market growth. However, challenges like infrastructural limitations and distribution hurdles hinder their pace, especially when compared to more advanced African nations boasting established retail frameworks and efficient cold-chain systems.
Regulatory Landscape
Across Africa, soy beverages are governed by general food safety and labeling controls that increasingly align with Codex Alimentarius principles through the Codex Coordinating Committee for Africa (CCAFRICA), which emphasizes risk-based preventive controls, traceability, and licensing expectations for processors and importers. In South Africa, labeling requirements under the Foodstuffs, Cosmetics and Disinfectants Act support accurate product identity and nutrition declarations for plant-based beverages.
At the regional level, standard-setting bodies and trade blocs also shape market access for soy beverages and related inputs. In East Africa, EAS 800:2023 for non-fermented soya bean products provides specification anchors for composition and quality, supporting more consistent cross-border compliance approaches. For intra-African trade, the African Continental Free Trade Area (AfCFTA) framework targets 90% tariff liberalization over a defined transition period, while regional SPS frameworks (including COMESA regulations and SADC food safety guidelines) influence inspection, import controls, and conformity assessment practices for both finished soy beverages and key raw materials.
Value Chain Analysis
The Africa soy beverages value chain begins with soybean cultivation and aggregation, then moves through primary processing (cleaning, dehulling, and milling/crushing) and into beverage manufacturing (extraction, formulation, fortification, homogenization, and UHT/aseptic or chilled filling). Domestic soybean programs support sourcing in multiple markets, with South Africa and Zambia acting as important supply and processing bases for intra-regional trade in soybeans and derivatives, while several importing markets rely on regional flows or global commodity channels for beans, soy protein ingredients, packaging materials, and processing aids.
Manufacturing economics and availability depend on processing infrastructure and shelf-stable packaging that reduce cold-chain exposure. Investments in UHT processing and aseptic packaging, including Tetra Pak cartons (the leading pack type by 2025 share), extend ambient shelf life and help products reach beyond major urban corridors. Downstream, soy beverages are distributed via modern retail (supermarkets and hypermarkets as the largest channel by 2025 share), convenience and specialist stores, and an e-commerce layer that supports direct-to-consumer replenishment in secondary cities. Constraints remain around consistent bean quality, limited dedicated soybean crushing capacity in some markets, and distribution into rural areas, which increases the attractiveness of localized co-processing hubs and more stable procurement relationships with farmer groups and aggregators.
Competitive Landscape
The Africa soy beverages market, with a concentration score of 7, reflects a moderately competitive landscape. This environment offers opportunities for both multinational corporations and regional specialists to establish significant market positions through tailored strategies. Multinational companies leverage their established distribution networks and strong brand recognition to maintain dominance. For instance, Danone's extensive presence across 15 African countries provides it with scale advantages and supply chain efficiencies, enabling it to cater to a broad consumer base effectively. However, this dominance also creates space for regional players to target niche markets and underserved segments with innovative and localized offerings.
Emerging players in the market are focusing on localized production, cultural relevance, and competitive pricing to differentiate themselves. These strategies allow them to address specific consumer preferences and penetrate markets that larger corporations may overlook. By understanding local tastes and preferences, regional players can develop products that resonate with consumers, thereby gaining a foothold in the market. Additionally, price positioning plays a critical role in attracting cost-conscious consumers, especially in regions where affordability is a key factor influencing purchasing decisions.
Technology adoption is another crucial factor shaping the competitive landscape of the Africa soy beverages market. Companies investing in advanced technologies such as UHT processing, aseptic packaging, and cold-chain distribution are better positioned to overcome Africa's infrastructure challenges. These technologies ensure product quality and safety while extending shelf life, which is essential in regions with limited cold storage facilities. Firms that prioritize such innovations are likely to gain a competitive edge, as they can meet consumer demand for high-quality products while addressing logistical constraints effectively.
Africa Soy Beverages Industry Leaders
-
Danone S.A.
-
Clover S.A. (Pty) Ltd
-
Groupe Lactalis
-
Nestlé S.A.
-
Hain Celestial Group
- *Disclaimer: Major Players sorted in no particular order
Africa Soy Beverages Market Companies Covered in this Report
- Danone S.A.
- Clover S.A. (Pty) Ltd
- Groupe Lactalis
- Nestlé S.A.
- Hain Celestial Group
- Tempus Dynamics
- Good Hope International Inc.
- Dewfresh (Pty) Ltd
- Freedom Foods Group
- Pacific Foods
- Morinaga Milk Industry
- Vitasoy International Ltd.
- Milky Way Cape Town
- Eden Foods, Inc.
- Maeil Dairies
- Jaffe Bros
- Soy Vitafit
- ProSoya
- Woolworths Holdings Ltd
- Good Life Nutrition

Market Opportunities and Future Outlook
Near-term opportunity is concentrated upstream in localized industrial supply of beverage-relevant soy inputs as additional soybean crushing capacity comes online. In April 2026, Olam Agri opened a USD 50 million soybean crushing plant and feed mill in Ilorin, Kwara State, Nigeria, with 250,000 to 350,000 metric tonnes of annual processing capacity, which strengthens the availability of locally processed soy derivatives for broader food and beverage manufacturing. In West Africa, SIATOL inaugurated a soybean oil mill in Ouagadougou, Burkina Faso (March 2026), adding another domestic processing node and supporting sourcing and contracting models that separate oil and meal streams while enabling value-added applications.
On the finished-product side, opportunity is visible for shelf-stable, fortified, and culturally adapted soy beverages that target micronutrient gaps (calcium, vitamin D, B12, and iron) and reduce dependency on cold-chain-dependent channels. Technology transfer and modular processing projects can also widen the addressable base in under-processed markets: Tanzania adopted Chinese soy-processing technology to expand local soy milk production (August 2024), illustrating how smaller-scale processing can seed local brands and improve availability where industrial capacity is limited. Given that supermarkets and hypermarkets hold a large 2025 distribution share and online retail is scaling from a smaller base, brands can pair mass-market aseptic packs with targeted digital assortment strategies (subscriptions, multipacks, and functional variants) to lift repeat purchase and expand access in secondary cities.
Recent Industry Developments in Africa Soy Beverages Market
- April 2026: Olam Agri opened a USD 50 million soybean crushing plant and feed milling facility in Ilorin, Kwara State, Nigeria, adding 250,000 to 350,000 metric tonnes of annual processing capacity. The project increases locally processed soy availability and supports more consistent industrial inputs for downstream food and beverage manufacturers. It also strengthens domestic sourcing narratives that matter for price positioning and supply continuity in Nigeria.
- May 2025: Danone confirmed continued investment in Nigeria focused on strengthening milk distribution infrastructure in northern regions. The move targets route-to-market efficiency and cost-to-serve improvements across a challenging logistics environment. Better distribution execution can lift availability for both dairy and adjacent nutrition formats, influencing competitive intensity in modern and traditional trade.
- August 2024: Tanzania adopted Chinese technology to produce soy milk domestically, supported by training that began in 2022 and aimed at enabling local processing capabilities. The initiative addresses a key constraint in several African markets, limited processing infrastructure close to growers and consumers. It supports small-scale production models that can broaden affordability and build local supply resilience.


Africa Soy Beverages Market Report Scope and Research Methodology
Market Definition and Coverage
For this study, the Africa soy beverages market is defined as retail and foodservice sales value of packaged soy-based drinks across African countries, covering soy milk and soy-based drinkable yogurt sold through offline and online channels.
Scope exclusions: It excludes soy ingredients used for cooking or industrial formulation, and it also excludes other plant-based beverages that are not soy-based.
Segments Covered in This Report
-
By Flavor
- Flavored
- Unflavored
-
By Packaging Type
- Tetra Pak
- Bottles (PET/Glass)
- Others
-
By Distribution Channel
- Supermarkets/Hypermarkets
- Convenience Stores
- Specialist Stores
- Online Retail Stores
- Other Distribution Channels
-
By Country
- South Africa
- Nigeria
- Egypt
- Ethiopia
- Kenya
- Morocco
- Rest of Africa
Data Sources, Market Sizing, and Validation
Desk Research
Desk research was used to build the base structure of the market, then pressure test early assumptions on demand and pricing. We typically reviewed public sources such as FAOSTAT for soybean supply signals, UN Comtrade for trade flows, and World Bank and IMF indicators for income and inflation context, with national statistics offices where packaged beverage and food inflation series are available. To keep the market grounded in what is actually sold, country-level food regulations and standards guidance were also scanned (for example, labeling and fortification rules where available).
Alongside these, we used company annual reports, public investor materials, association websites, and reputable press to map product launches, pack formats, and channel expansion patterns. Selected paid subscriptions were used only when they helped confirm company financials, track news and filings efficiently, or cross-check import and export shipment patterns for relevant beverage categories. The desk sources listed above are illustrative, and additional public references were reviewed to collect data, validate assumptions, and clarify gaps.
Primary Interviews and Surveys
Primary work focused on confirming what is included in the market and what is not, then stress testing price and volume assumptions by country and channel. We spoke with manufacturers, distributors, retailers, and category specialists who could comment on pack-size splits, typical discounting, shelf pricing, and how soy beverages move through modern trade versus smaller stores. Because this is an Africa-wide study, inputs were checked across major demand pockets and the Rest of Africa, so the final model could reflect country-specific channel and pack realities.
Distribution of primary research fieldwork respondents
| Company type | Respondent position |
|---|---|
| Top tier: 34% | CXOs: 17% |
| Mid tier: 46% | Functional/Unit leaders: 37% |
| Smaller Players: 20% | Managers: 46% |
Market-Sizing & Forecasting
Market sizing was first built using a top-down approach where the demand pool was reconstructed from country-level consumption signals, channel presence of soy beverages, and typical retail pricing by pack type. The model was then cross-checked using selective bottom-up approximations, such as rolling up sampled brand and pack price points across key retailers, followed by volume sanity checks from distributor discussions, which helped adjust totals when early results looked too high or too low.
Key inputs we tracked (illustrative) included the split of soy milk versus drinkable yogurt, plain versus flavored mix, packaging preferences like Tetra Pak versus bottles, modern trade versus convenience and specialist store weighting, and country-level inflation and currency movement that affects reported value in USD. For forecasts, scenario analysis was used to reflect how adoption changes under different affordability and distribution expansion paths, and then the final outlook was aligned to the expert consensus heard during interviews. Where bottom-up checks had gaps, such as weaker visibility in smaller cities or informal retail, assumptions were filled using conservative channel weights and re-tested with additional calls before finalizing.
Data Validation & Update Cycle
Results were validated through multiple checks so the final number ties back to clear variables and real market signals. We compared implied per-capita consumption and implied average selling prices against what retailers and distributors described, then reviewed outliers until the cause was understood, such as one-time promotions, pack-size changes, or currency timing effects. A second analyst review is completed before sign-off, and any large variance against expected channel patterns triggers follow-up outreach.
Reports are refreshed annually, with interim updates when there is a material change, such as a major pricing reset, regulatory action, or a notable shift in distribution availability. Before delivery, a final pass is performed to ensure the latest publicly available data and primary insights are reflected in the charts and the model outputs.
Mordor Intelligence's Africa Soy Beverages Market Size Compared Against Other Published Estimates
Published market sizes for soy beverages in Africa often do not match because the study scope and the conversion logic differ, and the timing of the underlying price assumptions is not always the same. In practice, differences usually come from whether the estimate is limited to soy milk versus a wider soy-drinks basket, how online retail is handled, and whether the geography is strictly Africa or bundled into a larger MEA view.
The main gap comes from bundled geography and category inflation, where Mordor Intelligence counts only Africa soy beverages and keeps soy milk and drinkable yogurt within a stated pack and channel scope, rather than mixing in broader MEA totals or adjacent dairy-alternative categories.
Benchmark comparison
| Source | Market Size | Gaps in Research Methodology |
|---|---|---|
| Mordor Intelligence | USD 82.72 M (2025) | |
| Global Consultancy A | USD 0.50 B (2024) | Uses a different base year and appears to apply a broader soy-drinks definition with higher assumed pricing and faster value build, which can lift totals when country coverage and currency timing are not made explicit. |
| Trade Journal B | USD 0.80 B (2024) | Combines Middle East and Africa into one MEA total and uses a wider regional footprint, so the value is not directly comparable to an Africa-only scope even if product labels look similar. |
The spread across the three figures mostly traces back to geography choices and to how product groupings are bundled when reporting a single headline number. By keeping the scope tight to Africa and tying value to pack and channel pricing checks, the model stays easier to replicate and simpler to audit when assumptions need to be revisited.


Key Questions Answered in the Report
How large is the Africa soy beverages market today?
The Africa soy beverages market size is USD 92.75 million in 2026 and is projected to reach USD 164.47 million by 2031.
What CAGR is expected for soy beverages across Africa through 2031?
The market is forecast to register a 12.13% CAGR during 2026-2031, supported by lactose intolerance prevalence and product innovation.
Which country leads consumption of soy drinks in Africa?
South Africa holds the largest share at 40.05% of 2025 revenue thanks to its mature retail infrastructure and consumer familiarity with plant-based nutrition.
Why are unflavored soy beverages growing faster than flavored options?
Unflavored variants integrate easily into home cooking and traditional recipes, driving a 12.21% CAGR versus flavored lines that already dominate share.
How are online channels influencing soy beverage sales?
E-commerce and mobile payment platforms are expected to expand at a 14.31% CAGR, broadening access to regions beyond modern supermarket footprints.
Page last updated on:





