Africa Polyamide Market Size and Share
Market Overview
| Study Period | 2020 - 2031 |
|---|---|
| Forecast Data Period | 2026 - 2031 |
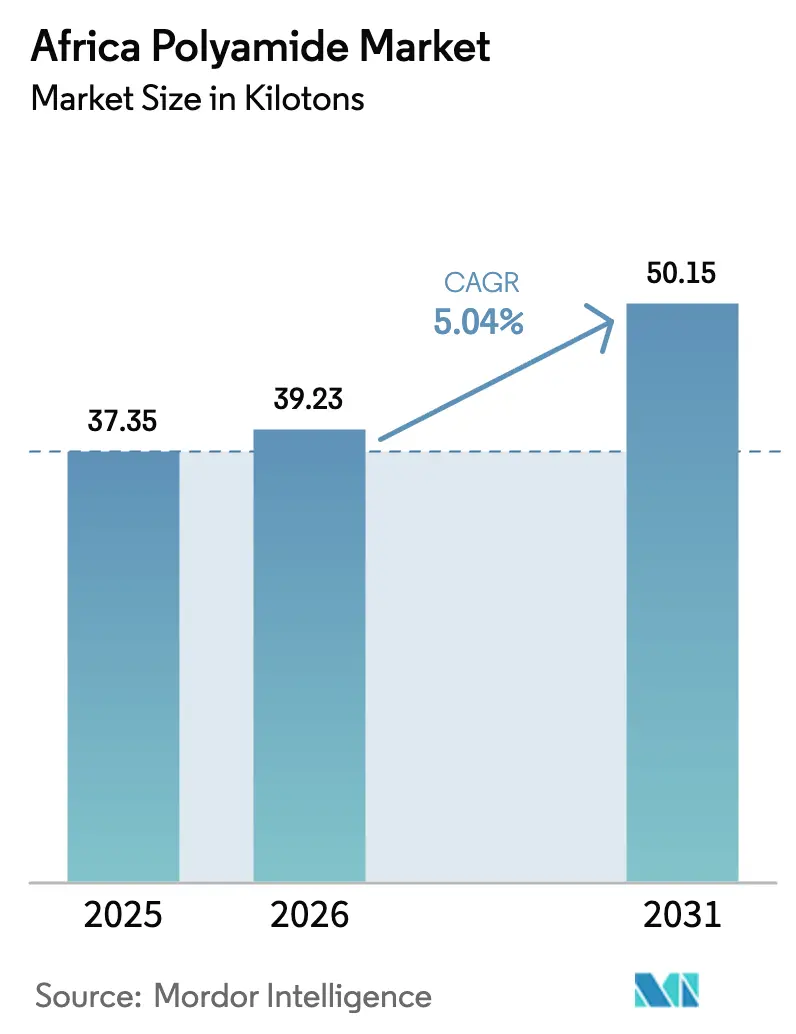
| Base Year Market Size (2025) | 37.35 kilotons |
| Market Volume (2026) | 39.23 kilotons |
| Market Volume (2031) | 50.15 kilotons |
| Growth Rate (2026 - 2031) | 5.04% CAGR |
| Market Concentration | High |
Major Players *Disclaimer: Major Players sorted in no particular order Image © Mordor Intelligence. Reuse requires attribution under CC BY 4.0. | |
Africa Polyamide Market Analysis by Mordor Intelligence
The Africa Polyamide Market size was valued at 37.35 kilotons in 2025 and estimated to grow from 39.23 kilotons in 2026 to reach 50.15 kilotons by 2031, at a CAGR of 5.04% during the forecast period (2026-2031). This upward trajectory springs from the continent’s widening automotive assembly footprint, fast-growing e-commerce fulfillment networks that demand puncture-resistant films, and an accelerating build-out of renewable-energy assets that specify engineered polymers for high-temperature electrical parts. Robust vehicle lightweighting initiatives across South Africa and Morocco, combined with AfCFTA-enabled regional sourcing, are reshaping supply chains and prompting investments in localized compounding plants that can tailor grades to automotive, packaging, and electrical specifications. Meanwhile, the shift toward New Energy Vehicles (NEVs) is amplifying demand for advanced polyamide grades with flame-retardancy, thermal stability, and recyclability attributes.
Key Report Takeaways
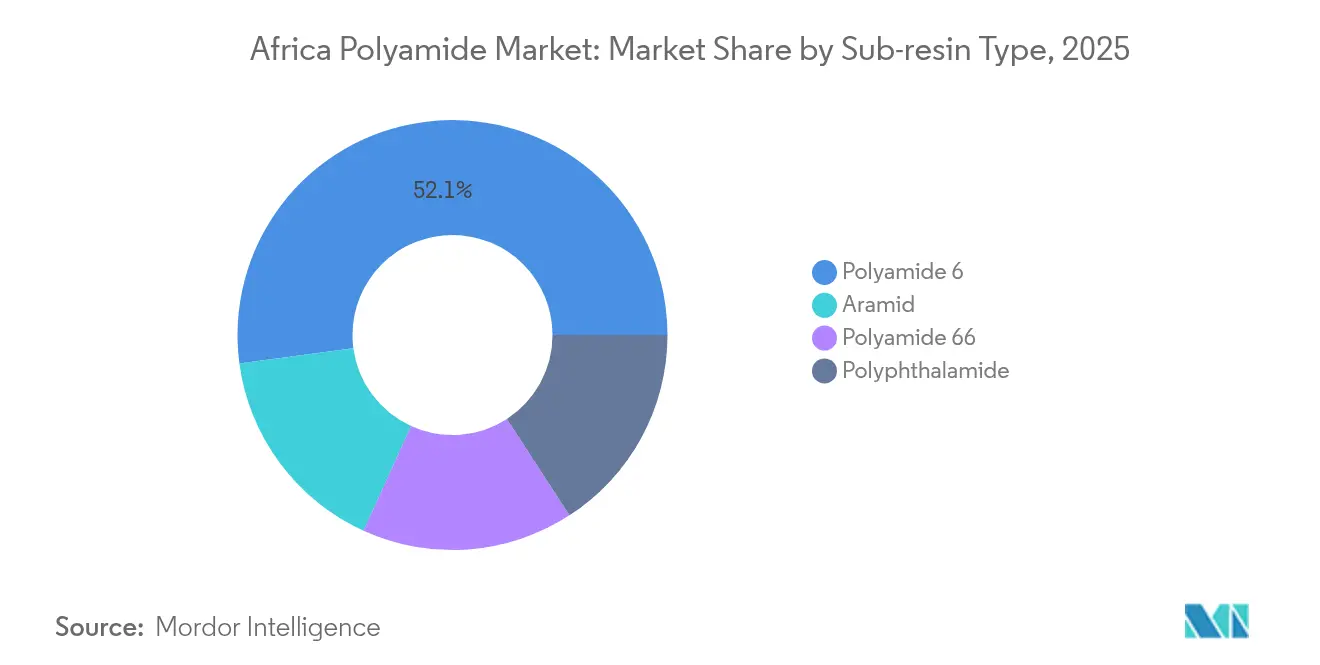
- By sub-resin, Polyamide 6 accounted for 52.11% of the Africa polyamide market share in 2025, while Aramid is projected to post the fastest 5.78% CAGR through 2031.
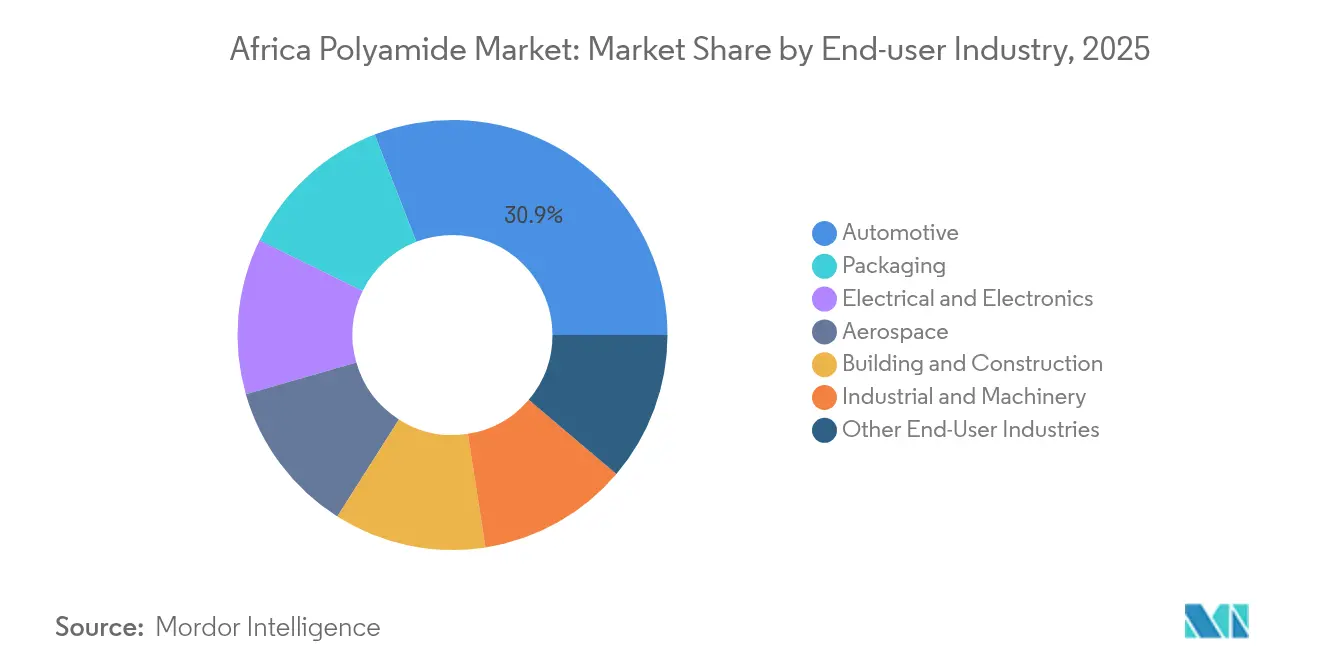
- By end-user industry, automotive applications held 30.90% of the Africa polyamide market share in 2025, and the segment is forecast to grow at a 6.18% CAGR to 2031.
- By geography, the rest of Africa held 53.61% of the total market and is poised to grow at a CAGR of 5.52% through 2031.
Note: Market size and forecast figures in this report are generated using Mordor Intelligence’s proprietary estimation framework, updated with the latest available data and insights as of 2026.
Africa Polyamide Market Trends and Insights
Drivers Impact Analysis*
| Drivers | (~) % Impact on CAGR Forecast | Geographic Relevance | Impact Timeline |
|---|---|---|---|
| Vehicle lightweighting demand from Africa’s growing auto assembly | +1.8% | South Africa, Morocco, Nigeria | Medium term (2-4 years) |
| E-commerce boom driving puncture-resistant packaging film | +1.2% | Nigeria, Kenya, South Africa, Egypt | Short term (≤ 2 years) |
| AfCFTA incentives localizing engineering-plastic supply chains | +0.9% | Continental | Long term (≥ 4 years) |
| Renewable-energy build-out needs high-temperature electrical connectors | +1.1% | Sahel countries, East Africa | Medium term (2-4 years) |
| EU Green-Deal rules spurring bio-based polyamide adoption | +0.6% | North Africa, South Africa | Long term (≥ 4 years) |
| Source: Mordor Intelligence | |||


Vehicle Lightweighting Demand from Automotive Assembly
Africa’s vehicle makers are shifting from knock-down assembly toward more integrated manufacturing, which elevates specifications for lightweight, heat-resistant components. Polyamide applications now extend from air-intake manifolds and under-the-hood fasteners to battery enclosures in emerging NEV platforms. South African OEMs leverage in-country compounding partners to co-develop glass-fiber-reinforced PA6/PA66 grades that reduce part weight by up to 30% compared with metal alternatives. Moroccan plants situated in the Tanger Automotive City cluster draw on European design requirements, pushing demand for flame-retardant polyamide formulations that comply with UNECE Regulation 100. Nigerian assemblers, attracted by AfCFTA rule-of-origin provisions, are piloting localized molding of radiator end-tanks using recycled PA6 sourced from maritime waste streams.
E-commerce Expansion Boosts Packaging Film Adoption
Online retail transactions across Africa rose 38% between 2023 and 2025, pressuring logistics networks to safeguard small-parcel deliveries against puncture, abrasion, and moisture. Flexible multilayer pouches that embed PA6 tie-layers deliver the required burst strength while permitting downgauging that lowers overall material use. Nigeria and Kenya recorded double-digit growth in food-grade stand-up pouches, many now adopting oxygen-barrier polyamide layers to extend snack-food shelf life beyond 180 days. South African converters are running 9-layer blown-film lines capable of incorporating bio-attributed Ultramid Biomass Balance resins, reinforcing the sustainability narrative for the Africa polyamide market.
AfCFTA Incentivizes Regional Supply-Chain Localization
AfCFTA’s tariff phase-down covering 90% of lines is triggering a geographic re-optimization of polymer flows. Compounders in Gauteng and Casablanca are shipping stabilized PA6 pellets duty-free to smaller processors in Accra and Kigali, cutting landed costs by up to 7% and shortening lead times by two weeks[1]African Export-Import Bank, “African Trade and Economic Outlook 2025,” afreximbank.com. Automotive Tier-2 suppliers benefit most because localized sourcing of engineering plastics bolsters their compliance with rising local-content thresholds. Several investors have announced greenfield compounding units in Egypt’s SCZONE and Nigeria’s Lekki Free Zone, each targeting 15,000 MT of annual polyamide output for automotive, cable, and flexible packaging converters.
Renewable-Energy Build-out Needs High-Temperature Connector Parts
The Desert to Power program’s 10 GW solar pipeline requires junction-box housings, cable glands, and inverter covers that operate reliably at 120 °C ambient temperatures. Flame-retardant, UV-stabilized PA66 and PPA grades offer the dielectric strength and dimensional stability needed for harsh desert climates[2]African Development Bank Group, “Desert to Power Initiative,” afdb.org . East African wind projects add further demand for glass-fiber-reinforced polyamide components in nacelle covers and yaw mechanisms. Local cable-assembly houses in Senegal are partnering with European compounders to validate UL 94 V-0 compliant PA66 blends, opening substitution opportunities versus often imported metal or thermoset parts.
Restraints Impact Analysis*
| Restraints | (~) % Impact on CAGR Forecast | Geographic Relevance | Impact Timeline |
|---|---|---|---|
| Volatile crude-based caprolactam and adipic-acid prices | −1.4% | Global | Short term (≤ 2 years) |
| Scarce regional compounding and testing infrastructure | −0.8% | Sub-Saharan Africa (ex-South Africa) | Medium term (2-4 years) |
| Fragmented national standards and approvals | −0.5% | Continental | Long term (≥ 4 years) |
| Source: Mordor Intelligence | |||
Feedstock Price Volatility Challenges Cost Predictability
Caprolactam and adipic acid, both derived from petrochemical streams, have witnessed quarter-on-quarter price swings of up to 18% since 2024 as global naphtha markets reacted to refinery closures and freight bottlenecks. African importers pay extra premiums owing to limited bulk terminals and currency depreciation, with francophone markets seeing CIF surcharges that raise fully-loaded PA6 prices by USD 260 per ton versus Asian averages. Such unpredictability compresses margins for small compounders who lack hedging instruments or long-term offtake contracts, forcing periodic production stoppages when inventory costs outrun customer price tolerance.
Limited Regional Compounding and Testing Infrastructure
Outside South Africa, the continent hosts fewer than 10 ISO-9001 certified engineering-plastic compounders with capacities above 5,000 MT per year. Power unreliability and scant resin-testing laboratories lengthen product-qualification cycles for automotive and electrical customers, deterring them from sourcing locally compounded grades. Processors in Ghana must often ship samples to European labs for UL or IEC certification, adding six to eight weeks and USD 4,000 in extra cost per grade. Donor-backed initiatives are funding shared regional polymer-testing hubs, yet timely build-out remains critical to unlock deeper localization in the Africa polyamide market.
*Our forecasts treat driver/restraint impacts as directional, not additive. The impact forecasts reflect baseline growth, mix effects, and variable interactions.
Segment Analysis
By Sub-Resin Type: PA6 Dominance Faces Aramid Innovation
Polyamide 6 retained 52.11% of the Africa polyamide market share in 2025, reflecting its broad compatibility with injection molding and extrusion equipment across automotive, packaging, and cable markets. The segment’s appeal grows as feedstock suppliers pilot circular PA6 projects that convert post-industrial textile waste into high-purity loopamid pellets, aligning with brand-owner recycled-content mandates.
Aramid, although starting from a small base, is projected to record a 5.78% CAGR driven by rising procurement of ballistic fabrics for aerospace maintenance and mining-safety gear. High price points limit penetration, yet defense and energy operators in South Africa and Nigeria now specify para-aramid reinforcement for hoses and belts used in corrosive environments. Polyamide 66 claims a steady niche in under-the-hood components requiring heat resistance above 200 °C; RadiciGroup’s specialty PA66 grades, rated for continuous-use temperatures of 210 °C, underpin the segment’s relevance in NEV battery-module frames


By End-User Industry: Automotive Leadership Drives Innovation
Automotive captured 30.90% of the Africa polyamide market share in 2025 as OEMs worked to trim vehicle mass while meeting tougher emissions and performance norms. The segment’s Africa polyamide market size is projected to grow at a CAGR of 6.18% CAGR as NEVs accelerate polymer substitution. Over 65% of the demand centers on glass-fiber-reinforced grades for air-intake manifolds, engine covers, and cooling systems, while emerging applications range from battery-cell frames to high-voltage connectors.
Packaging is fueled by e-commerce fulfillment centers that prefer multilayer pouches and courier bags incorporating PA6 tie-layers to boost puncture strength. Electrical and electronics share climbs steadily as solar-farm cable glands, inverter housings, and home-appliance parts adopt FR-PA66 and PPA formulations. Industrial machinery, construction, and aerospace remain smaller but strategically important areas where specialty polyamide grades demonstrate superior fatigue resistance and flame retardancy.
Geography Analysis
Rest of Africa, encompassing East and West African markets plus North African countries beyond Morocco held 53.61% of the total maket and is projected to grow at a 5.52% CAGR. Kenya and Ghana show fast uptake in flexible packaging and cable-management products, while the Sahel solar corridor drives specialty demand for FR-PA66 connectors. Morocco enjoys policy support through its Industrial Acceleration Plan, encouraging localized molding of automotive parts that serve European export programs. Egypt’s Suez Canal Economic Zone attracts resin compounders that leverage its duty-free gateways into EU markets under diagonal cumulation rules.
Sasol Chemicals operates a regional polymer hub in South Africa that expedites the supply of compounded PA6 and PA66 to OEMs and Tier-1 suppliers in the Gauteng and Eastern Cape corridors. Continuous technical-service support and reliable power availability underpin the adoption of higher-value flame-retardant and glass-fiber-reinforced polyamides.
Nigeria is the most significant incremental volume opportunity because of its large population, booming e-commerce sector, and vehicle-assembly incentives under the National Automotive Design and Development Council (NADDC). However, chronic grid instability and limited certified testing labs restrict high-temperature and flame-retardant polyamide applications, forcing many converters to import pre-compounded material that meets automotive and electrical norms.
Competitive Landscape
The Africa polyamide market is consolidated in nature. Strategic moves emphasize circularity: DOMO’s Sea2See program channels discarded fishing nets from West African coasts into automotive-grade TECHNYL 4EARTH compounds, while BASF’s partnership with Takazuri converts post-consumer polyamide into climate-resilient roofing tiles for East African housing. Regional compounders such as APPL Industries and MCG Advanced Materials serve mid-tier processors requiring quick turnaround and smaller lots. These firms compete on proximity, flexibility, and cost, although they are limited by higher feedstock procurement prices and fewer certified grades. New entrants eyeing AfCFTA’s duty reductions include Egyptian and Nigerian joint ventures backed by Gulf petrochemical producers seeking downstream diversification.
Africa Polyamide Industry Leaders
Arkema
BASF
DSM-Firmenich
EMS-CHEMIE HOLDING AG
SABIC
- *Disclaimer: Major Players sorted in no particular order

Recent Industry Developments
- September 2025: BASF unveiled Ultramid H33 L, the world’s first thermoplastic polyamide with high water permeability for artificial casings in smoked-sausage production.
- June 2024: DOMO Chemicals expanded its Sea2See partnership to recycle African coastal fishing nets into TECHNYL 4EARTH compounds for automotive and electronics parts.


Africa Polyamide Market Report Scope
Aerospace, Automotive, Building and Construction, Electrical and Electronics, Industrial and Machinery, Packaging are covered as segments by End User Industry. Aramid, Polyamide (PA) 6, Polyamide (PA) 66, Polyphthalamide are covered as segments by Sub Resin Type. Nigeria, South Africa are covered as segments by Country.| Aramid |
| Polyamide 6 |
| Polyamide 66 |
| Polyphthalamide |
| Aerospace |
| Automotive |
| Building and Construction |
| Electrical and Electronics |
| Industrial and Machinery |
| Packaging |
| Other End-User Industries |
| Nigeria |
| South Africa |
| Rest of Africa |
| By Sub-Resin Type | Aramid |
| Polyamide 6 | |
| Polyamide 66 | |
| Polyphthalamide | |
| End-user Industry | Aerospace |
| Automotive | |
| Building and Construction | |
| Electrical and Electronics | |
| Industrial and Machinery | |
| Packaging | |
| Other End-User Industries | |
| By Geography | Nigeria |
| South Africa | |
| Rest of Africa |


Market Definition
- End-user Industry - Building & Construction, Packaging, Automotive, Aerospace, Industrial Machinery, Electrical & Electronics, and Others are the end-user industries considered under the polyamide market.
- Resin - Under the scope of the study, virgin polyamide resins like Polyamide 6, Polyamide 66, Polyphthalamide, and Aramid in the primary forms are considered.
| Keyword | Definition |
|---|---|
| Acetal | This is a rigid material that has a slippery surface. It can easily withstand wear and tear in abusive work environments. This polymer is used for building applications such as gears, bearings, valve components, etc. |
| Acrylic | This synthetic resin is a derivative of acrylic acid. It forms a smooth surface and is mainly used for various indoor applications. The material can also be used for outdoor applications with a special formulation. |
| Cast film | A cast film is made by depositing a layer of plastic onto a surface then solidifying and removing the film from that surface. The plastic layer can be in molten form, in a solution, or in dispersion. |
| Colorants & Pigments | Colorants & Pigments are additives used to change the color of the plastic. They can be a powder or a resin/color premix. |
| Composite material | A composite material is a material that is produced from two or more constituent materials. These constituent materials have dissimilar chemical or physical properties and are merged to create a material with properties unlike the individual elements. |
| Degree of Polymerization (DP) | The number of monomeric units in a macromolecule, polymer, or oligomer molecule is referred to as the degree of polymerization or DP. Plastics with useful physical properties often have DPs in the thousands. |
| Dispersion | To create a suspension or solution of material in another substance, fine, agglomerated solid particles of one substance are dispersed in a liquid or another substance to form a dispersion. |
| Fiberglass | Fiberglass-reinforced plastic is a material made up of glass fibers embedded in a resin matrix. These materials have high tensile and impact strength. Handrails and platforms are two examples of lightweight structural applications that use standard fiberglass. |
| Fiber-reinforced polymer (FRP) | Fiber-reinforced polymer is a composite material made of a polymer matrix reinforced with fibers. The fibers are usually glass, carbon, aramid, or basalt. |
| Flake | This is a dry, peeled-off piece, usually with an uneven surface, and is the base of cellulosic plastics. |
| Fluoropolymers | This is a fluorocarbon-based polymer with multiple carbon-fluorine bonds. It is characterized by high resistance to solvents, acids, and bases. These materials are tough yet easy to machine. Some of the popular fluoropolymers are PTFE, ETFE, PVDF, PVF, etc. |
| Kevlar | Kevlar is the commonly referred name for aramid fiber, which was initially a Dupont brand for aramid fiber. Any group of lightweight, heat-resistant, solid, synthetic, aromatic polyamide materials that are fashioned into fibers, filaments, or sheets is called aramid fiber. They are classified into Para-aramid and Meta-aramid. |
| Laminate | A structure or surface composed of sequential layers of material bonded under pressure and heat to build up to the desired shape and width. |
| Nylon | They are synthetic fiber-forming polyamides formed into yarns and monofilaments. These fibers possess excellent tensile strength, durability, and elasticity. They have high melting points and can resist chemicals and various liquids. |
| PET preform | A preform is an intermediate product that is subsequently blown into a polyethylene terephthalate (PET) bottle or a container. |
| Plastic compounding | Compounding consists of preparing plastic formulations by mixing and/or blending polymers and additives in a molten state to achieve the desired characteristics. These blends are automatically dosed with fixed setpoints usually through feeders/hoppers. |
| Plastic pellets | Plastic pellets, also known as pre-production pellets or nurdles, are the building blocks for nearly every product made of plastic. |
| Polymerization | It is a chemical reaction of several monomer molecules to form polymer chains that form stable covalent bonds. |
| Styrene Copolymers | A copolymer is a polymer derived from more than one species of monomer, and a styrene copolymer is a chain of polymers consisting of styrene and acrylate. |
| Thermoplastics | Thermoplastics are defined as polymers that become soft material when it is heated and becomes hard when it is cooled. Thermoplastics have wide-ranging properties and can be remolded and recycled without affecting their physical properties. |
| Virgin Plastic | It is a basic form of plastic that has never been used, processed, or developed. It may be considered more valuable than recycled or already used materials. |


Research Methodology
Mordor Intelligence follows a four-step methodology in all our reports.
- Step-1: Identify Key Variables: The quantifiable key variables (industry and extraneous) pertaining to the specific product segment and country are selected from a group of relevant variables & factors based on desk research & literature review; along with primary expert inputs. These variables are further confirmed through regression modeling (wherever required).
- Step-2: Build a Market Model: In order to build a robust forecasting methodology, the variables and factors identified in Step-1 are tested against available historical market numbers. Through an iterative process, the variables required for market forecast are set and the model is built on the basis of these variables.
- Step-3: Validate and Finalize: In this important step, all market numbers, variables and analyst calls are validated through an extensive network of primary research experts from the market studied. The respondents are selected across levels and functions to generate a holistic picture of the market studied.
- Step-4: Research Outputs: Syndicated Reports, Custom Consulting Assignments, Databases & Subscription Platforms


