Africa Nematicide Market Size and Share
Market Overview
| Study Period | 2018 - 2031 |
|---|---|
| Forecast Data Period | 2026 - 2031 |
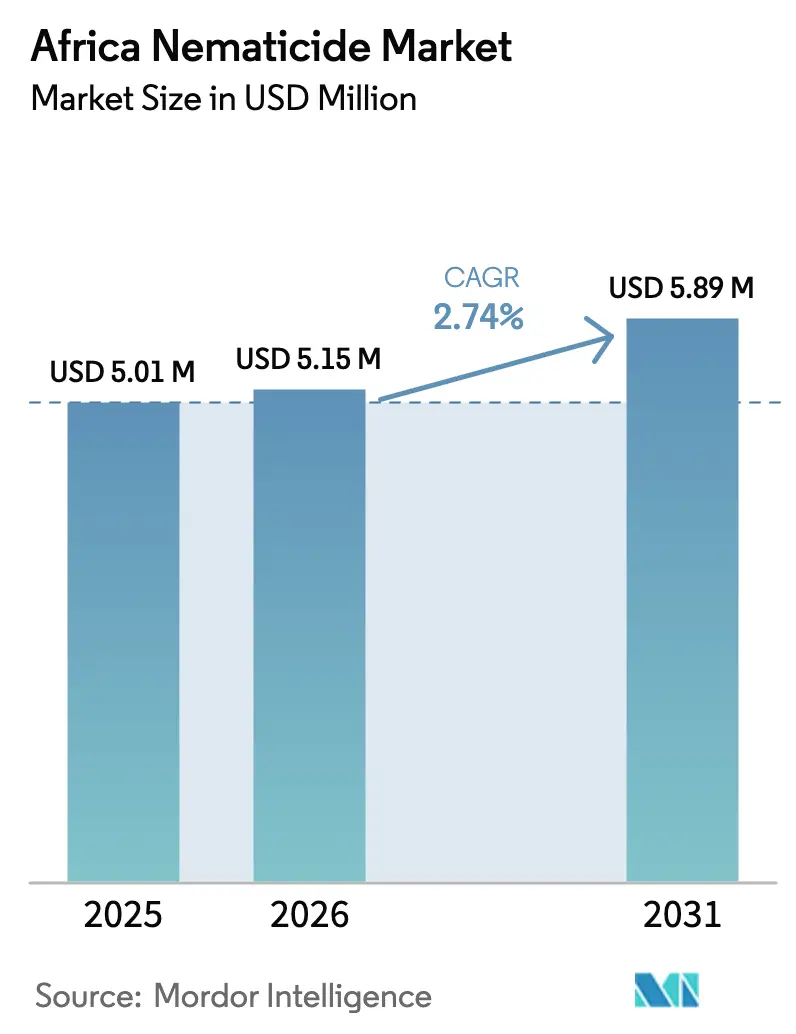
| Base Year Market Size (2025) | USD 5.01 Million |
| Market Size (2026) | USD 5.15 Million |
| Market Size (2031) | USD 5.89 Million |
| Growth Rate (2026 - 2031) | 2.74% CAGR |
| Market Concentration | High |
Major Players *Disclaimer: Major Players sorted in no particular order Image © Mordor Intelligence. Reuse requires attribution under CC BY 4.0. | |
Africa Nematicide Market Analysis by Mordor Intelligence
The Africa nematicide market size was valued at USD 5.01 million in 2025 and estimated to grow from USD 5.15 million in 2026 to reach USD 5.89 million by 2031, at a CAGR of 2.74% during the forecast period (2026-2031). This measured trajectory shows that nematode control remains a niche but indispensable tool for commercial farms that already operate with tight input programs and rigorous export-quality checks. Uptake continues to hinge on a small cluster of large growers that can quantify the financial payback from precision applications, especially where drip chemigation or seed treatment improves root-zone coverage and reduces product waste. Policymakers are gradually tightening rules on carbamate and organophosphate residues, which is nudging producers toward newer synthetics options that carry friendlier safety profiles. Capital-intensive irrigation systems, targeted subsidies, and widening digital-ag partnerships further anchor demand, yet farmer price sensitivity, weak rural logistics, and low awareness among smallholders keep penetration from scaling beyond current commercial strongholds.
Key Report Takeaways
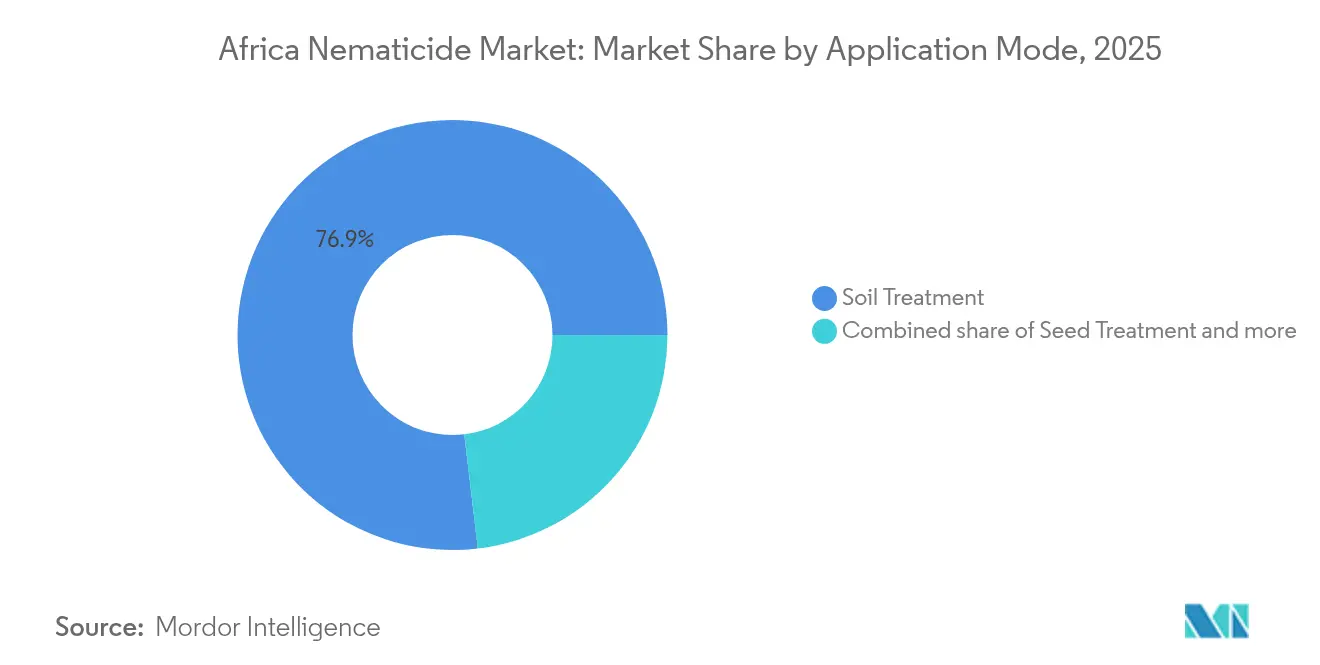
- By mode of application, soil treatment accounted for 76.88% of the Africa nematicide market size in 2025, while seed treatment is the fastest riser, with a 2.87% CAGR through 2031.
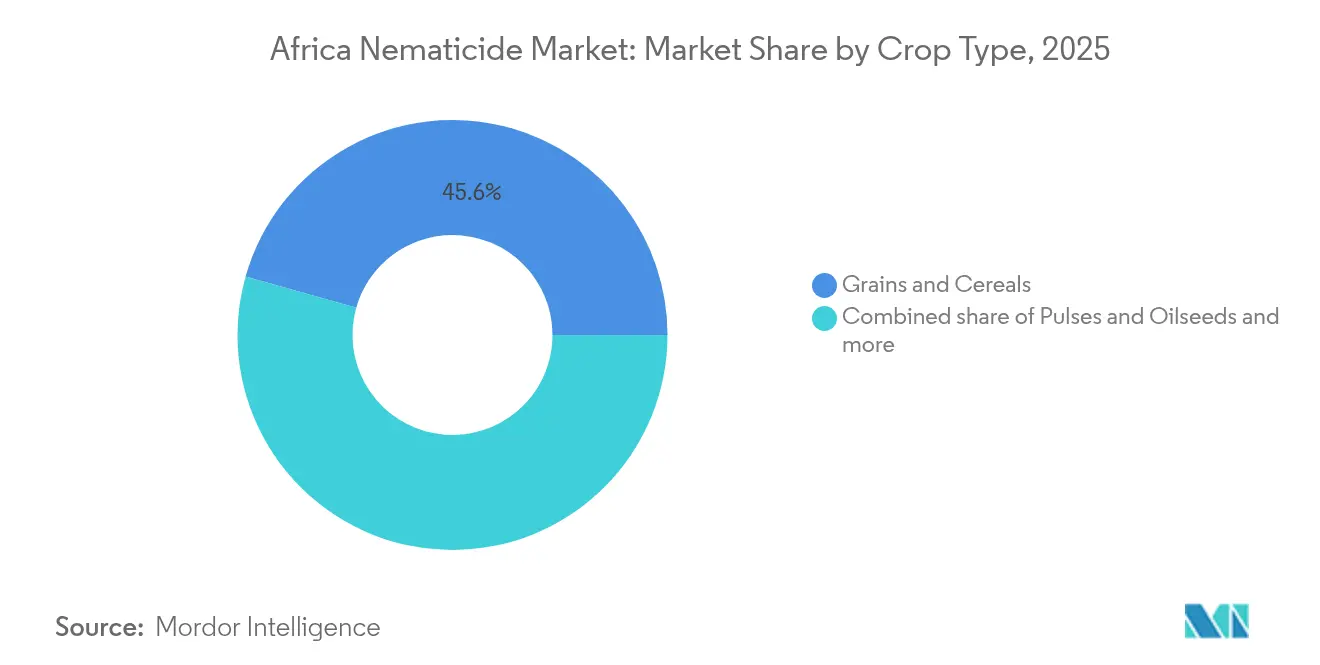
- By crop type, grains and cereals commanded 45.62% revenue in 2025, and Pulses and Oilseeds should expand at a muted 2.85% CAGR to 2031.
- By geography, South Africa held 29.74% of sales in 2025 and is advancing at a 3.62% CAGR, outperforming the continental average.
Note: Market size and forecast figures in this report are generated using Mordor Intelligence’s proprietary estimation framework, updated with the latest available data and insights as of 2026.
Africa Nematicide Market Trends and Insights
Drivers Impact Analysis*
| Driver | (~) % Impact on CAGR Forecast | Geographic Relevance | Impact Timeline |
|---|---|---|---|
| Surge in root-knot nematode infestations across commercial horticulture | +0.4% | South Africa, Kenya, Egypt, Morocco | Medium term (2-4 years) |
| Growing adoption of drip irrigation that enables chemigation efficiency | +0.3% | North Africa, South Africa core, spillover to East Africa | Short term (≤ 2 years) |
| Government subsidy programs for high-value export crops | +0.2% | Morocco, South Africa, Kenya, Egypt | Medium term (2-4 years) |
| Rapid expansion of greenhouse vegetable acreage in North and East Africa | + 0.2% | Morocco, Egypt, Kenya, Tunisia | Long term (≥ 4 years) |
| Increased adoption of systemic nematicides for seed treatment applications | +0.2% | Global, with early adoption in South Africa, Kenya | Long term (≥ 4 years) |
| Precision-ag platform partnerships delivering variable-rate nematicide maps | +0.1% | South Africa, emerging in Kenya and Morocco | Long term (≥ 4 years) |
| Source: Mordor Intelligence | |||


Surge in Root-Knot Nematode Infestations Across Commercial Horticulture
Root-knot species now inflict 30-50% yield losses in tomato and pepper fields under intensive monocropping, as documented by the International Center of Insect Physiology and Ecology [1]Source: International Centre of Insect Physiology and Ecology, “Research Programs,” icipe.org. Because export quality protocols tolerate almost no root galling, large growers have no choice but to integrate season-long chemical rotations with occasional drenches. Climate swings and shorter fallow windows further magnify soil pathogen loads, forcing managers to treat even when visual damage is low. These realities guarantee a steady baseline for the Africa nematicide market, yet the limited number of farms meeting export standards caps absolute volume. The segment, therefore, rewards suppliers that can deliver performance data, residue tracking, and training in integrated pest management, rather than simply selling products.
Growing Adoption of Drip Irrigation That Enables Chemigation Efficiency
Morocco’s Plan Maroc Vert financed thousands of hectares of drip lines, each fitted with fertigation ports that double as chemigation injection points. Field audits show that drip delivery cuts labor outlays almost in half and places actives exactly where nematodes feed, trimming overdosing that once plagued broadcast programs. South African vineyards report 25–30% lower total active usage when they switch from flood methods to chemigation under identical pest pressure. Still, the required capital keeps colonization limited to well-financed farms. Expansion, therefore, runs parallel to irrigation grants or export-linked credit, again concentrating the Africa nematicide market in high-value zones rather than across the entire farming base.
Government Subsidy Programs for High-Value Export Crops
Kenya’s National Agricultural and Rural Inclusive Growth Project reimburses up to 50% of approved pesticide expenditures for certified horticulture exporters, incorporating nematicides into the cost-sharing basket. In July 2025, Morocco allocates a compatible amount to drip and input rebates, which help citrus and greenhouse vegetable growers remain competitive. These fiscal levers mitigate sticker shock for microbial actives, which often cost two to three times more than legacy synthetics. Subsidies are finite and tightly targeted, meaning they increase the African nematicide market value only in select pockets rather than lifting continent-wide demand.
Rapid Expansion of Greenhouse Vegetable Acreage in North and East Africa
Egypt added 15,000 hectares of climate-controlled tunnels in 2024, a move that multiplies nematode cycles because continuous cultivation eliminates natural fallow breaks [2]Source: Kenya Bureau of Standards, “Pest Control Products Board Regulations,” kebs.org. Greenhouse managers rely on clean planting substrates, as well as pre-season soil drenches, and frequently add Bacillus firmus or spirotetramat to drip feed every crop flush. Dutch Kenyan joint ventures in the Rift Valley utilize real-time soil testing to identify infestation hotspots and trigger targeted micro-dose interventions. Although these areas represent a fraction of total arable land, their intensive schedules translate into multiple applications annually, preserving a premium slice of the Africa nematicide market revenue.
Restraints Impact Analysis*
| Restraint | (~) % Impact on CAGR Forecast | Geographic Relevance | Impact Timeline |
|---|---|---|---|
| Rising regulatory bans on carbamate and organophosphate actives | -0.2% | Global, with the strictest enforcement in South Africa, Kenya | Short term (≤ 2 years) |
| Limited cold-chain logistics for nematicide formulations in rural areas | -0.2% | Sub-Saharan Africa, particularly rural smallholder regions | Medium term (2-4 years) |
| Farmer price sensitivity due to currency depreciation and inflation | -0.1% | Nigeria, Ghana, Kenya, Ethiopia, Zambia | Short term (≤ 2 years) |
| Low awareness of sub-clinical nematode yield losses among smallholders | -0.1% | Sub-Saharan Africa smallholder farming systems | Long term (≥ 4 years) |
| Source: Mordor Intelligence | |||
Rising Regulatory Bans on Carbamate and Organophosphate Actives
Kenya delisted 12 organophosphate labels in 2024, forcing growers to search for more expensive replacements or reduce the dosage of existing stocks. South Africa’s authority signals similar restrictions that will phase in over the next 18 months. With a slim roster of Africa-specific alternatives available, temporary product shortages could impact sales before newer chemistries gain local clearance. Over time, these bans favor lower-risk synthetic and microbial lines, near-term disruptions trim volume and temper the African nematicide market expansion. The regulatory transition creates temporary market disruptions as farmers identify suitable alternatives, yet the market's modest size limits investment in developing replacement products specifically for African applications.
Farmer Price Sensitivity Due to Currency Depreciation and Inflation
Macroeconomic instability across multiple African economies reduces farmer purchasing power for premium pest management inputs, creating downward pressure on nematicide demand as producers prioritize essential inputs like seeds and fertilizers over specialized pest control products. Currency depreciation in Nigeria, Ghana, and Kenya during 2024 increased import costs for active ingredients by 15-25%, forcing local formulators to raise retail prices at a time when farmer incomes remain constrained by commodity price volatility. This price sensitivity particularly affects adoption of nematicides that typically cost 2-3 times more than synthetic alternatives, despite offering longer-term soil health benefits. Smallholder farmers operating on narrow profit margins often delay or skip nematicide applications entirely when faced with input cost increases, accepting yield losses rather than investing in pest management.
*Our forecasts treat driver/restraint impacts as directional, not additive. The impact forecasts reflect baseline growth, mix effects, and variable interactions.
Segment Analysis
By Mode of Application: Soil Treatment Maintains Traditional Dominance
Soil treatment applications commanded 76.88% market share in 2025, reflecting established incorporation methods that provide comprehensive soil coverage for nematode control in commercial grain and specialty crop production systems. The preference for soil treatment stems from its ability to directly target nematodes in their primary habitat the soil, where they pose the greatest threat to crop root systems. When nematicides are applied to the soil, losses due to photolysis are minimal compared to other application methods, making it a more efficient choice. Additionally, soil treatment provides better protection for beneficial insects and pollinators, as the nematicides remain primarily in the soil where target pests reside, reducing exposure to non-target organisms.
Seed treatment methods are anticipated to exhibit emerging growth potential at a 2.87% CAGR through 2031, driven by the development of systemic chemistry that enables early-season protection during vulnerable plant establishment phases. The method creates a protective barrier around seedling roots during their most vulnerable growth phases, offering crucial defense against nematode attacks. Farmers are increasingly adopting this preventive approach as it requires lower chemical volumes compared to other application methods and provides targeted protection exactly where it's needed most. The rising awareness about the benefits of treated seeds, coupled with technological advancements in seed treatment formulations, is further accelerating the segment's growth in the region.


By Crop Type: Grains and Cereals Lead Commercial Applications
Grains and cereals dominated the market, accounting for a 45.62% market share in 2025, reflecting established nematode management protocols in commercial grain production systems, where pest control is an integral part of integrated crop management programs. In South Africa alone, cereal production has reached substantial volumes, with maize being the primary cereal crop. The prevalence of nematode infestations in cereal crops often results in decreased yields, stunted growth, and compromised root systems, making the application of nematicides crucial for maintaining productivity and ensuring food security across the region.
Pulses and oilseeds exhibit a 2.85% CAGR growth through 2031, gaining recognition as rotation crops that benefit from targeted nematode management to optimize soil health and productivity in intensive farming systems. The segment's robust growth is attributed to rising awareness among farmers about nematode-related crop damage and the critical need for effective pest management solutions. The expansion of cultivated land for pulses and oilseeds, coupled with an increase in nematode infestations, particularly during favorable weather conditions, has intensified the demand for nematicide products in this segment.
Geography Analysis
South Africa represents 29.74% of the Africa nematicide market in 2025 and exhibits the fastest regional growth at 3.62% CAGR through 2031, driven by commercial farming operations that employ advanced pest management protocols across grain, wine grape, and citrus production systems. The country's adoption of precision agriculture enables variable-rate nematicide applications, optimizing input efficiency while maintaining the export quality standards required for international market access.
The rest of Africa encompasses diverse markets with varying levels of agricultural development and regulatory frameworks, characterized by slower growth rates that reflect infrastructure constraints and economic limitations. Kenya leads East African demand through commercial flower production and specialized horticultural systems that require intensive nematode management to maintain export quality. Regulatory frameworks align with international standards, facilitating access to innovative chemistry products that face registration barriers in other African markets.
Morocco drives North African applications through citrus and vegetable production targeting European markets, while Egypt's protected cultivation systems create concentrated demand in the Nile Delta region. Nigeria's large agricultural sector offers potential yet faces infrastructure constraints and economic instability that limit commercial nematicide adoption beyond established operations.
Competitive Landscape
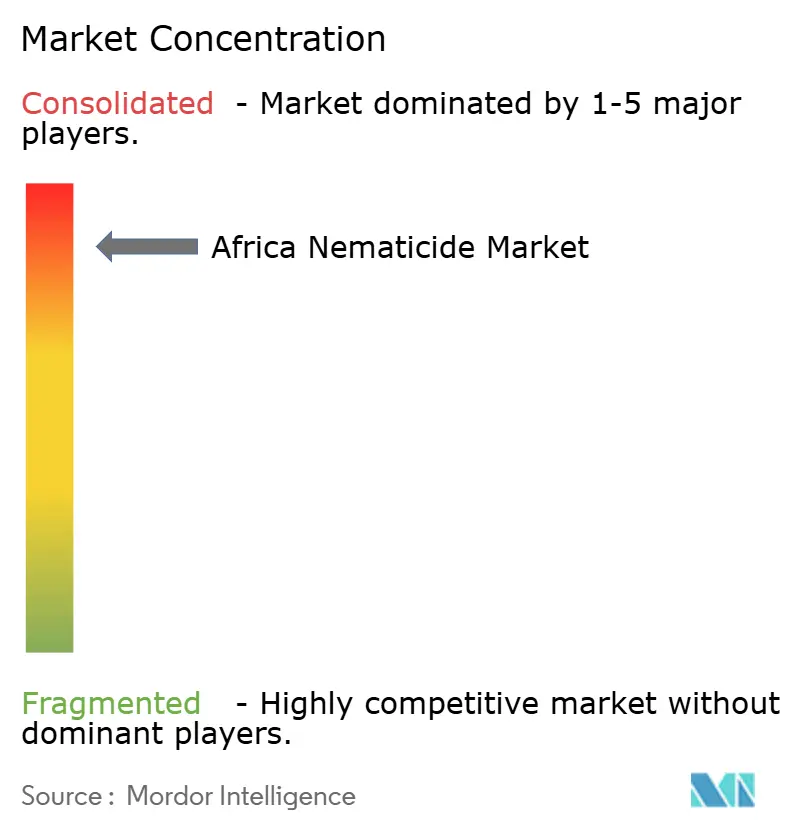
The African nematicide market demonstrates a high level of consolidation, with global agrochemical conglomerates dominating the competitive landscape. Syngenta Group, UPL Limited, Bayer AG, FMC Corporation, and BASF SE are multinational companies that leverage their extensive research capabilities, established distribution networks, and strong financial resources to maintain their market positions. The market structure is characterized by significant barriers to entry, primarily due to the high costs associated with product development, registration requirements, and the need for extensive distribution networks. Recent years have witnessed several strategic mergers and acquisitions, particularly among global players seeking to strengthen their presence in the African market and expand their product offerings.
Local players face considerable challenges in competing with global giants, although some have established strong regional presences through specialized product offerings and a deep understanding of local agricultural needs. The market shows a trend towards strategic partnerships between global and local players, combining international expertise with local market knowledge. Companies are increasingly focusing on developing region-specific solutions and building strong relationships with local farming communities. The competitive dynamics are further influenced by the growing importance of sustainable agriculture practices and the need for environmentally friendly solutions.
Technology deployment increasingly determines competitive success as precision agriculture adoption enables data-driven application protocols that demonstrate economic returns to commercial customers, yet high infrastructure requirements limit technology adoption to established operations with sufficient scale. In January 2025, Bayer's partnership with Ecospray for garlic-derived nematicide Velsinum exemplifies strategic investment in naturally-derived chemistry that addresses regulatory restrictions while providing novel modes of action [3]Source: Bayer AG, “Crop Science Innovation Pipeline,” bayer.com.
Africa Nematicide Industry Leaders
Syngenta Group
UPL Limited
Bayer AG
FMC Corporation
BASF SE
- *Disclaimer: Major Players sorted in no particular order

Recent Industry Developments
- May 2024: Syngenta introduced TYMIRIUM technology, a new nematicide, to revolutionize the future of agriculture in Zambia. TYMIRIUM technology provides unprecedented, long-lasting protection against a broad spectrum of plant parasitic nematodes under two brand formulations: VANIVA for Potatoes and Tobacco, Applied via in-furrow and drench applications, respectively, and VICTRATO for wheat, soybeans, and Maize, Applied via seed treatment.
- January 2023: Bayer formed a new partnership with Oerth to enhance crop protection technology and create more eco-friendly crop protection solutions, including nematicide.
- May 2022: Syngenta Group has received regulatory approval in Kenya for Victrato seed treatment, containing the cyclobutrifluram active ingredient, which provides systemic nematode protection for high-value horticultural crops. The approval represents the expansion of seed treatment options in East African commercial markets.


Africa Nematicide Market Report Scope
Chemigation, Foliar, Fumigation, Seed Treatment, Soil Treatment are covered as segments by Application Mode. Commercial Crops, Fruits & Vegetables, Grains & Cereals, Pulses & Oilseeds, Turf & Ornamental are covered as segments by Crop Type. South Africa are covered as segments by Country.| Chemigation |
| Foliar |
| Fumigation |
| Seed Treatment |
| Soil Treatment |
| Commercial Crops |
| Fruits and Vegetables |
| Grains and Cereals |
| Pulses and Oilseeds |
| Turf and Ornamental |
| South Africa |
| Rest of Africa |
| Application Mode | Chemigation |
| Foliar | |
| Fumigation | |
| Seed Treatment | |
| Soil Treatment | |
| Crop Type | Commercial Crops |
| Fruits and Vegetables | |
| Grains and Cereals | |
| Pulses and Oilseeds | |
| Turf and Ornamental | |
| Geography | South Africa |
| Rest of Africa |


Market Definition
- Function - Nematicides are chemicals used to control or prevent nematodes from damaging the crop and prevent yield loss.
- Application Mode - Foliar, Seed Treatment, Soil Treatment, Chemigation, and Fumigation are the different type of application modes through which crop protection chemicals are applied to the crops.
- Crop Type - This represents the consumption of crop protection chemicals by Cereals, Pulses, Oilseeds, Fruits, Vegetables, Turf, and Ornamental crops.
| Keyword | Definition |
|---|---|
| IWM | Integrated weed management (IWM) is an approach to incorporate multiple weed control techniques throughout the growing season to give producers the best opportunity to control problematic weeds. |
| Host | Hosts are the plants that form relationships with beneficial microorganisms and help them colonize. |
| Pathogen | A disease-causing organism. |
| Herbigation | Herbigation is an effective method of applying herbicides through irrigation systems. |
| Maximum residue levels (MRL) | Maximum Residue Limit (MRL) is the maximum allowed limit of pesticide residue in food or feed obtained from plants and animals. |
| IoT | The Internet of Things (IoT) is a network of interconnected devices that connect and exchange data with other IoT devices and the cloud. |
| Herbicide-tolerant varieties (HTVs) | Herbicide-tolerant varieties are plant species that have been genetically engineered to be resistant to herbicides used on crops. |
| Chemigation | Chemigation is a method of applying pesticides to crops through an irrigation system. |
| Crop Protection | Crop protection is a method of protecting crop yields from different pests, including insects, weeds, plant diseases, and others that cause damage to agricultural crops. |
| Seed Treatment | Seed treatment helps to disinfect seeds or seedlings from seed-borne or soil-borne pests. Crop protection chemicals, such as fungicides, insecticides, or nematicides, are commonly used for seed treatment. |
| Fumigation | Fumigation is the application of crop protection chemicals in gaseous form to control pests. |
| Bait | A bait is a food or other material used to lure a pest and kill it through various methods, including poisoning. |
| Contact Fungicide | Contact pesticides prevent crop contamination and combat fungal pathogens. They act on pests (fungi) only when they come in contact with the pests. |
| Systemic Fungicide | A systemic fungicide is a compound taken up by a plant and then translocated within the plant, thus protecting the plant from attack by pathogens. |
| Mass Drug Administration (MDA) | Mass drug administration is the strategy to control or eliminate many neglected tropical diseases. |
| Mollusks | Mollusks are pests that feed on crops, causing crop damage and yield loss. Mollusks include octopi, squid, snails, and slugs. |
| Pre-emergence Herbicide | Preemergence herbicides are a form of chemical weed control that prevents germinated weed seedlings from becoming established. |
| Post-emergence Herbicide | Postemergence herbicides are applied to the agricultural field to control weeds after emergence (germination) of seeds or seedlings. |
| Active Ingredients | Active ingredients are the chemicals in pesticide products that kill, control, or repel pests. |
| United States Department of Agriculture (USDA) | The Department of Agriculture provides leadership on food, agriculture, natural resources, and related issues. |
| Weed Science Society of America (WSSA) | The WSSA, a non-profit professional society, promotes research, education, and extension outreach activities related to weeds. |
| Suspension concentrate | Suspension concentrate (SC) is one of the formulations of crop protection chemicals with solid active ingredients dispersed in water. |
| Wettable powder | A wettable powder (WP) is a powder formulation that forms a suspension when mixed with water prior to spraying. |
| Emulsifiable concentrate | Emulsifiable concentrate (EC) is a concentrated liquid formulation of pesticide that needs to be diluted with water to create a spray solution. |
| Plant-parasitic nematodes | Parasitic Nematodes feed on the roots of crops, causing damage to the roots. These damages allow for easy plant infestation by soil-borne pathogens, which results in crop or yield loss. |
| Australian Weeds Strategy (AWS) | The Australian Weeds Strategy, owned by the Environment and Invasives Committee, provides national guidance on weed management. |
| Weed Science Society of Japan (WSSJ) | WSSJ aims to contribute to the prevention of weed damage and the utilization of weed value by providing the chance for research presentation and information exchange. |


Research Methodology
Mordor Intelligence follows a four-step methodology in all our reports.
- Step-1: Identify Key Variables: In order to build a robust forecasting methodology, the variables and factors identified in Step-1 are tested against available historical market numbers. Through an iterative process, the variables required for market forecast are set and the model is built on the basis of these variables.
- Step-2: Build a Market Model: Market-size estimations for the forecast years are in nominal terms. Inflation is not a part of the pricing, and the average selling price (ASP) is kept constant throughout the forecast period.
- Step-3: Validate and Finalize: In this important step, all market numbers, variables and analyst calls are validated through an extensive network of primary research experts from the market studied. The respondents are selected across levels and functions to generate a holistic picture of the market studied.
- Step-4: Research Outputs: Syndicated Reports, Custom Consulting Assignments, Databases & Subscription Platforms


