Market Overview
| Study Period | 2018 - 2031 |
|---|---|
| Forecast Data Period | 2026 - 2031 |
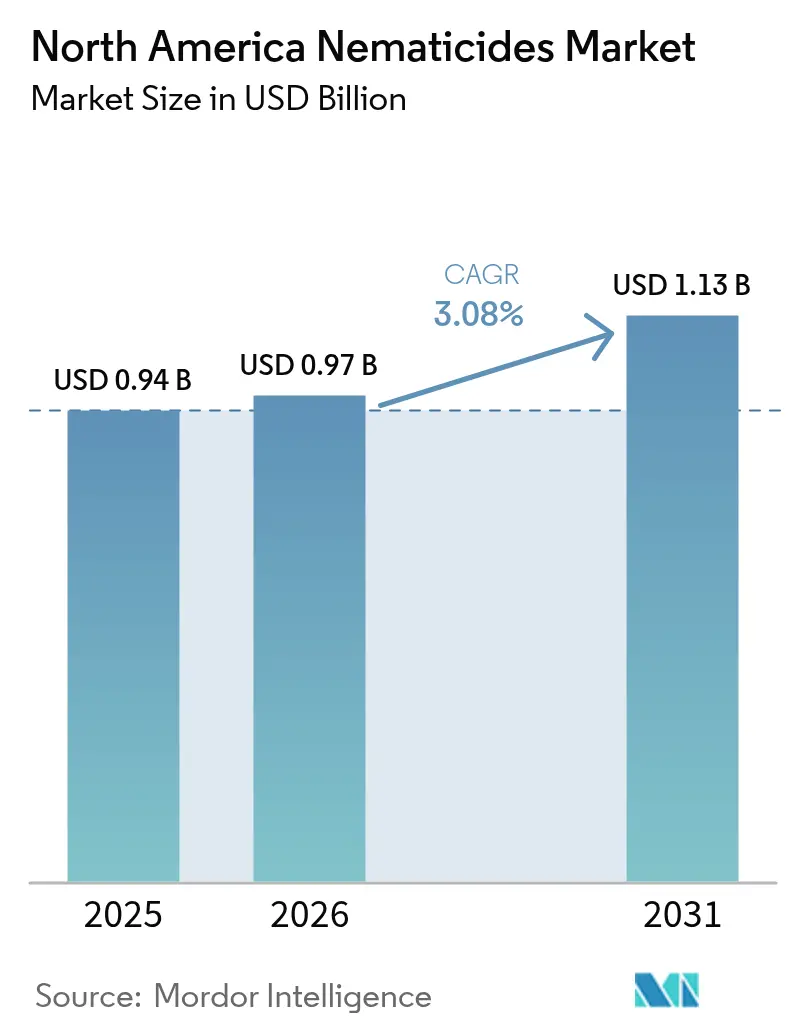
| Base Year Market Size (2025) | USD 0.94 Billion |
| Market Size (2026) | USD 0.97 Billion |
| Market Size (2031) | USD 1.13 Billion |
| Growth Rate (2026 - 2031) | 3.08% CAGR |
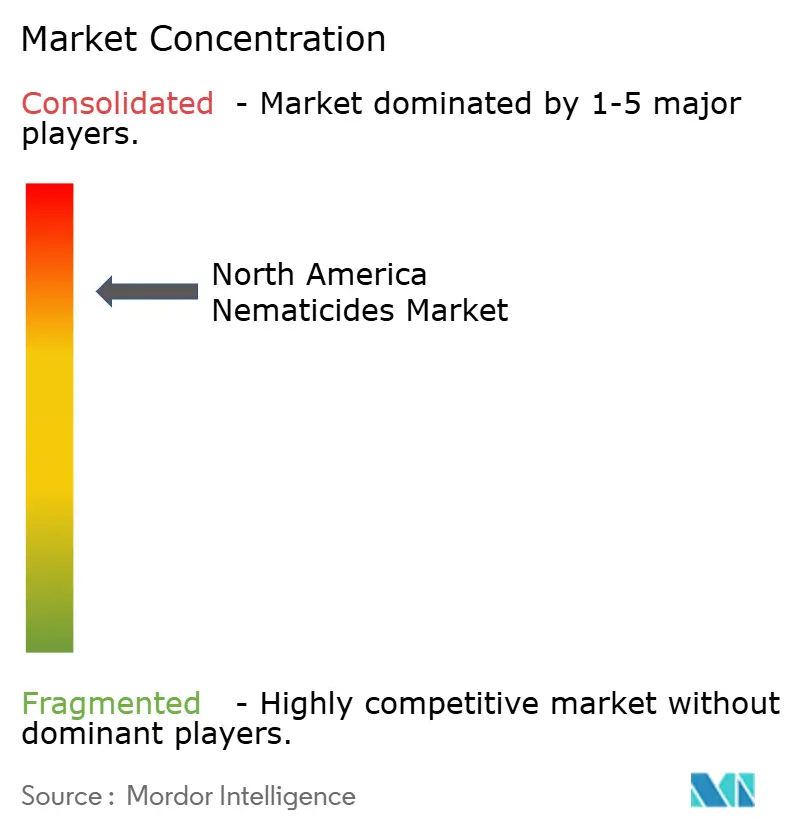
| Market Concentration | High |
Major Players *Disclaimer: Major Players sorted in no particular order Image © Mordor Intelligence. Reuse requires attribution under CC BY 4.0. | |
North America Nematicides Market Analysis by Mordor Intelligence
North America nematicides market size in 2026 is estimated at USD 0.97 billion, growing from 2025 value of USD 0.94 billion with 2031 projections showing USD 1.13 billion, growing at 3.08% CAGR over 2026-2031. Growth stems from a calculated pivot toward safer chemical actives following the phase-out of broad-spectrum fumigants, alongside EPA label extensions that continue to unlock previously untapped acres in both row and specialty crops. Continuous corn–soybean rotations across the Midwest maintain nematode populations well above economic thresholds, underscoring year-round demand for soil-applied solutions, even as seed treatments capture early-season pressure. Added momentum comes from a projected seven-million-acre jump in grains and cereals, tighter buffer-zone rules that push mid-sized farms away from fumigation and into low-toxicity alternatives, and controlled-environment facilities that rely on drip-delivered chemistries compatible with enclosed-space safety standards. The North America nematicides market also benefits from precision application technologies that reduce waste while confirming the yield-protection value of modern active ingredients.
Key Report Takeaways
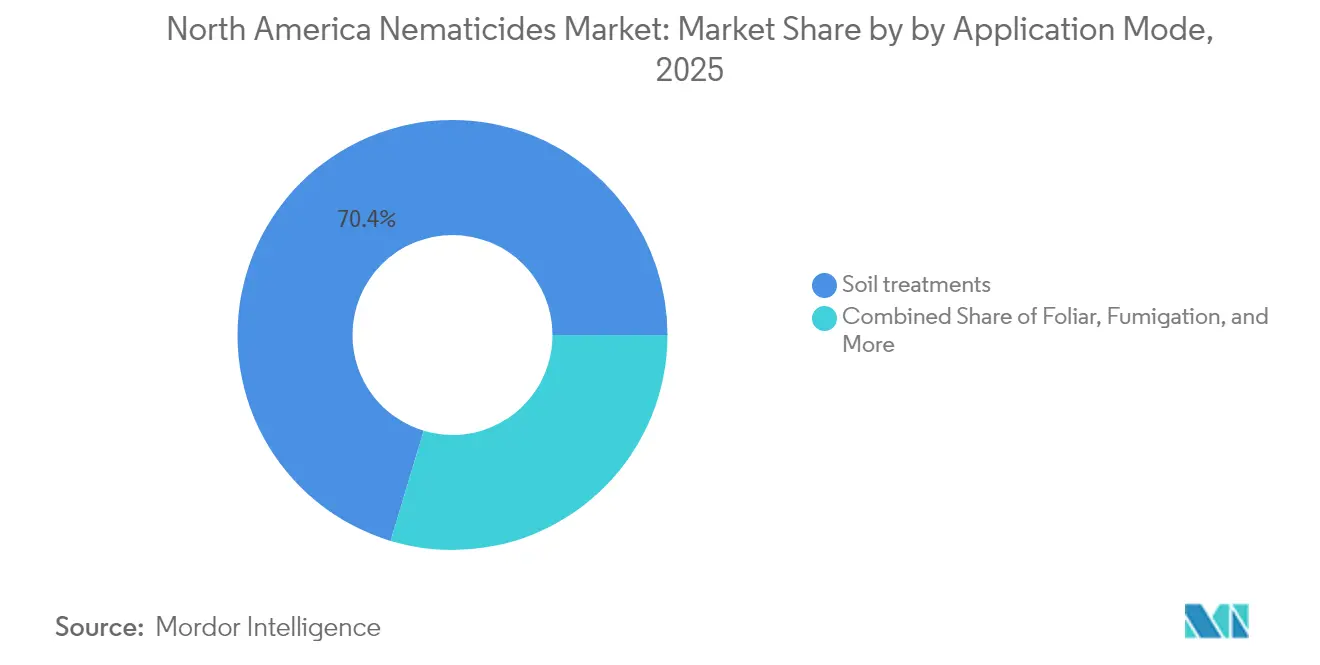
- By application mode, soil treatment held 70.35% of the North America nematicides market share in 2025, whereas seed treatment is projected to post the fastest 3.82% CAGR through 2031.
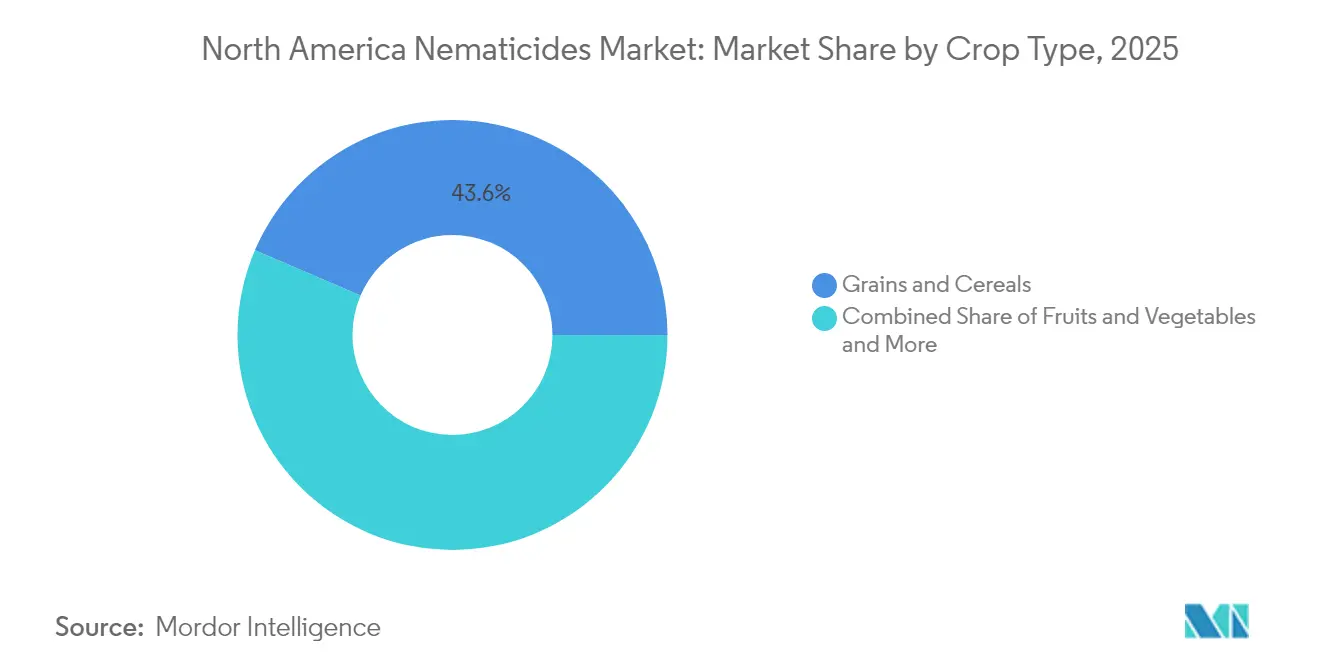
- By crop type, grains and cereals accounted for 43.55% of the North America nematicides market size in 2025 and are anticipated to grow at a 3.19% CAGR to 2031.
- By geography, the United States dominated with a 75.70% revenue share in 2025, while Mexico is set to record the highest 3.92% CAGR.
Note: Market size and forecast figures in this report are generated using Mordor Intelligence’s proprietary estimation framework, updated with the latest available data and insights as of 2026.
North America Nematicides Market Trends and Insights
Drivers Impact Analysis*
| Driver | (~) % Impact on CAGR Forecast | Geographic Relevance | Impact Timeline |
|---|---|---|---|
| Increasing nematode infestation due to intensive monocropping | +0.8% | United States, Canada | Medium term (2–4 years) |
| Expansion of grain and cereal acreage in North America | +0.5% | United States, Canada | Short term (≤ 2 years) |
| Replacement demand after phase-out of broad-spectrum fumigants | +0.5% | United States, Canada | Medium term (2–4 years) |
| Cover-crop termination challenges boosting seed-applied chemical nematicides | +0.4% | United States, Canada, Mexico | Medium term (2–4 years) |
| Controlled-environment agriculture expansion driving high-value crop protection | +0.3% | United States, Canada | Medium term (2–4 years) |
| Label expansion of safer chemical actives (fluopyram, fluensulfone) across row and specialty crops | +0.2% | United States, Canada | Long term (≥ 4 years) |
| Source: Mordor Intelligence | |||
Increasing Nematode Infestation Due to Intensive Monocropping
Continuous corn and soybean cycles across the Corn Belt let soybean cyst nematode levels multiply tenfold in only three seasons, pushing growers toward annual prophylactic soil treatments that replace threshold-based sprays[1]Source: National Institute of Food and Agriculture, “Light-Responsive Hydrogel for Controlled Nematicide Delivery,” NIFA.USDA.GOV. The insurance value of nematicides rises because land values exceed USD 10,000 per acre in prime zones, leaving no margin for stand loss. Crop insurance incentives reward programs, which encourage crop acreage diversification, are falling as operators chase equipment efficiency. That structural choice removes the natural pest-break effect that once suppressed nematodes below economic injury levels. Precision sampling now pinpoints hotspots and supports per-acre treatment rates, anchoring long-term demand within the North America nematicides market.
Expansion of Grain and Cereal Acreage in North America
United States Department of Agriculture baselines add seven million grain and cereal acres by 2030, channeling new plantings into Great Plains soils that initially hold low nematode loads yet swiftly reach damaging levels once host crops arrive. Variable-rate spreaders and planter-box dosing systems apply chemistries precisely where soil assays indicate risk, which reduces treatment intensity while minimizing waste. Land-conversion costs of around USD 500 per acre motivate growers to protect their first-year yields, making nematicides a default budget line. Dealer route density improves as new territory abuts the existing Corn Belt, ensuring prompt access to actives and technical support. These intertwined agronomic and commercial factors intensify the demand for North American nematicides.
Replacement Demand After Phase-out of Broad-Spectrum Fumigants
Environmental Protection Agency (EPA) cancellations of methyl bromide and tighter worker-safety rules on other fumigants accelerated the adoption of fluopyram, fluensulfone, and proposed cyclobutrifluram, each offering season-long control without the need for closed-loading hardware[2]Source: U.S. Environmental Protection Agency, “EPA Announces Proposed Registration of New Active Ingredient Cyclobutrifluram,” EPA.GOV. Grain producers facing fumigation costs exceeding USD 200 per acre are now turning to granular or seed-applied alternatives that require no respirators or buffer-zone mapping. Turf and ornamental operators follow suit because new actives carry shorter re-entry intervals that fit intensive maintenance schedules. By removing labor bottlenecks and lowering compliance risk, these replacements keep the North America nematicides market on a steady ascent even as total fumigant gallons fall.
Label Expansion of Safer Chemical Actives (fluopyram, fluensulfone) Across row and Specialty Crops
Fluopyram’s 2024 label extension opened roughly two million acres of corn and soybeans to an active use previously limited to high-value horticulture. Similar expansions for fluensulfone have widened use in berries, carrots, and leafy greens, where fumigation logistics once deterred treatment. Bundled sales strategies enable suppliers to package nematicides with fungicides in integrated programs, thereby increasing total value per acre. Adoption curves run faster than for legacy fumigants because growers face no need for specialized rigs or costly personal protective gear. As more crops receive approvals, the North America nematicides market gains fresh acreage without the decade-long wait tied to brand-new molecules.
Restraints Impact Analysis*
| Restraint | (~) % Impact on CAGR Forecast | Geographic Relevance | Impact Timeline |
|---|---|---|---|
| Stringent EPA regulatory hurdles and compliance costs | -0.5% | United States | Medium term (2–4 years) |
| Consumer demand for residue-free produce limiting chemical use rates | -0.3% | United States, Canada | Long term (≥ 4 years) |
| Adoption of resistant crop varieties for soybean-cyst nematode management | -0.3% | United States, Canada, Mexico | Medium term (2–4 years) |
| High cost of soil-fumigation equipment and personal-protective gear for small growers | -0.2% | United States, Canada | Long term (≥ 4 years) |
| Source: Mordor Intelligence | |||
Stringent EPA Regulatory Hurdles and Compliance Costs
A new active ingredient requires over eight years in data packages before EPA approval, deterring mid-sized innovators and protecting incumbents that can amortize costs across their global portfolios. Endangered-species modeling, water-quality monitoring, and worker-exposure studies introduce uncertainty into timelines, so many firms focus on label expansions rather than novel molecules. The pending 2026 Pesticide General Permit adds discharge-reporting duties for chemistries near water bodies, inflating stewardship outlays for applicators. These factors temper the long-term growth ceiling for the North America nematicides market, yet also fortify oligopolistic share patterns.
Consumer Demand for Residue-Free Produce Limiting Chemical Use Rates
Retail scorecards now publish suppliers’ pesticide-reduction metrics, so vegetable and fruit growers face premium penalties if assays exceed tight maximum residues. Organic acreage continues to climb, and certification blocks most synthetic nematicides, prompting producers to adopt lower-rate programs or non-chemical tactics, such as soil steaming. Even conventional operations adjust application windows to allow longer pre-harvest intervals and avoid load rejection. While grains remain less affected, specialty crop volume can decline where residue-driven marketing claims influence shelf-space decisions. Over time, the North America nematicides market must balance efficacy requirements with escalating retailer standards.
*Our forecasts treat driver/restraint impacts as directional, not additive. The impact forecasts reflect baseline growth, mix effects, and variable interactions.
Segment Analysis
By Application Mode: Soil Treatment Anchors Market Foundation
Soil treatments captured 70.35% of 2025 revenue because economically significant nematodes live in the root zone, where direct placement maximizes exposure. The North America nematicides market share stays high as growers rely on granular incorporations and in-furrow sprays that protect stand establishment. Cyclobutrifluram’s pending approval reinforces confidence in soil applications thanks to EPA assessments that favor incorporated chemistries over foliar counterparts for non-target safety. Precision variable-rate rigs now adjust dose within a single pass, improving efficacy while trimming surplus.
Seed treatment is the momentum leader posting the fastest 3.82% CAGR through 2031, as convenience and early-season insurance outweigh premium costs. Large farms utilize seed-box recipes that combine nematicides, fungicides, and insecticides in a single workflow. Chemigation wins the greenhouse share because uniform flow and automated fertigation reduce labor, although capital costs limit open-field adoption. Foliar routes remain niche, targeting select root-feeding species where translocation delivers actives to the rhizosphere. Fumigation continues to decline alongside stricter buffer-zone and respirator mandates, which inflate per-acre costs.


By Crop Type: Grain Systems Drive Chemical Demand
Grains and cereals represented 43.55% of 2025 consumption, making them pivotal to the North America nematicides market size. The segment will outpace the headline 3.08% CAGR during the forecast period, driven by corn-soybean monocultures that leave fields without fallow breaks. Yields of 5-15% under untreated nematode pressure justify treatment, even in thin-margin years.
Fruits and vegetables command premium pricing yet face tough residue limits, so growers lean on low-toxicity actives and strict pre-harvest intervals. Cotton and other commercial crops exhibit steady uptake because planting density and irrigation practices maintain robust nematode populations. Pulses and oilseeds, riding plant-protein demand, add incremental acres yet still lack many labeled chemistries, suggesting future upside as suppliers pursue new approvals. Turf and ornamentals maintain a small but stable slice, driven by golf-course aesthetics and sports-turf playability standards.
Geography Analysis
The United States dominated the North America nematicides market with a 75.70% share in 2025. Intensive rotations and high commodity values underwrite consistent chemical budgets, while established dealer networks assure product access even in remote counties. EPA support for low-toxicity actives, as demonstrated by the cyclobutrifluram proposal, fuels a robust pipeline, even as older labels are phased out.
Mexico, poised for a 3.92% CAGR, benefits from greenhouse expansions near Bajío and Sinaloa that supply off-season vegetables to North American retailers. Government credit lines and modernization grants fund irrigation and fertigation systems that integrate chemigation nematicides. USMCA ensures quick cross-border access to U.S.-registered active ingredients, thereby shortening launch lags.
Canada’s prairie grains and Ontario greenhouse clusters drive demand shaped by shorter seasons and region-specific pest complexes. Fast-acting seed treatments dominate because cool soils limit early root growth, making seedlings vulnerable to even moderate nematode densities. Controlled-environment builds in British Columbia add drip-line formulations to the growth mix.
Competitive Landscape
Market concentration of the North America Nematicide Market remains high. Corteva leads the North America nematicides market by pairing patented active ingredients with a seed portfolio that places its chemistries directly on the acre well before competitive products enter the purchase window. Long-term supply contracts with national retailers lock in shelf space, while an enterprise-wide data platform funnels field-level diagnostics into prescription maps that recommend Corteva actives as the default solution. The company allocates a double-digit share of annual revenue to chemistry discovery and formulation upgrades, a level of spend that smaller rivals cannot match, and routinely files for label expansions that keep legacy molecules relevant across more crops and application modes[3]Source: Pest Management Science, Peter Maienfisch, “Recent Innovations in Crop Protection Research,” DOI.ORG.
Bayer secures the second-largest position through a fluopyram-centered portfolio that serves both seed-treatment and in-furrow markets, providing dealers with flexible placement options when agronomic conditions or equipment limitations preclude the use of one method. The company has layered proprietary formulation technology onto its core active to extend soil residence time, an edge that reduces pass-through costs for growers in high-pressure zones. Bayer also leverages an established seed brand network to bundle nematicide offers with hybrids, a tactic that protects volume even during soft commodity cycles.
Syngenta, BASF, and AMVAC round out the top tier and plan to widen their collective footprint through targeted chemistry launches, digital decision-support tools, and regional production upgrades. Syngenta integrates its Cropwise analytics with Nema Digital sampling to guide variable-rate applications, improving product performance while reducing per-acre costs for growers. BASF focuses on succinate dehydrogenase inhibitor candidates that promise multi-week persistence without fumigation logistics, while AMVAC channels capital into micro-encapsulation and closed-system delivery to meet forthcoming discharge rules. Collectively, these three companies aim to secure incremental share by pairing label expansion campaigns with precision hardware rollouts that simplify compliance under the 2026 Pesticide General Permit.
North America Nematicides Industry Leaders
ADAMA Agricultural Solutions Ltd
Bayer AG
Corteva Agriscience
Syngenta Group
Upl Limited
- *Disclaimer: Major Players sorted in no particular order

Recent Industry Developments
- November 2024: Nutrien Ag Solutions acquired Suncor’s AgroScience unit, adding over 80 crop-protection patents to its Loveland Products line. This acquisition is anticipated to strengthen the development of the North America nematicides market by enhancing product offerings and innovation.
- June 2022: Plant Health Care submitted an EPA application for PHC 68949, a novel biopesticide with nematicidal activity. This development is projected to contribute to the growth of the nematicides market in North America by introducing innovative solutions for pest management.


North America Nematicides Market Report Scope
Chemigation, Foliar, Fumigation, Seed Treatment, Soil Treatment are covered as segments by Application Mode. Commercial Crops, Fruits & Vegetables, Grains & Cereals, Pulses & Oilseeds, Turf & Ornamental are covered as segments by Crop Type. Canada, Mexico, United States are covered as segments by Country.Application Mode
| Chemigation |
| Foliar |
| Fumigation |
| Seed Treatment |
| Soil Treatment |
Crop Type
| Commercial Crops |
| Fruits and Vegetables |
| Grains and Cereals |
| Pulses and Oilseeds |
| Turf and Ornamental |
Geography
| Canada |
| Mexico |
| United States |
| Rest of North America |
| Application Mode | Chemigation |
| Foliar | |
| Fumigation | |
| Seed Treatment | |
| Soil Treatment | |
| Crop Type | Commercial Crops |
| Fruits and Vegetables | |
| Grains and Cereals | |
| Pulses and Oilseeds | |
| Turf and Ornamental | |
| Geography | Canada |
| Mexico | |
| United States | |
| Rest of North America |


Market Definition
- Function - Nematicides are chemicals used to control or prevent nematodes from damaging the crop and prevent yield loss.
- Application Mode - Foliar, Seed Treatment, Soil Treatment, Chemigation, and Fumigation are the different type of application modes through which crop protection chemicals are applied to the crops.
- Crop Type - This represents the consumption of crop protection chemicals by Cereals, Pulses, Oilseeds, Fruits, Vegetables, Turf, and Ornamental crops.
| Keyword | Definition |
|---|---|
| IWM | Integrated weed management (IWM) is an approach to incorporate multiple weed control techniques throughout the growing season to give producers the best opportunity to control problematic weeds. |
| Host | Hosts are the plants that form relationships with beneficial microorganisms and help them colonize. |
| Pathogen | A disease-causing organism. |
| Herbigation | Herbigation is an effective method of applying herbicides through irrigation systems. |
| Maximum residue levels (MRL) | Maximum Residue Limit (MRL) is the maximum allowed limit of pesticide residue in food or feed obtained from plants and animals. |
| IoT | The Internet of Things (IoT) is a network of interconnected devices that connect and exchange data with other IoT devices and the cloud. |
| Herbicide-tolerant varieties (HTVs) | Herbicide-tolerant varieties are plant species that have been genetically engineered to be resistant to herbicides used on crops. |
| Chemigation | Chemigation is a method of applying pesticides to crops through an irrigation system. |
| Crop Protection | Crop protection is a method of protecting crop yields from different pests, including insects, weeds, plant diseases, and others that cause damage to agricultural crops. |
| Seed Treatment | Seed treatment helps to disinfect seeds or seedlings from seed-borne or soil-borne pests. Crop protection chemicals, such as fungicides, insecticides, or nematicides, are commonly used for seed treatment. |
| Fumigation | Fumigation is the application of crop protection chemicals in gaseous form to control pests. |
| Bait | A bait is a food or other material used to lure a pest and kill it through various methods, including poisoning. |
| Contact Fungicide | Contact pesticides prevent crop contamination and combat fungal pathogens. They act on pests (fungi) only when they come in contact with the pests. |
| Systemic Fungicide | A systemic fungicide is a compound taken up by a plant and then translocated within the plant, thus protecting the plant from attack by pathogens. |
| Mass Drug Administration (MDA) | Mass drug administration is the strategy to control or eliminate many neglected tropical diseases. |
| Mollusks | Mollusks are pests that feed on crops, causing crop damage and yield loss. Mollusks include octopi, squid, snails, and slugs. |
| Pre-emergence Herbicide | Preemergence herbicides are a form of chemical weed control that prevents germinated weed seedlings from becoming established. |
| Post-emergence Herbicide | Postemergence herbicides are applied to the agricultural field to control weeds after emergence (germination) of seeds or seedlings. |
| Active Ingredients | Active ingredients are the chemicals in pesticide products that kill, control, or repel pests. |
| United States Department of Agriculture (USDA) | The Department of Agriculture provides leadership on food, agriculture, natural resources, and related issues. |
| Weed Science Society of America (WSSA) | The WSSA, a non-profit professional society, promotes research, education, and extension outreach activities related to weeds. |
| Suspension concentrate | Suspension concentrate (SC) is one of the formulations of crop protection chemicals with solid active ingredients dispersed in water. |
| Wettable powder | A wettable powder (WP) is a powder formulation that forms a suspension when mixed with water prior to spraying. |
| Emulsifiable concentrate | Emulsifiable concentrate (EC) is a concentrated liquid formulation of pesticide that needs to be diluted with water to create a spray solution. |
| Plant-parasitic nematodes | Parasitic Nematodes feed on the roots of crops, causing damage to the roots. These damages allow for easy plant infestation by soil-borne pathogens, which results in crop or yield loss. |
| Australian Weeds Strategy (AWS) | The Australian Weeds Strategy, owned by the Environment and Invasives Committee, provides national guidance on weed management. |
| Weed Science Society of Japan (WSSJ) | WSSJ aims to contribute to the prevention of weed damage and the utilization of weed value by providing the chance for research presentation and information exchange. |


Research Methodology
Mordor Intelligence follows a four-step methodology in all our reports.
- Step-1: Identify Key Variables: In order to build a robust forecasting methodology, the variables and factors identified in Step-1 are tested against available historical market numbers. Through an iterative process, the variables required for market forecast are set and the model is built on the basis of these variables.
- Step-2: Build a Market Model: Market-size estimations for the forecast years are in nominal terms. Inflation is not a part of the pricing, and the average selling price (ASP) is kept constant throughout the forecast period.
- Step-3: Validate and Finalize: In this important step, all market numbers, variables and analyst calls are validated through an extensive network of primary research experts from the market studied. The respondents are selected across levels and functions to generate a holistic picture of the market studied.
- Step-4: Research Outputs: Syndicated Reports, Custom Consulting Assignments, Databases & Subscription Platforms


