Europe Nematicide Market Size and Share
Market Overview
| Study Period | 2018 - 2031 |
|---|---|
| Forecast Data Period | 2026 - 2031 |
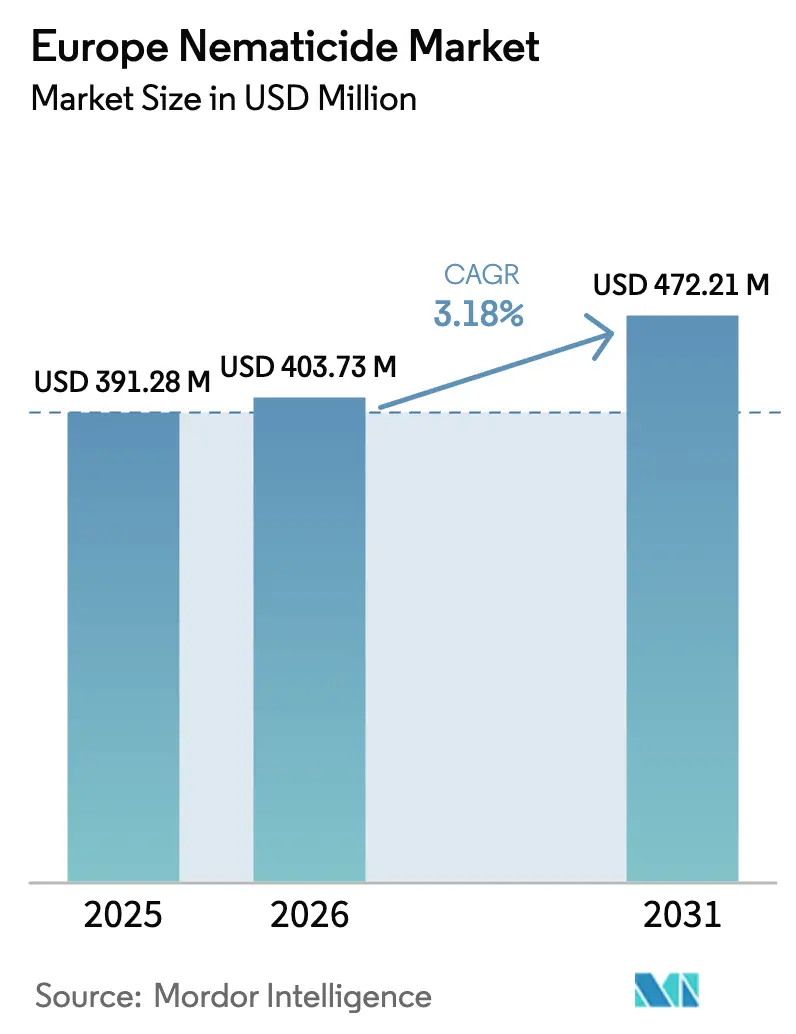
| Base Year Market Size (2025) | USD 391.28 Million |
| Market Size (2026) | USD 403.73 Million |
| Market Size (2031) | USD 472.21 Million |
| Growth Rate (2026 - 2031) | 3.18% CAGR |
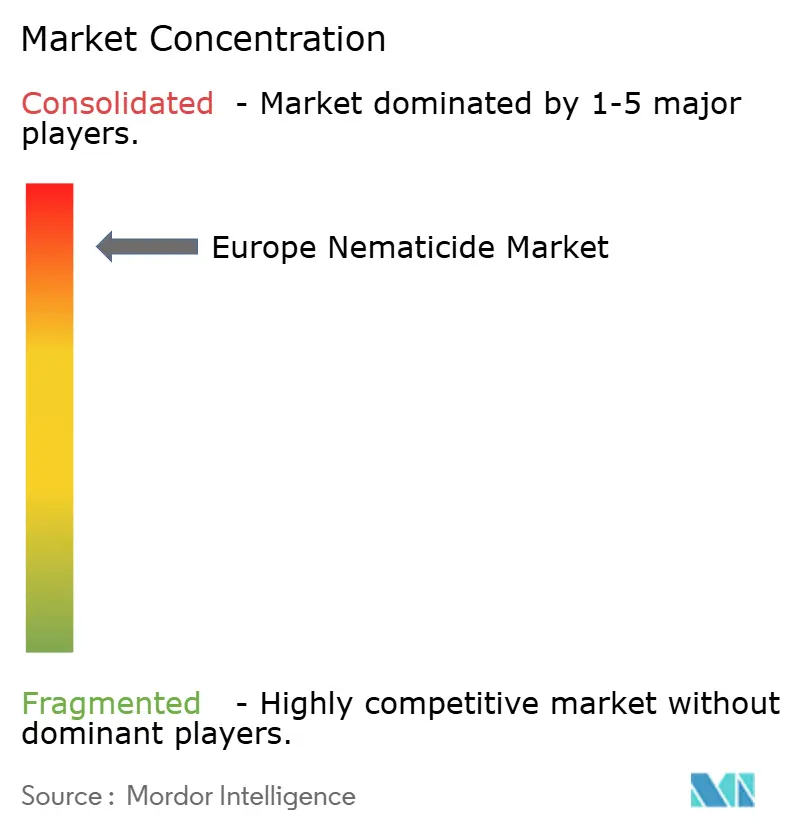
| Market Concentration | High |
Major Players *Disclaimer: Major Players sorted in no particular order Image © Mordor Intelligence. Reuse requires attribution under CC BY 4.0. | |
Europe Nematicide Market Analysis by Mordor Intelligence
Europe nematicide market size in 2026 is estimated at USD 403.73 million, growing from 2025 value of USD 391.28 million with 2031 projections showing USD 472.21 million, growing at 3.18% CAGR over 2026-2031. Precision chemigation, AI-enabled soil diagnostics, and seed-treatment stacks are expanding the grower toolkit, while the European Union's Green Deal is steering the entire value chain toward lower-risk inputs. French vegetable growers and Dutch greenhouse operators are leading the early adoption of sensor-guided application systems that reduce active-ingredient use while maintaining efficacy. In parallel, cereal producers across Germany are turning to seed-embedded protection that simplifies application decisions and safeguards early root development. Supply risks from tighter Europe re-approval timelines are accelerating portfolio shifts away from broad-spectrum actives toward novel low-dose chemistries and microbial products, creating new growth pockets across the European nematicide market.
Key Report Takeaways
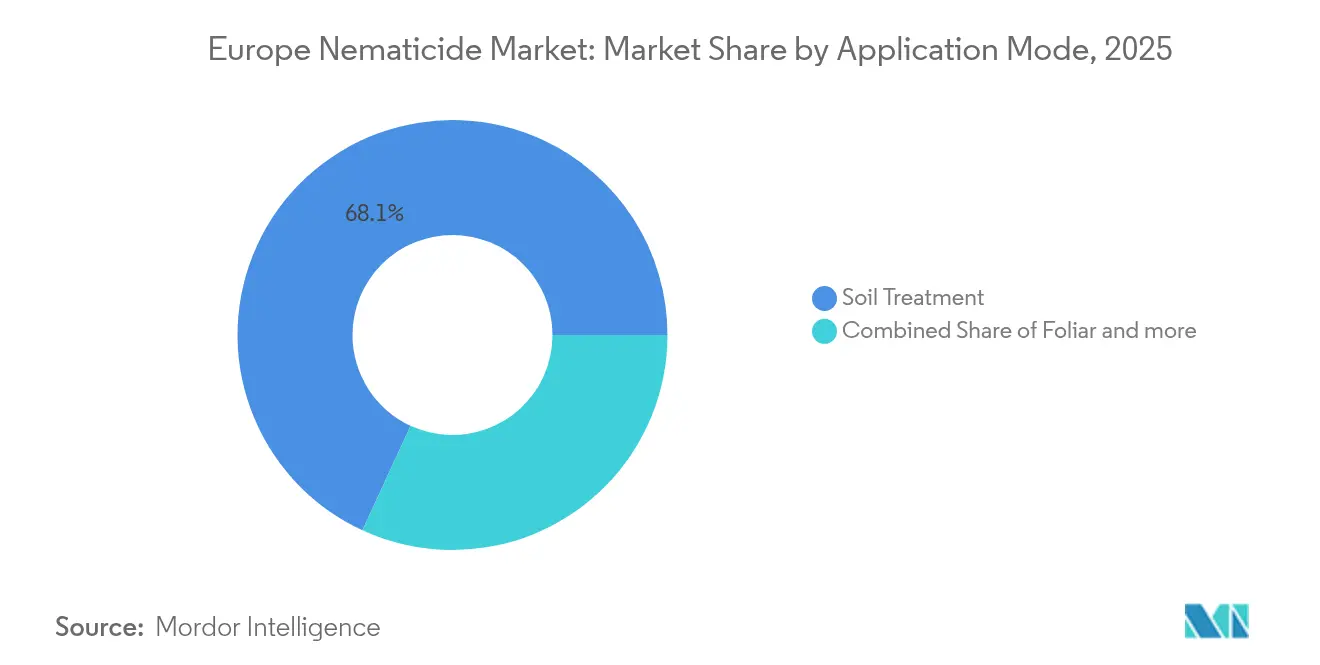
- By application mode, soil treatment accounted for 68.12% of the Europe nematicide market share in 2025, and posted the fastest expansion at 3.28% CAGR through 2031.
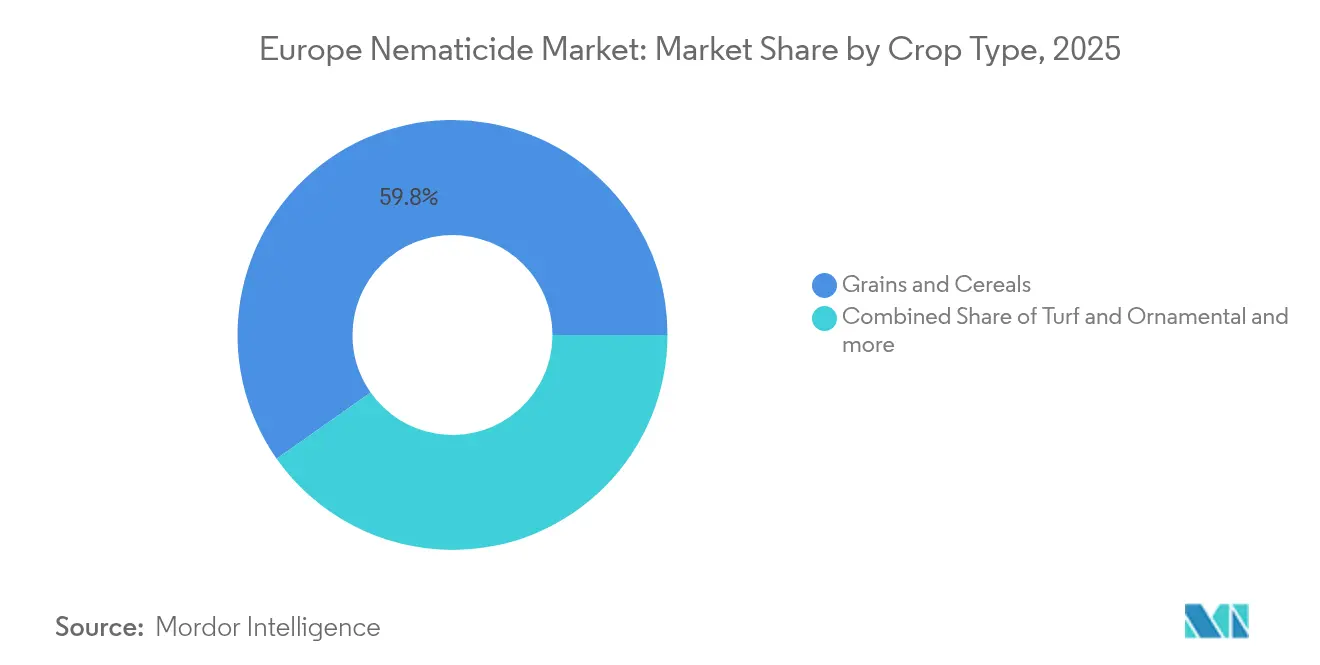
- By crop type, grains and cereals accounted for a 59.75% share of the European nematicide market size in 2025, while Turf and Ornamental posted the fastest expansion at a 3.44% CAGR through 2031.
- By geography, France led with 17.05% revenue share in 2025, while also posting the fastest expansion at 5.03% CAGR through 2031.
Note: Market size and forecast figures in this report are generated using Mordor Intelligence’s proprietary estimation framework, updated with the latest available data and insights as of 2026.
Europe Nematicide Market Trends and Insights
Drivers Impact Analysis*
| Driver | (~) % Impact on CAGR Forecast | Geographic Relevance | Impact Timeline |
|---|---|---|---|
| Intensifying cereal and vegetable intensification raises nematode pressure | +0.8% | France, Germany, Netherlands | Medium term (2-4 years) |
| Europe Green Deal pesticide-reduction targets accelerate nematicides | +1.2% | Bloc-wide, strongest in France, Germany, and the Netherlands | Long term (≥ 4 years) |
| Seed-treatment stacks embedded in hybrid seeds | +0.6% | Grain-producing regions across Europe | Medium term (2-4 years) |
| Drip-fertigation expansion enables precision chemigation doses | +0.4% | Spain, Italy, Netherlands greenhouse sector | Short term (≤ 2 years) |
| Improved synthetic formulations enhance soil penetration and efficacy | +0.3% | All Europe Common Agricultural Policy (CAP) regions, most pronounced in France and Germany | Long term (≥ 4 years) |
| AI-enabled nematode sensors trigger spot-spray demand | +0.2% | Netherlands, Germany, United Kingdom | Medium term (2-4 years) |
| Source: Mordor Intelligence | |||


Intensifying Cereal and Vegetable Intensification Raises Nematode Pressure
European agricultural intensification is creating ideal conditions for nematode population explosions, particularly in high-value vegetable and cereal rotations where continuous cropping reduces natural pest suppression. The shift toward protected cultivation in Mediterranean regions has concentrated root-knot nematode infestations in greenhouse environments, where traditional fumigation is facing increasing restrictions. French vegetable producers report yield losses of 15-20% in intensive production systems without effective nematode management, driving demand for both chemical control solutions [1]Source: ANSES, “Plant Protection Products,” ANSES.FR. As production intensifies, the European nematicide market is seeing broader adoption of crop monitors that quantify threshold populations before damage becomes visible.
Europe Green Deal Pesticide-Reduction Targets Accelerate Nematicides
The European Commission's Farm to Fork strategy, which mandates a 50% reduction in pesticide use by 2030, is fundamentally reshaping the dynamics of the synthetic nematicide market, forcing manufacturers to develop more efficient formulations and precision application technologies that maintain efficacy at reduced usage rates. This regulatory pressure has accelerated the withdrawal of older synthetic actives while driving innovation in next-generation synthetic nematicides that deliver superior performance per unit applied. France leads this transition through ANSES (the Agency for Food, Environmental, and Occupational Health & Safety), which has fast-tracked approval processes for improved synthetic formulations that demonstrate reduced environmental impact. Meanwhile, Germany's Federal Office of Consumer Protection and Food Safety has streamlined registration pathways for synthetic nematicides with novel modes of action.
Seed-Treatment Stacks Embedded in Hybrid Seeds
The integration of nematicide active ingredients into hybrid seed coatings is transforming market access by embedding pest control decisions at the seed selection stage rather than as separate input purchases. This approach particularly benefits companies with strong seed industry partnerships, as farmers increasingly view nematode protection as an inherent seed trait rather than an additional application requirement. Corteva's Reklemel seed treatment technology demonstrates how nematicide integration can differentiate seed products in competitive markets, with treated seeds commanding premium pricing that justifies the additional active ingredient costs. As more seed brands adopt the model, the Europe nematicide market gains a stable distribution route that can smooth seasonal volatility.
Improved Synthetic Formulations Enhance Soil Penetration and Efficacy
Advanced formulation technologies are enabling synthetic nematicides to achieve superior soil penetration and target-zone concentration, improving pest control efficacy while reducing active ingredient requirements per hectare. European chemical companies are developing microencapsulation and controlled-release formulations that extend residual activity and reduce leaching losses, thereby addressing both efficacy and environmental concerns that have historically limited the adoption of synthetic products. These formulation improvements are particularly beneficial for soil treatment applications, where consistent active ingredient distribution throughout the root zone is crucial for control success. Germany leads European adoption of enhanced formulation technologies, with field trials demonstrating 20-25% improved nematode control compared to conventional liquid formulations. The integration of adjuvants and penetration enhancers in synthetic nematicide formulations is enabling effective control at lower application rates, supporting regulatory compliance while maintaining commercial viability for intensive crop production systems.
Restraints Impact Analysis*
| Restraint | (~) % Impact on CAGR Forecast | Geographic Relevance | Impact Timeline |
|---|---|---|---|
| Stricter Europe re-approval process removes key actives | -0.9% | Bloc-wide, highest in intensive vegetable zones | Short term (≤ 2 years) |
| Retail residue audits shorten synthetic-use windows | -0.5% | Western Europe retailers, led by Germany, the United Kingdom, and the Netherlands. | Medium term (2-4 years) |
| Soil-microbiome certification penalizes broad-spectrum chemicals | -0.3% | Organic and sustainable farming regions across Europe | Long term (≥ 4 years) |
| Capital cost of new fumigant-storage containment rules | -0.2% | Spain and Italy are fumigation-dependent regions | Short term (≤ 2 years) |
| Source: Mordor Intelligence | |||
Stricter Europe Re-Approval Process Removes Key Actives
The European Food Safety Authority's enhanced risk assessment protocols are systematically removing established nematicide active ingredients from the market, creating supply gaps that nematicide alternatives cannot immediately fill. The withdrawal of oxamyl in 2024 eliminated a key broad-spectrum nematicide used extensively in European vegetable production, forcing growers to adopt less familiar nematicide products or accept higher pest pressure [2]Source: European Food Safety Authority, “Oxamyl Risk Assessment,” EFSA.EUROPA.EU. This regulatory tightening extends beyond individual active ingredients to include stricter metabolite assessments and environmental fate studies that increase re-registration costs and timelines. The regulatory uncertainty is particularly acute for specialty crop producers who rely on niche nematicides with limited alternative options, potentially constraining production in high-value horticultural sectors.
Retail Residue Audits Shorten Synthetic-Use Windows
Major European retail chains are implementing increasingly stringent residue monitoring programs that effectively shorten the practical application window for synthetic nematicides, regardless of official pre-harvest interval requirements. UK supermarket chains now require nematicide residue levels to be below 50% of the maximum residue limits, creating de facto stricter standards than regulatory requirements. This trend is spreading across Western European retail networks, with German and Dutch supermarket chains adopting similar residue audit protocols that influence farmer application decisions. French vegetable cooperatives are reportedly shifting toward nematicides, specifically to avoid complications from retail audits, even when synthetic alternatives might provide superior pest control efficacy.
*Our forecasts treat driver/restraint impacts as directional, not additive. The impact forecasts reflect baseline growth, mix effects, and variable interactions.
Segment Analysis
By Application Mode: Soil Treatment Dominates Through Direct Efficacy
Soil treatment applications command 68.12% market share in 2025, reflecting farmer preference for direct incorporation methods that ensure active ingredient contact with target nematode populations in the root zone. This dominance stems from the reality that most economically important nematodes complete their life cycles in soil, making direct soil application the most logical intervention point. Soil treatment represents the fastest-growing application method, with a 3.28% CAGR through 2031, driven by the adoption of precision agriculture and the ability to combine nematicide application with routine irrigation cycles.
This significant market position is attributed to its effectiveness in directly applying plant protection chemicals to the soil, where they can remain for extended periods and effectively reach plant root systems to attack harmful soil-dwelling nematodes. The method's popularity is particularly high in regions with diverse soil textures, from sandy soils in northeastern Europe to clay soils in Eastern Europe. Soil treatment offers advantages over other application methods as it poses fewer risks of exposing non-target organisms, including beneficial insects and pollinators, since the nematicide remains primarily in the soil where target nematodes reside.


By Crop Type: Grains Drive Volume While Turf Accelerates Growth
Grains and cereals capture 59.75% of nematicide demand in 2025, reflecting the extensive acreage devoted to wheat, barley, and corn production across European agricultural regions. This segment's dominance stems from both its large crop area and the significant economic impact of nematode damage on grain quality and yield, particularly in continuous cereal rotations where cyst nematodes can build to damaging population levels. Cereal cyst nematodes (CCNs) are among the most critical nematode pests limiting the production of small grain cereals in European countries, causing substantial yield losses and quality reduction. Heavily invaded young plants exhibit stunted growth, with their lower leaves often showing chlorosis, forming pale green patches in the field.
Turf and ornamental applications represent the fastest-growing segment, with a 3.44% CAGR through 2031, driven by golf course expansion and the adoption of integrated nematode control programs by professional landscape managers. The increasing demand for well-maintained sports facilities, golf courses, and ornamental landscapes across Europe drives this growth. Golf greens provide an ideal environment for nematodes, with soil composition being 75-95% sand, creating excellent pores for oxygen, water, and nematode transport. Various nematode species, including dagger nematodes, needle nematodes, pin nematodes, and sheath nematodes, commonly affect turf grass, causing symptoms such as patches of yellow plants, stunting, and poor growth.
Geography Analysis
France leads the European nematicide market with a 17.05% share in 2025 and the fastest growth rate at 5.03% CAGR through 2031, driven by intensive vegetable production systems and early adoption of precision agriculture technologies. The country's leadership is rooted in extensive protected cultivation infrastructure and regulatory frameworks that support both chemical and nematicide registrations through ANSES' (Agency for Food, Environmental and Occupational Health & Safety) streamlined approval processes . French vegetable cooperatives have pioneered integrated nematode management programs that combine nematicide products with precision application technologies, creating market demand for innovative solutions.
The Netherlands demonstrates a particularly strong uptake of AI-enabled nematode detection systems and precision chemigation technologies, reflecting the country's advanced greenhouse infrastructure and leadership in precision agriculture. Dutch greenhouse operators report 25-30% reductions in nematicide usage through sensor-guided application systems that target specific soil zones based on real-time monitoring of nematode populations.
Poland and Russia represent emerging opportunities within the European nematicide market, with expanding commercial agriculture creating new demand for professional pest management solutions. Polish potato and vegetable producers are increasingly adopting integrated nematode management programs as production intensifies and export market requirements drive quality standards. The Rest of Europe category includes smaller markets where niche crop production or specific nematode species create localized demand for specialized control solutions.
Competitive Landscape
The European nematicide market exhibits a highly consolidated structure dominated by global agricultural chemical conglomerates with extensive research capabilities and established distribution networks. Syngenta Group, Bayer AG, Corteva Agriscience, Tessenderlo Kerley Inc. (Novasource), and Albaugh LLC are major players utilize their extensive product portfolios, technical expertise, and robust financial resources to maintain their market positions. The market is characterized by the presence of both diversified agricultural input companies and specialized crop protection chemical firms, with global players holding significant market share advantages over regional competitors.
The market has witnessed several strategic mergers and acquisitions aimed at strengthening market presence and expanding product offerings. Large agricultural companies are actively acquiring smaller, innovative firms to enhance their technological capabilities and expand their geographic reach. This consolidation trend has resulted in increased market concentration, with major players focusing on integrating acquired businesses to achieve operational synergies and expand their customer base. Strategic partnerships between companies further shape the competitive landscape, enabling the development of innovative solutions and addressing evolving customer needs.
For contending companies looking to gain ground, specialization in specific crop segments or regional markets presents opportunities for growth. Success will depend on developing differentiated products that address specific regional challenges and crop protection needs. Companies must also consider potential regulatory changes affecting agricultural pest management usage and adapt their product development strategies accordingly. Building strategic partnerships with local distributors and agricultural service providers will be crucial for market penetration. Additionally, investing in customer education and technical support services will help build brand loyalty and expand market presence in an increasingly competitive landscape.
Europe Nematicide Industry Leaders
Syngenta Group
Bayer AG
Corteva Agriscience
Tessenderlo Kerley Inc. (Novasource)
Albaugh LLC
- *Disclaimer: Major Players sorted in no particular order

Recent Industry Developments
- January 2023: Bayer formed a new partnership with Oerth Bio to enhance crop protection technology and create more eco-friendly crop protection solutions.
- September 2022: Syngenta Group announced a USD 15 million investment in precision agriculture technology development focused on AI-enabled nematode detection and variable-rate application systems. The investment targets European markets where precision agriculture adoption is accelerating demand for sensor-guided pest management solutions.
- April 2020: Corteva Agriscience merged and expanded its facilities in the field of seed research and plant protection products in a comprehensive research center located in Szeged, Hungary. With a total expenditure of USD 1.9 million, the new integrated center is one of Corteva's largest integrated crop research facilities in Europe.


Europe Nematicide Market Report Scope
Chemigation, Foliar, Fumigation, Seed Treatment, Soil Treatment are covered as segments by Application Mode. Commercial Crops, Fruits & Vegetables, Grains & Cereals, Pulses & Oilseeds, Turf & Ornamental are covered as segments by Crop Type. France, Germany, Italy, Netherlands, Russia, Spain, Ukraine, United Kingdom are covered as segments by Country.| Foliar |
| Soil Treatment |
| Seed Treatment |
| Chemigation |
| Fumigation |
| Commercial Crops |
| Fruits & Vegetables |
| Grains & Cereals |
| Pulses & Oilseeds |
| Turf & Ornamental |
| Germany |
| France |
| Spain |
| Russia |
| Italy |
| United Kingdom |
| Netherlands |
| Ukraine |
| Rest of Europe |
| Application Mode | Foliar |
| Soil Treatment | |
| Seed Treatment | |
| Chemigation | |
| Fumigation | |
| Crop Type | Commercial Crops |
| Fruits & Vegetables | |
| Grains & Cereals | |
| Pulses & Oilseeds | |
| Turf & Ornamental | |
| Geography | Germany |
| France | |
| Spain | |
| Russia | |
| Italy | |
| United Kingdom | |
| Netherlands | |
| Ukraine | |
| Rest of Europe |


Market Definition
- Function - Nematicides are chemicals used to control or prevent nematodes from damaging the crop and prevent yield loss.
- Application Mode - Foliar, Seed Treatment, Soil Treatment, Chemigation, and Fumigation are the different type of application modes through which crop protection chemicals are applied to the crops.
- Crop Type - This represents the consumption of crop protection chemicals by Cereals, Pulses, Oilseeds, Fruits, Vegetables, Turf, and Ornamental crops.
| Keyword | Definition |
|---|---|
| IWM | Integrated weed management (IWM) is an approach to incorporate multiple weed control techniques throughout the growing season to give producers the best opportunity to control problematic weeds. |
| Host | Hosts are the plants that form relationships with beneficial microorganisms and help them colonize. |
| Pathogen | A disease-causing organism. |
| Herbigation | Herbigation is an effective method of applying herbicides through irrigation systems. |
| Maximum residue levels (MRL) | Maximum Residue Limit (MRL) is the maximum allowed limit of pesticide residue in food or feed obtained from plants and animals. |
| IoT | The Internet of Things (IoT) is a network of interconnected devices that connect and exchange data with other IoT devices and the cloud. |
| Herbicide-tolerant varieties (HTVs) | Herbicide-tolerant varieties are plant species that have been genetically engineered to be resistant to herbicides used on crops. |
| Chemigation | Chemigation is a method of applying pesticides to crops through an irrigation system. |
| Crop Protection | Crop protection is a method of protecting crop yields from different pests, including insects, weeds, plant diseases, and others that cause damage to agricultural crops. |
| Seed Treatment | Seed treatment helps to disinfect seeds or seedlings from seed-borne or soil-borne pests. Crop protection chemicals, such as fungicides, insecticides, or nematicides, are commonly used for seed treatment. |
| Fumigation | Fumigation is the application of crop protection chemicals in gaseous form to control pests. |
| Bait | A bait is a food or other material used to lure a pest and kill it through various methods, including poisoning. |
| Contact Fungicide | Contact pesticides prevent crop contamination and combat fungal pathogens. They act on pests (fungi) only when they come in contact with the pests. |
| Systemic Fungicide | A systemic fungicide is a compound taken up by a plant and then translocated within the plant, thus protecting the plant from attack by pathogens. |
| Mass Drug Administration (MDA) | Mass drug administration is the strategy to control or eliminate many neglected tropical diseases. |
| Mollusks | Mollusks are pests that feed on crops, causing crop damage and yield loss. Mollusks include octopi, squid, snails, and slugs. |
| Pre-emergence Herbicide | Preemergence herbicides are a form of chemical weed control that prevents germinated weed seedlings from becoming established. |
| Post-emergence Herbicide | Postemergence herbicides are applied to the agricultural field to control weeds after emergence (germination) of seeds or seedlings. |
| Active Ingredients | Active ingredients are the chemicals in pesticide products that kill, control, or repel pests. |
| United States Department of Agriculture (USDA) | The Department of Agriculture provides leadership on food, agriculture, natural resources, and related issues. |
| Weed Science Society of America (WSSA) | The WSSA, a non-profit professional society, promotes research, education, and extension outreach activities related to weeds. |
| Suspension concentrate | Suspension concentrate (SC) is one of the formulations of crop protection chemicals with solid active ingredients dispersed in water. |
| Wettable powder | A wettable powder (WP) is a powder formulation that forms a suspension when mixed with water prior to spraying. |
| Emulsifiable concentrate | Emulsifiable concentrate (EC) is a concentrated liquid formulation of pesticide that needs to be diluted with water to create a spray solution. |
| Plant-parasitic nematodes | Parasitic Nematodes feed on the roots of crops, causing damage to the roots. These damages allow for easy plant infestation by soil-borne pathogens, which results in crop or yield loss. |
| Australian Weeds Strategy (AWS) | The Australian Weeds Strategy, owned by the Environment and Invasives Committee, provides national guidance on weed management. |
| Weed Science Society of Japan (WSSJ) | WSSJ aims to contribute to the prevention of weed damage and the utilization of weed value by providing the chance for research presentation and information exchange. |


Research Methodology
Mordor Intelligence follows a four-step methodology in all our reports.
- Step-1: Identify Key Variables: In order to build a robust forecasting methodology, the variables and factors identified in Step-1 are tested against available historical market numbers. Through an iterative process, the variables required for market forecast are set and the model is built on the basis of these variables.
- Step-2: Build a Market Model: Market-size estimations for the forecast years are in nominal terms. Inflation is not a part of the pricing, and the average selling price (ASP) is kept constant throughout the forecast period.
- Step-3: Validate and Finalize: In this important step, all market numbers, variables and analyst calls are validated through an extensive network of primary research experts from the market studied. The respondents are selected across levels and functions to generate a holistic picture of the market studied.
- Step-4: Research Outputs: Syndicated Reports, Custom Consulting Assignments, Databases & Subscription Platforms


