Africa Feed Enzymes Market Size and Share
Market Overview
| Study Period | 2018 - 2031 |
|---|---|
| Forecast Data Period | 2026 - 2031 |
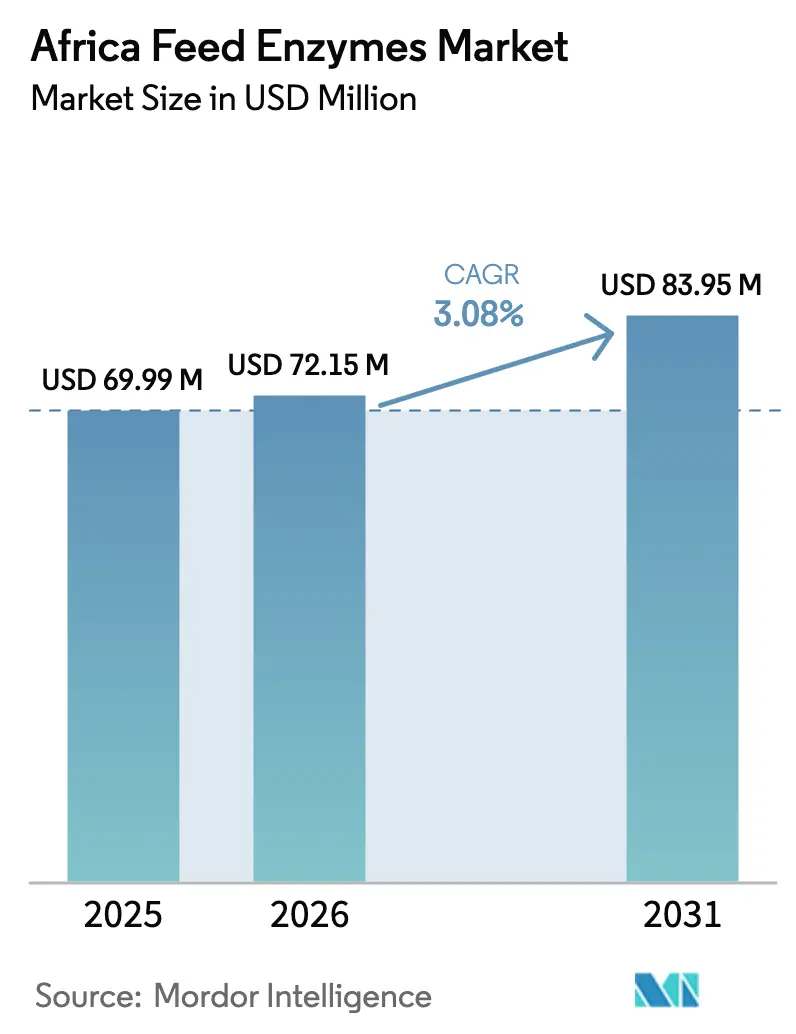
| Base Year Market Size (2025) | USD 69.99 Million |
| Market Size (2026) | USD 72.15 Million |
| Market Size (2031) | USD 83.95 Million |
| Growth Rate (2026 - 2031) | 3.08% CAGR |
| Market Concentration | Low |
Major Players *Disclaimer: Major Players sorted in no particular order Image © Mordor Intelligence. Reuse requires attribution under CC BY 4.0. | |
Africa Feed Enzymes Market Analysis by Mordor Intelligence
The Africa feed enzymes market size is expected to grow from USD 69.99 million in 2025 to USD 72.15 million in 2026 and is forecast to reach USD 83.95 million by 2031 at 3.08% CAGR over 2026-2031. Rising grain price volatility, stricter regulation of antibiotic growth promoters, and the migration toward integrated livestock production continue to shape investment priorities around the continent. Multinational producers are tailoring thermostable multi-enzyme blends to match tropical pelleting temperatures, while mills adopt near-infrared (NIR) monitoring to measure phytate destruction in real time. Local research programs in South Africa and Nigeria are commercializing low-cost cellulases from agro-waste, signaling an eventual shift toward partial import substitution. Currency depreciation in import-dependent nations amplifies the value proposition of carbohydrases and phytases that liberate energy and phosphorus from lower-grade ingredients. Collectively, these drivers sustain a healthy demand outlook even as cold-chain and duty barriers temper near-term penetration of liquid formulations.
Key Report Takeaways
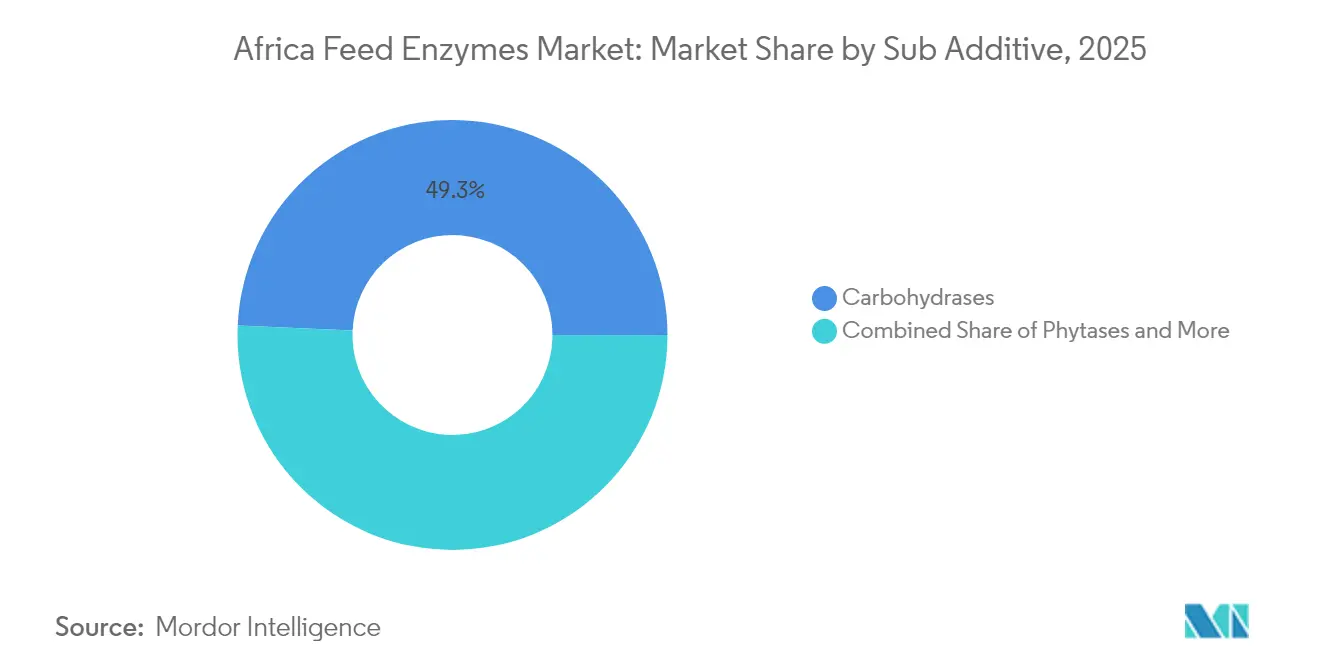
- By sub-additive, carbohydrases led with 49.30% of the Africa feed enzymes market share in 2025. Other enzymes are projected to log the fastest growth at a 3.12% CAGR between 2026 and 2031.
- By animal, poultry accounted for 55.20% of the Africa feed enzymes market size in 2025. Swine applications are forecast to register the quickest expansion, advancing at a 3.88% CAGR through 2031.
- By geography, South Africa dominated with a 47.60% market share in 2025. South Africa also posts the highest regional growth rate, rising at a 3.72% CAGR over the forecast period.
Note: Market size and forecast figures in this report are generated using Mordor Intelligence’s proprietary estimation framework, updated with the latest available data and insights as of 2026.
Africa Feed Enzymes Market Trends and Insights
Drivers Impact Analysis*
| Driver | (~) % Impact on CAGR Forecast | Geographic Relevance | Impact Timeline |
|---|---|---|---|
| Ban on antibiotic growth promoters accelerates enzyme adoption | +0.8% | Global, with early implementation in South Africa and Kenya | Medium term (2-4 years) |
| High raw-material prices push feed mills toward enzyme-enabled cost savings | +0.6% | Global, concentrated in import-dependent regions | Short term (≤ 2 years) |
| Expansion of integrated poultry and aqua farms | +0.5% | Nigeria, Egypt, South Africa, Kenya | Long term (≥ 4 years) |
| Emergence of thermostable multi-enzyme blends suited to tropical pelleting | +0.4% | Sub-Saharan Africa, North Africa | Medium term (2-4 years) |
| Digitized dosing and NIR-based phytate monitoring at African mega-mills | +0.3% | South Africa, Egypt, Nigeria | Long term (≥ 4 years) |
| Local fermentation start-ups producing low-cost cellulases from agro-waste | +0.2% | South Africa, Nigeria, Kenya | Long term (≥ 4 years) |
| Source: Mordor Intelligence | |||
Ban on Antibiotic Growth Promoters Accelerates Enzyme Adoption
Regulations phasing out antibiotic growth promoters are prompting mills to substitute multi-enzyme blends that maintain growth rates without antimicrobial resistance risks[1]Source: GPC Gateway, “Africa Reach Regulation for chemical Sectors,” gpcgateway.com. South Africa’s updated additive guidelines under the Hazardous Substances Act set a template for Kenya and Ghana, where draft rules reference similar safety dossiers. Phytases and proteases that deliver digestibility gains are gaining early traction among broiler integrators who must verify compliance during export certification audits. Suppliers report double-digit sales growth where technical demonstrations confirm that enzyme programs sustain feed conversion ratios formerly achieved with antibiotics. The predictable regulatory timeline supports capital investment in micronutrient dosing equipment that can also meter enzymes accurately.
High Raw-Material Prices Push Feed Mills Toward Enzyme-Enabled Cost Savings
Volatile grain prices, exacerbated by geopolitical disruptions affecting wheat and corn imports, are compelling African feed manufacturers to pursue enzyme-based cost optimization strategies. Wheat price increases in markets like Kenya and Rwanda have elevated feed ingredient costs to unsustainable levels for many producers. Enzyme supplementation enables mills to incorporate lower-cost alternative ingredients while maintaining nutritional performance, with carbohydrases particularly effective at unlocking energy from fibrous local by-products. The cost pressure is most acute in import-dependent regions where currency depreciation compounds raw material inflation. Feed mills report enzyme inclusion rates increasing as producers seek measurable feed conversion improvements to offset ingredient cost escalation.
Expansion of Integrated Poultry and Aqua Farms
Vertically integrated producers are anchoring enzyme demand because they can verify economic returns across the full value chain. Nigeria’s large fish feed plants deploy automated liquid-enzyme vacuum coaters to ensure uniform application at high throughput, while their in-house laboratories track nutrient digestibility improvements. Egyptian and Kenyan broiler integrators follow similar models, embedding enzyme protocols in corporate feed standards that cascade to contract growers. The scale of these enterprises stabilizes procurement volumes, allowing suppliers to justify local warehousing and technical service teams.
Emergence of Thermostable Multi-Enzyme Blends Suited to Tropical Pelleting
DSM-Firmenich's RONOZYME MultiGrain represents this technological evolution, offering high retention after pelleting, specifically designed for corn-based diets common in African markets[2]Source: DSM, “Feed Enzymes,” dsm.com. Technical innovations in enzyme stability are addressing the unique challenges of feed processing in tropical climates where high-temperature pelleting can denature conventional enzyme preparations. Research from South African institutions has developed thermostable xylanase variants capable of withstanding pelleting temperatures exceeding 85°C while maintaining 80% activity retention. These advances enable consistent enzyme performance in African feed mills that rely on steam pelleting for feed quality and pathogen control. The development of multi-enzyme blends combining carbohydrases, proteases, and phytases in thermostable formulations reduces complexity for feed manufacturers while improving cost-effectiveness.
Restraints Impact Analysis*
| Restraint | (~) % Impact on CAGR Forecast | Geographic Relevance | Impact Timeline |
|---|---|---|---|
| Weak cold-chain and warehousing infrastructure for liquid enzymes | -0.4% | Sub-Saharan Africa, rural regions | Medium term (2-4 years) |
| High import duties on specialty additives | -0.3% | Import-dependent markets excluding South Africa | Short term (≤ 2 years) |
| Limited technical know-how at smallholder feed formulators | -0.2% | Rural areas, smallholder operations | Long term (≥ 4 years) |
| Currency volatility impacting working-capital cycles for distributors | -0.2% | All regions with floating exchange rates | Short term (≤ 2 years) |
| Source: Mordor Intelligence | |||
Weak Cold-Chain and Warehousing Infrastructure for Liquid Enzymes
Distribution challenges significantly constrain liquid enzyme adoption across African markets, where cold storage infrastructure remains inadequate for maintaining product stability. Temperature excursions during transport and storage can reduce enzyme activity, creating performance inconsistencies that undermine user confidence and economic returns. The infrastructure deficit is particularly acute in rural areas where smallholder feed mills lack refrigerated storage capabilities, forcing reliance on more expensive dry enzyme formulations. This constraint limits market penetration for cost-effective liquid enzyme products and increases overall enzyme costs for end users. Investment in cold-chain infrastructure development represents a critical bottleneck that enzyme suppliers must address through partnerships or alternative formulation strategies.
High Import Duties on Specialty Additives
Tariff barriers create significant cost disadvantages for imported enzyme products, with duties ranging from 15-35% across different African markets and product classifications. These import costs are particularly burdensome for smaller feed operations that lack the volume to justify direct manufacturer relationships or bulk purchasing arrangements. The duty structure often fails to distinguish between essential feed additives and luxury imports, resulting in enzyme products being classified alongside higher-tariff categories. Currency depreciation compounds this challenge by increasing the local currency cost of imported enzymes even without duty changes. Local production capabilities remain limited, creating sustained dependence on imports and continued exposure to tariff volatility that constrains market growth potential.
*Our forecasts treat driver/restraint impacts as directional, not additive. The impact forecasts reflect baseline growth, mix effects, and variable interactions.
Segment Analysis
By Sub Additive: Carbohydrases Extend Dominance Through Multi-Enzyme Innovation
Carbohydrases led the Africa feed enzymes market size with 49.30% share in 2025 and are projected to sustain momentum as part of increasingly sophisticated blends that also include proteases and phytases. The segment benefits from its proven ability to degrade non-starch polysaccharides present in corn and sorghum diets, unlocking more metabolizable energy and enabling mills to incorporate cheaper fibrous feedstuffs. Africa feed enzymes market share for carbohydrases also holds a strategic edge under heat-stable formats that retain activity above 85 °C, critical in tropical extrusion.
Segment growth is reinforced by robust R&D pipelines that leverage local genetic resources. South African laboratories have isolated thermostable xylanase genes from indigenous fungi and validated activity retention at commercial pelleting temperatures. This scientific base accelerates licensing deals with multinational producers seeking region-specific assets. Phytases remain the second-largest sub-additive because regulators increasingly emphasize phosphorus utilization. Other enzymes, including novel mannanases and cellulases, form the fastest-expanding cluster at a 3.12% CAGR as nutritionists pursue complementary action spectra to address diverse raw-material matrices.


By Animal: Poultry Sustains Leadership While Swine Shows Fastest Expansion
Poultry accounted for 55.20% of overall consumption in 2025, reflecting the sector’s scale and acute sensitivity to feed conversion metrics. Typical broiler formulations allocate 70% of cost to feed, making any digestibility gain directly margin accretive. Africa feed enzymes market size for poultry is projected to enlarge further as integrators deploy NIR-linked dosing that tailors blends to daily ingredient shifts. Aquaculture follows, driven by extrusion investments supporting floating feeds where proteases improve amino-acid availability in plant proteins.
Swine registers the highest segment CAGR of 3.88%, riding on commercial piggery expansions in South Africa and Nigeria. Trials demonstrate that protease-enhanced diets permit a 1–1.5 USD/kg reduction in soybean inclusion without compromising carcass yield, an outcome gaining attention among new entrants to intensive pig production. Ruminant adoption remains nascent but is poised to grow once rumen-protected enzymes scale beyond pilot volumes.

Geography Analysis
South Africa’s leadership position rests on its 47.60% share in 2025, deep technical capabilities, and harmonized additive regulations that shorten time-to-market for new formulations. Local mills are early adopters of digitized dosing, employing NIR analytics to fine-tune enzyme inclusion and document phosphorus emission reductions for sustainability audits. Supplier support laboratories in Gauteng provide rapid activity verification, minimizing the risk of under-performing batches. These structural advantages anchor the country’s 3.72% CAGR outlook to 2031 even as macroeconomic headwinds persist.
Egypt sustains a commanding presence through sizable poultry integrators and government incentives for aquaculture. The September 2024 inauguration of a premix and additives plant enables same-week deliveries, reducing working-capital lock-up for distributors. A relatively stable currency versus peers lowers forex risk on imports, fostering broader product portfolios in retail channels.
Kenya, Nigeria, and emerging clusters across East and West Africa illustrate the next wave of growth. Kenya’s proposal for an updated competition law covering digital ordering platforms may streamline market entry for specialized enzyme lines. Nigeria’s aquaculture modernization, serving over 15,000 farmers, demonstrates the catalytic role of scale facilities in building technical competence. Rwanda’s new mill underscores how public-private infrastructure investments are extending enzyme accessibility into landlocked markets.
Competitive Landscape
The Africa feed enzymes market remains fragmented as no single player exceeds a high revenue share. Novonesis (DSM-Firmenich), IFF(Danisco Animal Nutrition), Elanco Animal Health Inc., Adisseo, and Archer Daniels Midland Co. are the primary multinational suppliers, but rising local fermentation start-ups are beginning to challenge with niche cellulase and mannanase offerings. The June 2025 acquisition of DSM-Firmenich’s Feed Enzyme Alliance by Novonesis for EUR 1.5 billion (USD 1.6 billion) consolidates heat-stable technology portfolios and widens distribution into French-speaking West Africa. Rival firms respond by strengthening technical service teams and introducing bundled solutions that integrate enzymes with acidifiers and probiotics.
Product efficacy and supply reliability dominate purchasing criteria. Companies invest in regional warehouses to mitigate port congestion and currency swings. Technology differentiation centers on pelleting stability, evidenced by the December 2024 release of RONOZYME MultiGrain granules verified for 90% activity retention post-conditioning[3]Source: DSM Firmernich Performance Solutions, “RONOZYME MultiGrain,” dsm.com. Digital support platforms that allow mills to upload pellet-temperature logs and receive real-time dosage adjustments reinforce long-term contracts.
Local R&D partnerships are intensifying. South African universities collaborate with BASF SE and Alltech on bio-prospecting indigenous microbes for high-temperature enzymes, while Nigerian biotech incubators work with Cargill to valorize cassava peels. Such alliances aim to lower cost-to-serve metrics and satisfy rising localization mandates in government procurement policies.
Africa Feed Enzymes Industry Leaders
Adisseo
Elanco Animal Health Inc.
IFF(Danisco Animal Nutrition)
Novonesis (DSM-Firmenich)
Archer Daniels Midland Co.
- *Disclaimer: Major Players sorted in no particular order


Recent Industry Developments
- June 2025: Novonesis finalized acquisition of dsm-firmenich’s Feed Enzyme Alliance for EUR 1.5 billion (USD 1.6 billion), expanding its thermostable portfolio and African distribution reach.
- September 2024: DSM-Firmenich opened a premix and additives plant in Sadat City, Egypt, to shorten lead times for North African customers.
- July 2024: Rwanda inaugurated a USD 4 million (USD 4 million) feed factory in Masoro Industrial Zone, boosting regional pellet capacity.


Africa Feed Enzymes Market Report Scope
Carbohydrases, Phytases are covered as segments by Sub Additive. Aquaculture, Poultry, Ruminants, Swine are covered as segments by Animal. Egypt, Kenya, South Africa are covered as segments by Country.| Carbohydrases |
| Phytases |
| Other Enzymes |
| Aquaculture | By Sub Animal | Fish |
| Shrimp | ||
| Other Aquaculture Species | ||
| Poultry | By Sub Animal | Broiler |
| Layer | ||
| Other Poultry Birds | ||
| Ruminants | By Sub Animal | Beef Cattle |
| Dairy Cattle | ||
| Other Ruminants | ||
| Swine | ||
| Other Animals |
| Egypt |
| Kenya |
| South Africa |
| Rest of Africa |
| Sub Additive | Carbohydrases | ||
| Phytases | |||
| Other Enzymes | |||
| Animal | Aquaculture | By Sub Animal | Fish |
| Shrimp | |||
| Other Aquaculture Species | |||
| Poultry | By Sub Animal | Broiler | |
| Layer | |||
| Other Poultry Birds | |||
| Ruminants | By Sub Animal | Beef Cattle | |
| Dairy Cattle | |||
| Other Ruminants | |||
| Swine | |||
| Other Animals | |||
| Country | Egypt | ||
| Kenya | |||
| South Africa | |||
| Rest of Africa | |||


Market Definition
- FUNCTIONS - For the study, feed additives are considered to be commercially manufactured products that are used to enhance characteristics such as weight gain, feed conversion ratio, and feed intake when fed in appropriate proportions.
- RESELLERS - Companies engaged in reselling feed additives without value addition have been excluded from the market scope, to avoid double counting.
- END CONSUMERS - Compound feed manufacturers are considered to be end-consumers in the market studied. The scope excludes farmers buying feed additives to be used directly as supplements or premixes.
- INTERNAL COMPANY CONSUMPTION - Companies engaged in the production of compound feed as well as the manufacturing of feed additives are part of the study. However, while estimating the market sizes, the internal consumption of feed additives by such companies has been excluded.
| Keyword | Definition |
|---|---|
| Feed additives | Feed additives are products used in animal nutrition for purposes of improving the quality of feed and the quality of food from animal origin, or to improve the animals’ performance and health. |
| Probiotics | Probiotics are microorganisms introduced into the body for their beneficial qualities. (It maintains or restores beneficial bacteria to the gut). |
| Antibiotics | Antibiotic is a drug that is specifically used to inhibit the growth of bacteria. |
| Prebiotics | A non-digestible food ingredient that promotes the growth of beneficial microorganisms in the intestines. |
| Antioxidants | Antioxidants are compounds that inhibit oxidation, a chemical reaction that produces free radicals. |
| Phytogenics | Phytogenics are a group of natural and non-antibiotic growth promoters derived from herbs, spices, essential oils, and oleoresins. |
| Vitamins | Vitamins are organic compounds, which are required for normal growth and maintenance of the body. |
| Metabolism | A chemical process that occurs within a living organism in order to maintain life. |
| Amino acids | Amino acids are the building blocks of proteins and play an important role in metabolic pathways. |
| Enzymes | Enzyme is a substance that acts as a catalyst to bring about a specific biochemical reaction. |
| Anti-microbial resistance | The ability of a microorganism to resist the effects of an antimicrobial agent. |
| Anti-microbial | Destroying or inhibiting the growth of microorganisms. |
| Osmotic balance | It is a process of maintaining salt and water balance across membranes within the body's fluids. |
| Bacteriocin | Bacteriocins are the toxins produced by bacteria to inhibit the growth of similar or closely related bacterial strains. |
| Biohydrogenation | It is a process that occurs in the rumen of an animal in which bacteria convert unsaturated fatty acids (USFA) to saturated fatty acids (SFA). |
| Oxidative rancidity | It is a reaction of fatty acids with oxygen, which generally causes unpleasant odors in animals. To prevent these, antioxidants were added. |
| Mycotoxicosis | Any condition or disease caused by fungal toxins, mainly due to contamination of animal feed with mycotoxins. |
| Mycotoxins | Mycotoxins are toxin compounds that are naturally produced by certain types of molds (fungi). |
| Feed Probiotics | Microbial feed supplements positively affect gastrointestinal microbial balance. |
| Probiotic yeast | Feed yeast (single-cell fungi) and other fungi used as probiotics. |
| Feed enzymes | They are used to supplement digestive enzymes in an animal’s stomach to break down food. Enzymes also ensure that meat and egg production is improved. |
| Mycotoxin detoxifiers | They are used to prevent fungal growth and to stop any harmful mold from being absorbed in the gut and blood. |
| Feed antibiotics | They are used both for the prevention and treatment of diseases but also for rapid growth and development. |
| Feed antioxidants | They are used to protect the deterioration of other feed nutrients in the feed such as fats, vitamins, pigments, and flavoring agents, thus providing nutrient security to the animals. |
| Feed phytogenics | Phytogenics are natural substances, added to livestock feed to promote growth, aid in digestion, and act as anti-microbial agents. |
| Feed vitamins | They are used to maintain the normal physiological function and normal growth and development of animals. |
| Feed flavors and sweetners | These flavors and sweeteners help to mask tastes and odors during changes in additives or medications and make them ideal for animal diets undergoing transition. |
| Feed acidifiers | Animal feed acidifiers are organic acids incorporated into the feed for nutritional or preservative purposes. Acidifiers enhance congestion and microbiological balance in the alimentary and digestive tracts of livestock. |
| Feed minerals | Feed minerals play an important role in the regular dietary requirements of animal feed. |
| Feed binders | Feed binders are the binding agents used in the manufacture of safe animal feed products. It enhances the taste of food and prolongs the storage period of the feed. |
| Key Terms | Abbreviation |
| LSDV | Lumpy Skin Disease Virus |
| ASF | African Swine Fever |
| GPA | Growth Promoter Antibiotics |
| NSP | Non-Starch Polysaccharides |
| PUFA | Polyunsaturated Fatty Acid |
| Afs | Aflatoxins |
| AGP | Antibiotic Growth Promoters |
| FAO | The Food And Agriculture Organization of the United Nations |
| USDA | The United States Department of Agriculture |


Research Methodology
Mordor Intelligence follows a four-step methodology in all our reports.
- Step-1: IDENTIFY KEY VARIABLES: In order to build a robust forecasting methodology, the variables and factors identified in Step-1 are tested against available historical market numbers. Through an iterative process, the variables required for market forecast are set and the model is built on the basis of these variables.
- Step-2: Build a Market Model: Market-size estimations for the forecast years are in nominal terms. Inflation is not a part of the pricing, and the average selling price (ASP) is kept constant throughout the forecast period.
- Step-3: Validate and Finalize: In this important step, all market numbers, variables and analyst calls are validated through an extensive network of primary research experts from the market studied. The respondents are selected across levels and functions to generate a holistic picture of the market studied.
- Step-4: Research Outputs: Syndicated Reports, Custom Consulting Assignments, Databases & Subscription Platforms


