Africa Feed Amino Acids Market Size and Share
Market Overview
| Study Period | 2017 - 2030 |
|---|---|
| Forecast Data Period | 2025 - 2030 |
| Historical Data Period | 2017 - 2023 |
| Market Size (2025) | USD 459.30 Million |
| Market Size (2030) | USD 541.80 Million |
| Growth Rate (2025 - 2030) | 3.40% CAGR |
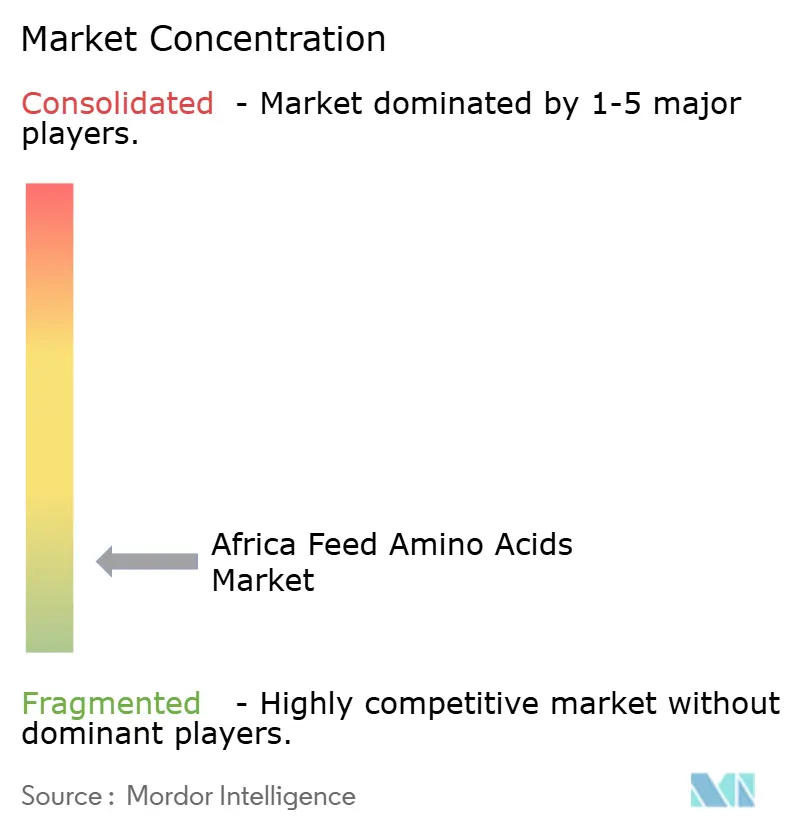
| Market Concentration | Low |
Major Players*Disclaimer: Major Players sorted in no particular order Image © Mordor Intelligence. Reuse requires attribution under CC BY 4.0. | |

Africa Feed Amino Acids Market Analysis by Mordor Intelligence
The Africa feed amino acids Market stands at a market size of USD 459.3 million in 2025 and is projected to reach USD 541.8 million in 2030, advancing at a 3.4% CAGR through the forecast period. This trajectory reflects a continent-wide shift toward intensive livestock production, supported by rising urban disposable incomes, expanding feed-milling capacity, and targeted government productivity programs. Multinational and regional suppliers are expanding local premix facilities at strategic ports to shorten supply chains and reduce foreign-exchange exposure, while feed formulators are adopting precision amino-acid nutrition software to limit soybean meal inclusion and improve feed conversion ratios. Currency volatility and fragmented distribution continue to temper momentum, but accelerating aquaculture investments and stronger regulatory frameworks are laying a platform for steady long-term growth across Nigeria, Egypt, Kenya, and South Africa. Competitive intensity remains high, with insect-protein innovators and protected amino-acid technologies challenging incumbent synthetic offerings.
Key Report Takeaways
- By subadditive, lysine led with a 32.6% of the Africa feed amino acids market size in 2024, whereas methionine is forecast to expand at a 3.6% CAGR through 2030.
- By animal, poultry accounted for 57.3% of the Africa feed amino acids market share in 2024, and swine is advancing at a 4% CAGR through 2030.
- By country, South Africa, with a 41.5% share of the market in 2024, is set to emerge as the fastest-growing market, experiencing a 4% CAGR through 2030.
- The Africa Feed Amino Acids Market remains highly fragmented with the top 5 companies, including Adisseo, Archer Daniel Midland Co., Evonik Industries AG, IFF(Danisco Animal Nutrition), and SHV (Nutreco NV), capturing less than 22.2% of sales in 2024, underscoring significant headroom for both multinational and local players.
Africa Feed Amino Acids Market Trends and Insights
Drivers Impact Analysis*
| Driver | (~) % Impact on CAGR Forecast | Geographic Relevance | Impact Timeline |
|---|---|---|---|
| Surging poultry meat demand across urban Africa | +1.2% | Nigeria, Egypt, Kenya, South Africa | Medium term (2-4 years) |
| Expansion of domestic feed-milling capacity | +0.8% | Nigeria, Egypt, Kenya, Ghana | Long term (≥ 4 years) |
| Government livestock-productivity initiatives | +0.6% | Continental Africa, CAADP member states | Long term (≥ 4 years) |
| Aquaculture intensification projects | +0.5% | Nigeria, Egypt, Kenya, Uganda | Medium term (2-4 years) |
| Precision amino-acid nutrition to curb soybean dependency | +0.4% | Nigeria, South Africa, Kenya | Medium term (2-4 years) |
| Port-based premix facilities attracting foreign investment | +0.3% | Lagos, Mombasa, Durban, Alexandria | Short term (≤ 2 years) |
| Source: Mordor Intelligence | |||
Surging Poultry Meat Demand Across Urban Africa
Rapid urban population growth pushes poultry to the forefront of animal protein choices because broiler meat remains affordable and broadly acceptable culturally. Nigeria, Egypt, and Kenya are experiencing double-digit growth in modern broiler operations, each requiring consistent inclusion of lysine and methionine to secure feed efficiency benchmarks. The African Union’s CAADP (Comprehensive Africa Agriculture Development Programme) framework embeds explicit poultry productivity targets, prompting feed formulators to shift away from crude protein approaches toward digestible amino acid matrices that boost flock uniformity and carcass yield. Large retail chains in Lagos and Nairobi now stipulate minimum feed specification standards, indirectly institutionalizing amino acid supplementation across commercial farms. As consumer demand skews toward chilled and processed poultry cuts, quality-driven processors reinforce the value of balanced amino-acid profiles to manage drip loss and shelf stability, further cementing demand within the Africa Feed Amino Acids Market. [1]Source: Food and Agriculture Organization, “Regional Livestock Productivity Programs,” fao.org
Expansion of Domestic Feed-Milling Capacity
High freight costs and foreign exchange constraints have encouraged domestic investors to develop modern feed mills in Nigeria, Kenya, and Rwanda. Olam’s USD 150 million outlay for a 600,000-tonne complex in Kaduna introduces advanced micro-dosing lines able to meter amino-acid inclusions to increments below 15 grams per ton. Such technology allows mills to react in real time to commodity swings, maximizing least-cost formulation outcomes and elevating competitive barriers for smaller entrants. Sophisticated mills also integrate cloud-based procurement dashboards that pair global amino-acid spot prices with local exchange-rate forecasts, creating a data-driven procurement arena that will underpin stable long-run uptake across the Africa Feed Amino Acids Market.
Government Livestock-Productivity Initiatives
Policy makers view feed efficiency as the quickest lever to narrow protein deficits, so national livestock roadmaps allocate budget lines for extension training and matching-grant feed trials. Nigeria channels credit guarantees to cooperatives adopting certified compound feeds fortified with essential amino acids, while Kenya subsidizes laboratory analyses that verify amino-acid levels in finished feeds, lowering quality-assurance costs for local mills. These measures build producer confidence in feed technology and catalyze recurring demand for lysine, methionine, and threonine. Long-term adherence to World Organisation for Animal Health guidelines on nutrient management should further institutionalize amino-acid inclusion and anchor incremental volume growth in the Africa Feed Amino Acids Market.
Aquaculture Intensification Projects
Fish farming has moved from ponds to high-density cages on Lake Victoria and the Niger Delta, creating biological oxygen-demand stress that heightens the importance of precise amino-acid balances. Studies by the Kenya Marine and Fisheries Research Institute show that methionine supplementation at 0.32% of diet can improve tilapia growth by 8.4% under cage conditions, encouraging private hatcheries to lock in forward contracts for concentrated amino-acid premixes. Egypt’s government offers land-lease incentives for integrated fish-feed plants near the Suez Canal, which shortens import routes for amino acids sourced from Europe and Asia. As aquaculture output replaces finite wild-catch supplies, feed conversion efficiency becomes the critical economic metric, securing long-run methionine and lysine demand within the Africa Feed Amino Acids Market.
Restraints Impact Analysis*
| Restraint | (~) % Impact on CAGR Forecast | Geographic Relevance | Impact Timeline |
|---|---|---|---|
| Currency-linked price volatility of imported amino acids | -0.9% | Nigeria, Kenya, Egypt, Ghana | Short term (≤ 2 years) |
| Inadequate feed-distribution infrastructure | -0.6% | Rural Africa, inland regions | Long term (≥ 4 years) |
| Lengthy registration for protected amino-acid molecules | -0.4% | Nigeria, Egypt, Kenya, South Africa | Medium term (2-4 years) |
| Rising insect-protein substitution in compound feeds | -0.3% | South Africa, Kenya, Nigeria | Medium term (2-4 years) |
| Source: Mordor Intelligence | |||
Currency-Linked Price Volatility of Imported Amino Acids
Amino acids remain denominated in USD, so each depreciation episode in the naira, shilling, or pound instantly increases local landed costs. Small mills lacking hedging facilities pass these spikes on to farmers, who then slash inclusion rates or revert to single-protein sources. Such demand whiplash complicates inventory planning for distributors and erodes the profitability of the Africa Feed Amino Acids Market during currency crises. Larger integrators mitigate risk through forward contracts and port-side warehousing, yet even they cannot fully escape working-capital strains when exchange-rate moves exceed 15% in a single quarter. [2]Source: General Authority for Investment and Free Zones, “Currency Volatility and Feed Cost Implications,” investinegypt.gov.eg
Inadequate Feed-Distribution Infrastructure
Poor road surfaces, limited rail coverage, and scarce cold-chain assets constrain the reach of compound feeds beyond primary urban corridors. High axle-load enforcement in Kenya forces reloads into smaller trucks, increasing breakage risk for moisture-sensitive amino-acid sacks. As a result, feed costs in rural areas can run 12-18% higher than port-adjacent pricing, suppressing adoption rates among dispersed smallholders. Efforts by donor agencies to develop rural aggregation centers could narrow the gap, but without durable infrastructure investment, distribution bottlenecks will continue to weigh on the Africa Feed Amino Acids Market.
*Our forecasts treat driver/restraint impacts as directional, not additive. The impact forecasts reflect baseline growth, mix effects, and variable interactions.
Segment Analysis
By Additive: Lysine Dominance Drives Precision Nutrition
Lysine held a 32.6% market share of African feed amino acids in 2024, due to its status as the first limiting amino acid in most maize-based African diets. Methionine is projected to record the fastest growth at 3.6% CAGR, spurred by consumer demand for feather-intact broilers that rely on adequate sulfur-based amino acids for plumage quality. Feed mills that integrate lysine have reported profit margin gains of up to 4% because improved feed conversion lowers total feed cost per kilogram of weight gain. Threonine’s role as a gut-health enhancer drives higher inclusion in piglet and tilapia starter feeds, while tryptophan addresses stress-related feed intake declines in layers and grow-finisher pigs. The “other” category, which includes valine and isoleucine, is slowly expanding as formulation software recommends branched-chain amino acids to balance diets based on alternative protein sources such as sunflower and rapeseed meals.
Methionine is gradually eroding lysine’s historical dominance. Suppliers are bundling technical advisory packages that benchmark actual digestible amino-acid supply against theoretical requirements, persuading mills to adopt multi-amino-acid strategies that spread demand more evenly across the additive spectrum. Regional research centers have begun exploring recombinant fermentation pathways that use cassava substrate to cut production costs, opening the door for localized Africa Feed Amino Acids Market outputs over the long term.


By Animal: Poultry Sector Leads Consumption Patterns
Poultry represented 57.3% of the Africa feed amino acids market in 2024 because broiler and layer operations rely on precise amino-acid profiles to reach slaughter weights within 42 days and sustain egg-lay rates above 93% in peak cycles, while swine is projected to grow at the fastest CAGR of 4% through 2030. Large broiler integrators in Nigeria routinely blend six amino acids, while traders in Egypt and Kenya focus on two core products due to price sensitivity among smaller growers. Swine is the fastest-growing animal application, with a 4% CAGR, supported by commercial piggery expansions on the outskirts of Nairobi and Accra. Feed trials in Ghana have documented that optimized lysine and threonine levels can enable pigs to reach market four weeks earlier, an outcome that stimulates additional demand despite higher upfront costs.
Aquaculture still commands lower absolute volumes but exhibits double-digit volume growth as cage-based tilapia systems proliferate around Lake Volta and the Nile Delta. Ruminant demand remains concentrated in peri-urban dairies using rumen-protected lysine to raise milk yield by 1 liter per cow per day, but cost and limited availability restrict broader adoption. Smaller segments such as rabbit and guinea fowl are gaining momentum among entrepreneurs seeking niche protein avenues, providing a diversified albeit modest demand tail for the Africa Feed Amino Acids Market.

Geography Analysis
South Africa accounted for the majority of regional demand with nearly 41.5% share in 2024, and stands out as the fastest-growing market with a CAGR of 4.0% as county governments co-finance feed projects and enforce quality standards that favor branded amino-acid products. The region combines modern feed technology with diversified livestock, resulting in steady but mature growth patterns, while still offering premium niches for protected amino acids aimed at high-yield dairy herds.
Nigeria alone is absorbing close to one-quarter of total volume on the back of its large population and rapid feed-mill capacity expansion. Nigeria’s poultry hubs in Oyo and Ogun states operate mills capable of producing 30 tons per hour, anchoring bulk amino-acid imports that cascade to smaller mills through sub-distribution agreements. Egypt follows as a leading consumer, leveraging its established fish farming clusters in Kafr El-Sheikh to stabilize methionine uptake for catfish and mullet diets. In Kenya, the elevation of inland fish ponds across Kisumu requires nutrient-dense extruded feeds, pushing distributor volumes higher.
The rest of Africa, covering Ghana, Rwanda, and Uganda, presents fragmented yet promising pockets. Ghana benefits from port logistics in Tema that reduce landed costs, whereas Rwanda’s landlocked status necessitates strong regional trade corridors to secure amino-acid deliveries. Implementation of the African Continental Free Trade Area deal is expected to streamline cross-border flows, gradually smoothing price disparities and fostering deeper penetration of the Africa Feed Amino Acids Market into secondary cities and remote farming belts.
Competitive Landscape
The Africa feed amino acids market remains highly fragmented; the top five suppliers capture less than 22.2% of sales, underscoring significant headroom for both multinational and local players. IFF’s Danisco Animal Nutrition division leads the market, relying on technical service teams that guide customers in applying matrix values to optimize additive inclusion. Nutreco’s Trouw Nutrition brand is strengthened by its blend-to-order plant in Nairobi, which slashes delivery times for customized premixes. Evonik’s share is maintained through dedicated distribution partnerships in Lagos and Cairo, which combine amino-acid deliveries with gut-health products, offering bundling advantages.
Strategic moves revolve around capacity and technology. Evonik trimmed costs by upgrading its Belgian threonine plant to membrane filtration, allowing price flexibility in Africa despite currency slides. CJ CheilJedang’s divestiture of its bio business has redrawn global capacity maps, enabling remaining producers to capture incremental share in West Africa, where supply previously lagged. Disruptive entrants include AgriProtein, whose insect meal plants advertise amino-acid profiles that match those of fishmeal, posing a substitution threat that established firms now closely monitor.
Pricing strategies remain dynamic as suppliers tie contract terms to international methionine and lysine reference indices published in Asia and Europe. Firms with forward warehousing in Mombasa and Durban can stage inventory to hedge currency volatility, offering delivered-at-place quotes in local currencies that mitigate client risk. Technical support differentiates top players, with service labs in Accra and Johannesburg delivering near-infrared spectroscopy analysis that guides real-time diet reformulations for customers across the Africa feed amino acids market. [3]Source: Federal Register, “Food Additives Permitted in Feed and Drinking Water of Animals,” federalregister.gov
Africa Feed Amino Acids Industry Leaders
Adisseo
Archer Daniel Midland Co.
Evonik Industries AG
IFF(Danisco Animal Nutrition)
SHV (Nutreco NV)
- *Disclaimer: Major Players sorted in no particular order

Recent Industry Developments
- May 2025: Kemin Industries, a global leader in ingredient manufacturing, has bolstered its presence in animal health innovation by acquiring Bactana, a research-focused firm specializing in intestinal health and fermentation technology.
- January 2025: Evonik Industries reported margin improvements in its essential amino-acid division, crediting process optimizations that cut specific energy consumption by 14%. The firm pledged to roll out mobile advisory units in Africa to reinforce market presence.
- June 2024: As IFF broadens its poultry solutions rollout in the EU, the company highlights that its two newly sanctioned offerings, Axtra XAP and Syncra AVI, enhance both technical and economic performance in poultry feeds.


Africa Feed Amino Acids Market Report Scope
| Lysine |
| Methionine |
| Threonine |
| Tryptophan |
| Other Amino Acids |
| Aquaculture | By Sub Animal | Fish |
| Shrimp | ||
| Other Aquaculture Species | ||
| Poultry | By Sub Animal | Broiler |
| Layer | ||
| Other Poultry Birds | ||
| Ruminants | By Sub Animal | Beef Cattle |
| Dairy Cattle | ||
| Other Ruminants | ||
| Swine | ||
| Other Animals |
| Egypt |
| Kenya |
| South Africa |
| Rest of Africa |
| Sub Additive | Lysine | ||
| Methionine | |||
| Threonine | |||
| Tryptophan | |||
| Other Amino Acids | |||
| Animal | Aquaculture | By Sub Animal | Fish |
| Shrimp | |||
| Other Aquaculture Species | |||
| Poultry | By Sub Animal | Broiler | |
| Layer | |||
| Other Poultry Birds | |||
| Ruminants | By Sub Animal | Beef Cattle | |
| Dairy Cattle | |||
| Other Ruminants | |||
| Swine | |||
| Other Animals | |||
| Country | Egypt | ||
| Kenya | |||
| South Africa | |||
| Rest of Africa | |||


Market Definition
- FUNCTIONS - For the study, feed additives are considered to be commercially manufactured products that are used to enhance characteristics such as weight gain, feed conversion ratio, and feed intake when fed in appropriate proportions.
- RESELLERS - Companies engaged in reselling feed additives without value addition have been excluded from the market scope, to avoid double counting.
- END CONSUMERS - Compound feed manufacturers are considered to be end-consumers in the market studied. The scope excludes farmers buying feed additives to be used directly as supplements or premixes.
- INTERNAL COMPANY CONSUMPTION - Companies engaged in the production of compound feed as well as the manufacturing of feed additives are part of the study. However, while estimating the market sizes, the internal consumption of feed additives by such companies has been excluded.
| Keyword | Definition |
|---|---|
| Feed additives | Feed additives are products used in animal nutrition for purposes of improving the quality of feed and the quality of food from animal origin, or to improve the animals’ performance and health. |
| Probiotics | Probiotics are microorganisms introduced into the body for their beneficial qualities. (It maintains or restores beneficial bacteria to the gut). |
| Antibiotics | Antibiotic is a drug that is specifically used to inhibit the growth of bacteria. |
| Prebiotics | A non-digestible food ingredient that promotes the growth of beneficial microorganisms in the intestines. |
| Antioxidants | Antioxidants are compounds that inhibit oxidation, a chemical reaction that produces free radicals. |
| Phytogenics | Phytogenics are a group of natural and non-antibiotic growth promoters derived from herbs, spices, essential oils, and oleoresins. |
| Vitamins | Vitamins are organic compounds, which are required for normal growth and maintenance of the body. |
| Metabolism | A chemical process that occurs within a living organism in order to maintain life. |
| Amino acids | Amino acids are the building blocks of proteins and play an important role in metabolic pathways. |
| Enzymes | Enzyme is a substance that acts as a catalyst to bring about a specific biochemical reaction. |
| Anti-microbial resistance | The ability of a microorganism to resist the effects of an antimicrobial agent. |
| Anti-microbial | Destroying or inhibiting the growth of microorganisms. |
| Osmotic balance | It is a process of maintaining salt and water balance across membranes within the body's fluids. |
| Bacteriocin | Bacteriocins are the toxins produced by bacteria to inhibit the growth of similar or closely related bacterial strains. |
| Biohydrogenation | It is a process that occurs in the rumen of an animal in which bacteria convert unsaturated fatty acids (USFA) to saturated fatty acids (SFA). |
| Oxidative rancidity | It is a reaction of fatty acids with oxygen, which generally causes unpleasant odors in animals. To prevent these, antioxidants were added. |
| Mycotoxicosis | Any condition or disease caused by fungal toxins, mainly due to contamination of animal feed with mycotoxins. |
| Mycotoxins | Mycotoxins are toxin compounds that are naturally produced by certain types of molds (fungi). |
| Feed Probiotics | Microbial feed supplements positively affect gastrointestinal microbial balance. |
| Probiotic yeast | Feed yeast (single-cell fungi) and other fungi used as probiotics. |
| Feed enzymes | They are used to supplement digestive enzymes in an animal’s stomach to break down food. Enzymes also ensure that meat and egg production is improved. |
| Mycotoxin detoxifiers | They are used to prevent fungal growth and to stop any harmful mold from being absorbed in the gut and blood. |
| Feed antibiotics | They are used both for the prevention and treatment of diseases but also for rapid growth and development. |
| Feed antioxidants | They are used to protect the deterioration of other feed nutrients in the feed such as fats, vitamins, pigments, and flavoring agents, thus providing nutrient security to the animals. |
| Feed phytogenics | Phytogenics are natural substances, added to livestock feed to promote growth, aid in digestion, and act as anti-microbial agents. |
| Feed vitamins | They are used to maintain the normal physiological function and normal growth and development of animals. |
| Feed flavors and sweetners | These flavors and sweeteners help to mask tastes and odors during changes in additives or medications and make them ideal for animal diets undergoing transition. |
| Feed acidifiers | Animal feed acidifiers are organic acids incorporated into the feed for nutritional or preservative purposes. Acidifiers enhance congestion and microbiological balance in the alimentary and digestive tracts of livestock. |
| Feed minerals | Feed minerals play an important role in the regular dietary requirements of animal feed. |
| Feed binders | Feed binders are the binding agents used in the manufacture of safe animal feed products. It enhances the taste of food and prolongs the storage period of the feed. |
| Key Terms | Abbreviation |
| LSDV | Lumpy Skin Disease Virus |
| ASF | African Swine Fever |
| GPA | Growth Promoter Antibiotics |
| NSP | Non-Starch Polysaccharides |
| PUFA | Polyunsaturated Fatty Acid |
| Afs | Aflatoxins |
| AGP | Antibiotic Growth Promoters |
| FAO | The Food And Agriculture Organization of the United Nations |
| USDA | The United States Department of Agriculture |


Research Methodology
Mordor Intelligence follows a four-step methodology in all our reports.
- Step-1: IDENTIFY KEY VARIABLES: In order to build a robust forecasting methodology, the variables and factors identified in Step-1 are tested against available historical market numbers. Through an iterative process, the variables required for market forecast are set and the model is built on the basis of these variables.
- Step-2: Build a Market Model: Market-size estimations for the forecast years are in nominal terms. Inflation is not a part of the pricing, and the average selling price (ASP) is kept constant throughout the forecast period.
- Step-3: Validate and Finalize: In this important step, all market numbers, variables and analyst calls are validated through an extensive network of primary research experts from the market studied. The respondents are selected across levels and functions to generate a holistic picture of the market studied.
- Step-4: Research Outputs: Syndicated Reports, Custom Consulting Assignments, Databases & Subscription Platforms


