
Market Overview
| Study Period | 2021 - 2031 |
|---|---|
| Forecast Data Period | 2026 - 2031 |
| Base Year Market Size (2025) | USD 15.18 Million |
| Market Size (2026) | USD 16.01 Million |
| Market Size (2031) | USD 20.91 Million |
| Growth Rate (2026 - 2031) | 5.48 % |
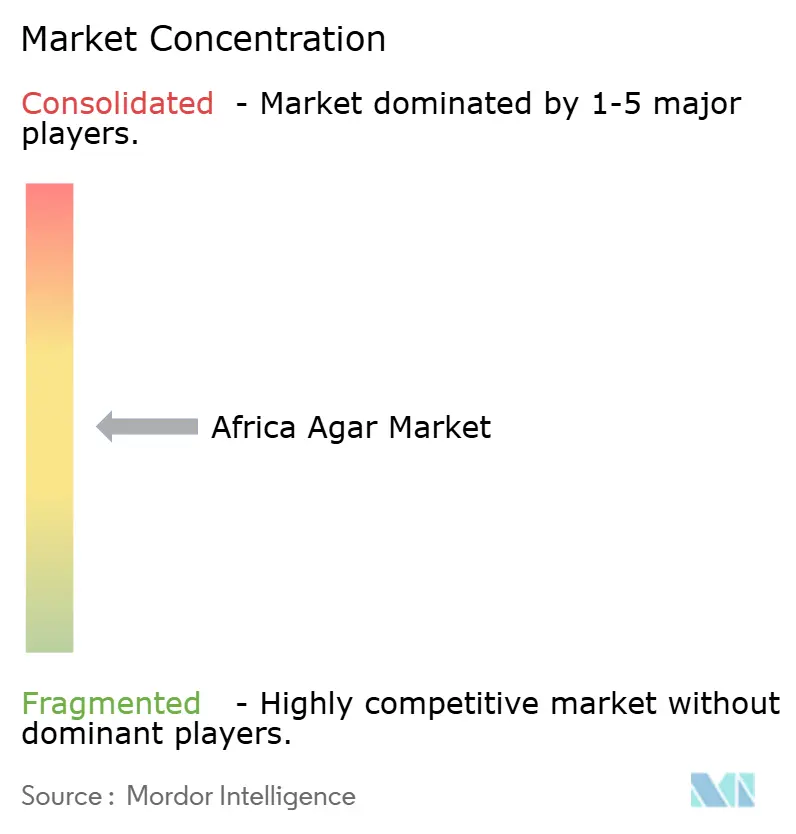
| Market Concentration | Medium |
Major Players
*Disclaimer: Major Players sorted in no particular order Image © Mordor Intelligence. Reuse requires attribution under CC BY 4.0. |
|
Africa Agar Market Analysis by Mordor Intelligence
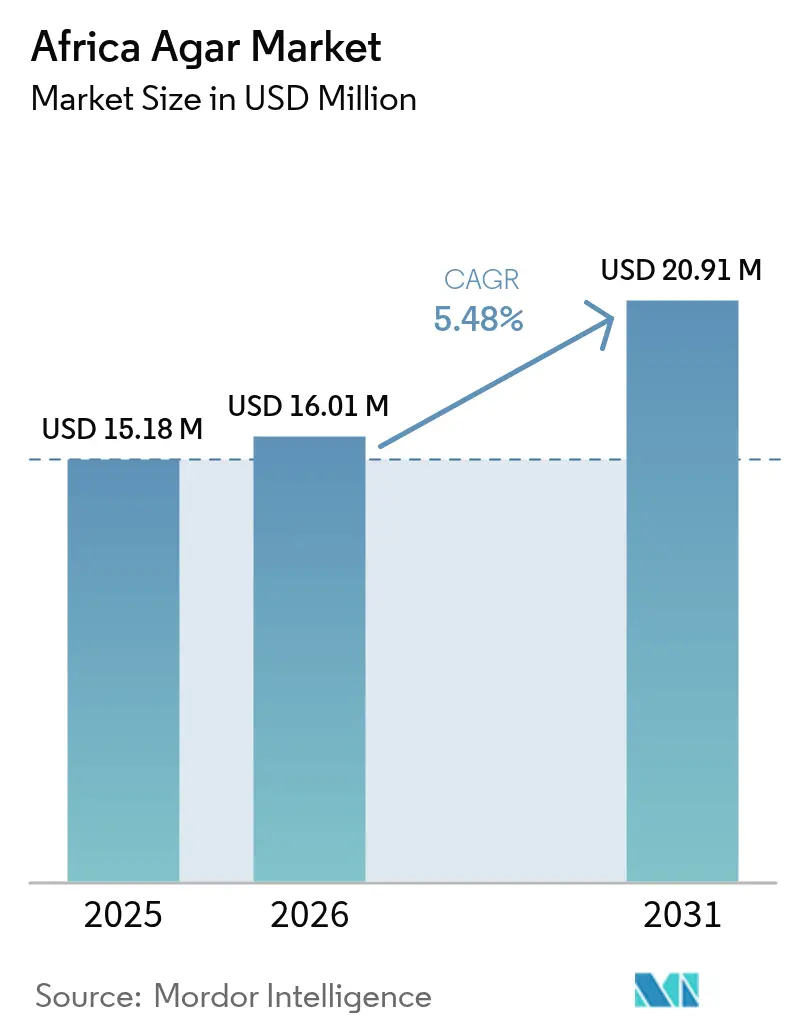
The Africa agar market size was valued at USD 15.18 million in 2025 and estimated to grow from USD 16.01 million in 2026 to reach USD 20.91 million by 2031, at a CAGR of 5.48% during the forecast period (2026-2031). This growth is driven by increasing adoption of plant-based products across food, pharmaceutical, and cosmetic industries, coupled with urbanization and the expansion of laboratory networks. However, the market faces challenges such as limited local seaweed supply, high freight costs, and competition from carrageenan and pectin blends. Despite these obstacles, factors such as efficient distribution through South African trade hubs, rising halal product demand in Nigeria and Egypt, and pharmaceutical self-sufficiency initiatives are expected to mitigate these challenges and support the market's medium-term growth prospects.
Key Report Takeaways
- By form, the powder form captured 66.65% of the Africa agar market share in 2025 and is projected to advance at a 6.62% CAGR through 2031.
- By application, food and beverage dominated with a 61.90% share in 2025, while pharmaceuticals led growth at a 7.05% CAGR for 2026-2031.
- By geography, South Africa commanded a 32.10% share in 2025; Nigeria posts the fastest country-level growth at a 5.92% CAGR over the forecast window.
Note: Market size and forecast figures in this report are generated using Mordor Intelligence’s proprietary estimation framework, updated with the latest available data and insights as of 2026.
Africa Agar Market Trends and Insights
Drivers Impact Analysis*
| Driver | (~) % Impact on CAGR Forecast | Geographic Relevance | Impact Timeline |
|---|---|---|---|
| Food and beverage fortification leveraging agar's calcium and iron content | +0.6% | Pan-African, with concentration in Nigeria, Egypt, South Africa | Medium term (2-4 years) |
| Sustainability push for seaweed aquaculture in Morocco and Tanzania | +0.5% | Morocco (Atlantic coast), Tanzania (Zanzibar), Madagascar | Long term (≥4 years) |
| Rising vegan and halal food demand across urban Africa | +0.8% | Nigeria, Egypt, South Africa, Kenya, Ghana | Short term (≤2 years) |
| Trade-hub positioning of South Africa for regional distribution | +0.4% | South Africa (primary), SADC member states | Medium term (2-4 years) |
| Shift toward clean-label natural food stabilizers | +0.7% | South Africa, Egypt, Nigeria, Kenya | Short term (≤2 years) |
| Expansion of artisanal cosmetics and skincare utilizing natural thickeners | +0.5% | South Africa, Nigeria, Kenya, Morocco | Medium term (2-4 years) |
| Source: Mordor Intelligence | |||
Food and beverage fortification leveraging agar's calcium and iron content
Agar's mineral composition makes it a versatile ingredient for fortified food formulations aimed at addressing micronutrient deficiencies in Sub-Saharan Africa. In this region, over 60% of children under five are affected by iron-deficiency anemia, and calcium intake remains below recommended levels in several countries. The World Health Organization's fortification initiatives, such as mandatory wheat flour fortification in Nigeria and voluntary dairy fortification in South Africa, have increased the demand for multi-functional hydrocolloids. These hydrocolloids must enhance texture, extend shelf life, and provide nutritional benefits without compromising sensory qualities. Derived from the cell walls of red algae, often harvested in African waters, agar contains approximately 0.5–0.63% calcium and 0.013–0.021% iron by dry weight, depending on the species and processing methods. These mineral properties make agar a valuable complementary fortificant in products such as jellies, dairy desserts, and beverage suspensions, offering both nutritional enrichment and functional benefits. Additionally, Nigeria's National Agency for Food and Drug Administration and Control has emphasized biofortification and fortification as key strategies under the National Food Safety Policy, potentially paving the way for broader regulatory acceptance of agar-fortified products.
Sustainability push for seaweed aquaculture in Morocco and Tanzania
Morocco's 3,500-kilometer Atlantic coastline and Tanzania's Zanzibar archipelago have become key areas for seaweed aquaculture development, supported by international donor programs and private-sector initiatives focused on sustainable marine ingredients. The GlobalSeaweedSTAR program, a four-year initiative led by the Scottish Association for Marine Science and funded by UK Research and Innovation, has implemented projects in Tanzania and Madagascar to address disease management, strain improvement, and farmer livelihoods. Notably, over 80% of Tanzania's more than 20,000 seaweed farmers are women [1]Source: UKRI, "GCRF GlobalSeaweed* - Safeguarding the future of seaweed aquaculture in developing countries," gtr.ukri.org. Tanzania's seaweed industry, traditionally centered on exporting dried red algae (primarily Eucheuma denticulatum and Kappaphycus alvarezii) for carrageenan extraction, continues to face challenges such as outbreaks of ice-ice disease, fluctuating market prices, and limited value-added infrastructure [2]Source: World Bank, "SEAWEED POWER UNLOCKING TANZANIA’S POTENTIAL FOR SUSTAINABLE GROWTH AND CLIMATE ACTION," worldbank.org. A significant portion of the output is still exported as raw dried seaweed rather than processed products. Efforts to shift toward Gracilaria cultivation for agar production are in the early stages, hindered by issues such as limited seed stock availability, insufficient farmer training, and the lack of local extraction facilities. However, pilot projects led by Aqua Farms Organization and the University of Dar es Salaam are making progress in advancing disease diagnostics and biosecurity protocols.
Rising vegan and halal food demand across urban Africa
Urbanization and increasing middle-class incomes in Nigeria, Egypt, Kenya, and South Africa are driving demand for plant-based and halal-certified food products. This trend is boosting the use of agar as a gelatin substitute in confectionery, dairy alternatives, and bakery applications. Agar's plant-based origin and lack of animal-derived components make it suitable for both vegan and halal dietary requirements, unlike bovine or porcine gelatin, which faces religious and ethical objections in predominantly Muslim markets such as Nigeria (53% Muslim population) and Egypt (90% Muslim population). In South Africa, the retail sector has seen a rise in plant-based dairy alternatives, with local manufacturers using agar and other hydrocolloids to replicate the viscosity and mouthfeel of yogurt without dairy proteins, catering to lactose-intolerant consumers and flexitarians. Nigeria's food processing industry, which has attracted investments from Swiss pharmaceutical and food ingredient companies such as Nestlé and Novartis subsidiaries, is advancing in formulation capabilities, with agar being utilized in halal-certified confectionery and beverage stabilization applications.
Trade-hub positioning of South Africa for regional distribution
South Africa's strong position in regional agro-processing trade is supported by its advanced logistics infrastructure, established distributor networks, and ISO-compliant quality systems, making it a key entry point for agar imports into the Southern African Development Community (SADC) region. A 2020 UNU-WIDER analysis highlighted South Africa's significant regional trade surplus in manufactured goods, with intra-regional trade driven primarily by South African exports. In contrast, smaller economies face challenges due to tariff barriers, weak infrastructure, and stringent quality standards [3]Source: UNU Wider, "Agro-processing, value chains, and regional integration in Southern Africa," wider.unu.edu. Distributors like Angstrom Scientific and suppliers such as PT Misefa Agro Raya (Indonesia) use 30-45 day shipping routes from Asian hubs to Durban and Cape Town, followed by road distribution to Botswana, Namibia, Zimbabwe, and Zambia, with delivery times of 3-6 weeks [4]Source: Misefa, "Premium Seaweed Products Supplier," misefa.com. The African Continental Free Trade Area's Guided Trader Initiative, which enabled Nigeria's first intra-African shipment to Kenya in July 2024, shows potential for reducing customs challenges and harmonizing standards, though implementation remains uneven across member states.
Restraints Impact Analysis*
| Restraint | (~) % Impact on CAGR Forecast | Geographic Relevance | Impact Timeline |
|---|---|---|---|
| High import dependency raising raw material costs | -0.6% | Pan-African, acute in landlocked markets | Short term (≤2 years) |
| Competition from cheaper carrageenan and pectin blends | -0.5% | Nigeria, Egypt, South Africa, Kenya | Short term (≤2 years) |
| Stringent food safety regulations compliance costs | -0.3% | South Africa, Egypt, Nigeria, Kenya | Medium term (2-4 years) |
| Limited local seaweed processing infrastructure | -0.4% | Tanzania, Morocco, Madagascar | Long term (≥4 years) |
| Source: Mordor Intelligence | |||
High import dependency raising raw material costs
Africa's agar supply chain relies heavily on imports, with over 85% of its hydrocolloid needs sourced from Asian producers, including China, Indonesia, and Chile. This dependency exposes buyers to currency fluctuations, shipping cost volatility, and supply chain disruptions. The pharmaceutical industry imports over 70% of its medicines and raw materials, with a similar reliance on specialty food ingredients, such as agar. Currency depreciation in key markets, such as Nigeria's naira losing over 40% against the US dollar between 2023 and 2024, and Egypt's pound devaluation, has increased costs for dollar-denominated agar imports, reducing margins for food processors and pharmaceutical manufacturers. Tanzania's seaweed aquaculture sector, which produces over 25,000 metric tonnes annually, exports dried seaweed for processing in Asia instead of establishing local agar extraction facilities, thereby sustaining import dependency and limiting value addition.
Competition from cheaper carrageenan and pectin blends
Agar faces ongoing price competition from carrageenan and pectin, which provide similar gelling and stabilizing properties at 20-50% lower costs per kilogram. This is particularly significant in price-sensitive food applications such as confectionery, dairy, and beverages. Tanzania's seaweed industry, primarily producing Eucheuma and Kappaphycus species, supplies raw materials for carrageenan production to Asian processors. These processors export refined carrageenan back to African markets at prices typically 30-40% lower than agar on a functional equivalence basis. Carrageenan's effectiveness in dairy applications, where it interacts with milk proteins to enhance creaminess and prevent syneresis, makes it the preferred hydrocolloid for products like yogurt, chocolate milk, and ice cream. This limits agar's use to niche applications where its high gel strength or thermal reversibility justifies its premium pricing. Pectin, derived from citrus peels and apple pomace, benefits from established supply chains tied to fruit processing industries in South Africa, Egypt, and Morocco. However, African pectin production remains relatively small compared to European and Latin American sources.
*Our forecasts treat driver/restraint impacts as directional, not additive. The impact forecasts reflect baseline growth, mix effects, and variable interactions.
Segment Analysis
By Form: Powder Extends Lead Amid Laboratory and Food Demand
Powder is projected to account for 66.65% of the Africa agar market share in 2025, with a compound annual growth rate (CAGR) of 6.62% through 2031. This growth reflects consistent demand from diagnostic laboratories, confectionery production lines, and capsule manufacturers. Bacteriological-grade agar, offering a gel strength of 600-1,200 g/cm², aligns with microbiology protocols established by WHO reference laboratories. Additionally, its rapid hydration properties support high-throughput dairy operations in Gauteng, where agar is dosed at 2-3 kilograms per tonne of yogurt base.
Strips and flakes maintain a niche presence, primarily among artisanal confectioners and culinary schools. Demand for strips persists in home-baking channels due to their visual dissolution assurance and availability in smaller pack sizes. However, the rise of supermarket chains stocking pre-hydrated dessert mixes is reducing the reliance on manual strip usage. The growing preference for powdered agar reflects broader industrial scaling trends within the Africa agar market.




By Application: Pharmaceuticals Lead Growth on Localization Policies
The food and beverage segment accounted for 61.90% of the 2025 revenue, driven by demand for gelatin-free candies, dairy desserts, and juice clarification. This dominance is attributed to the increasing consumer preference for plant-based and clean-label products, which has boosted the adoption of agar as a key ingredient in these applications. However, the pharmaceuticals segment is projected to achieve the highest CAGR of 7.05% through 2031, supported by initiatives in Egypt, Nigeria, and Kenya to promote local production of active ingredients and excipients. These efforts are further bolstered by government incentives and investments aimed at reducing dependency on imports. Facility expansions, such as Egypt's USD 150-200 million raw material plant, are expected to ensure a steady supply of agarose, meeting the growing demand in pharmaceutical formulations.
Cosmetics applications, while smaller in scale, benefit from growing consumer interest in natural thickeners. The increasing awareness of sustainable and vegan-friendly products has driven the use of agar in cosmetics. Viscosity requirements of 4,000-6,000 cP at 20 °C are achieved with 0.3-0.7% agar inclusion, making it suitable for vegan face masks and hair gels. Other applications, including biotechnology and dental molds, are experiencing gradual adoption, particularly where precision gels are essential for processes such as cell culture and dental impressions. Collectively, these diversified applications help stabilize demand and expand the revenue base of the African agar industry over the forecast period.
Geography Analysis
South Africa accounted for 32.10% of the 2025 revenue, supported by efficient port infrastructure, ISO-certified distributors, and well-established food-processing clusters. Major dairy and confectionery exporters in the region utilize traceable agar lots, ensuring consistent demand and reinforcing the reliability of supply chains. These factors position South Africa as a key player in the Africa agar market. Nigeria follows with rapid growth, projected at a 5.92% CAGR through 2031, driven by the expansion of the halal market, customs reforms, and increased pharmaceutical investments. The agar market size in Nigeria is expected to double between 2025 and 2030, supported by rising plant-based confectionery production and growing consumer demand for sustainable and traceable ingredients.
Egypt benefits from strategic initiatives in the pharmaceutical sector and access to Middle Eastern export corridors, which enhance its position in the regional market. While currency depreciation has increased import costs, government co-investment in excipient manufacturing plants helps mitigate supply chain risks and ensures a steady supply of raw materials. The rest of Africa, including countries like Kenya, Ghana, Tanzania, and Morocco, exhibits varied levels of agar adoption. Tanzania’s 25,426-tonne seaweed harvest highlights its raw material potential; however, gaps in extraction capabilities keep agar imports high, limiting local production. Morocco’s coastal regions provide Gelidium and Gracilaria biomass, with pilot farms aiming to produce 1,500 tonnes of fresh weight by 2027, which could contribute to reducing dependency on imports and boosting local agar production.
Inter-African trade liberalization remains inconsistent, presenting both challenges and opportunities for the agar market. A guided-trader shipment in July 2024 demonstrated the feasibility of tariff-free movement, but differences in additive registries and regulatory frameworks continue to delay border clearances, hindering seamless trade. Streamlining customs documentation, implementing digital single-window systems, and achieving mutual recognition of ISO certifications could significantly improve logistics, reduce trade barriers, and strengthen the agar market across landlocked economies in Africa. These measures would not only enhance market efficiency but also foster greater regional integration and economic growth.
Regulatory Landscape
Agar is regulated as a food additive (INS 406), and its use across Africa largely tracks Codex Alimentarius alignment through the General Standard for Food Additives (GSFA), which permits agar under Good Manufacturing Practice across multiple food categories. In Middle East and North Africa trade corridors that feed African imports, Gulf Standardization Organization work on additive lists, including the GSO 2500:2025 project on additives permitted for use in foodstuffs, supports a Codex and JECFA-referenced framework that suppliers use to support cross-border dossiers and halal-compliant product positioning.
At the country level, compliance is shaped by national additive regulations and product-specific compulsory specifications. South Africa published updated Regulations Relating to the Use of Food Additives in Foodstuffs in November 2024, tightening documentation and category compliance requirements for importers and local processors, while separate compulsory specifications can define maximum use limits in specific foods, including a 1% by mass limit for agar-agar in certain canned meat products. Regional standards bodies such as the African Organisation for Standardisation (ARSO) TC 08 on food additives provide a platform for harmonization efforts that affect labeling, permitted-use lists, and testing expectations for agar used in food, pharmaceutical, and cosmetics supply chains.
Value Chain Analysis
The Africa agar value chain remains import-led for refined agar and agarose, while upstream seaweed biomass production is concentrated in coastal East Africa. Cultivation is dominated by smallholder nearshore farming, notably in Tanzania and Zanzibar, where dried red seaweed is typically sold through aggregators and traders and then exported for processing. This structure limits domestic value addition for agar extraction.
Downstream, refined agar is imported mainly from Asian and European producers and distributed through regional hubs, with South Africa functioning as a key logistics and redistribution node into SADC markets via Durban and Cape Town corridors. Industrial users span food and beverage manufacturers (confectionery, dairy alternatives, beverage stabilization), pharmaceutical and laboratory buyers (bacteriological agar and agarose grades), and cosmetics producers using agar as a natural thickener. The chain is exposed to freight and transit-time volatility through maritime chokepoints affecting MEA-bound ingredients, which increases working-capital needs for importers and encourages dual-sourcing, larger safety stocks, and selective localization efforts where seaweed production and policy support intersect. Programs launched during 2024-2025, including a UN-backed seaweed farming transformation program in Zanzibar (USD 1.965 million, targeting 15,000 households) and the Zanzibar Maisha Bora Foundation Seaweed Socio-Enterprise Programme with the Ministry of Blue Economy and Fisheries, are intended to improve production practices, quality, and market access, helping to raise the consistency of feedstock entering higher-value processing.
Competitive Landscape
The Africa agar market is moderately fragmented, with leading international producers, Hispanagar, CP Kelco, Green Fresh Group, and Cargill, supplying through distributors in South Africa and Egypt. Certifications such as ISO 22000, FSSC 22000, halal, and kosher are essential baseline requirements for market entry. Hispanagar upgraded its Burgos facility in 2025, incorporating renewable energy and AI-guided process controls to cut emissions and unit costs.
Asian producers utilize integrated seaweed farming to offer agar at prices 20-40% lower than European grades, securing high-volume contracts in the confectionery segment. CP Kelco and Cargill differentiate themselves through stability data and localized formulation support, particularly in dairy and beverage applications. Thermo Fisher Scientific and Lonza dominate the laboratory agarose segment with specialized low-endotoxin grades, capturing premium margins despite small volumes.
Emerging technologies, such as direct-extraction methods that eliminate the need for freeze-thaw cycles, are gaining attention. For instance, the Vietnam Academy of Science and Technology demonstrated such a method in 2024. If adopted, these technologies could lower capital barriers for African processors, fostering localized refining. Additionally, donor programs in Tanzania and Madagascar aim to stabilize crop quality and improve disease management, potentially strengthening raw material supply chains within the Africa agar market over the long term.
Africa Agar Industry Leaders
-
Hispanagar SA
-
Agarmex S.A.
-
Meron Group
-
Merck KGaA
-
NOREVO GmbH
- *Disclaimer: Major Players sorted in no particular order

Market Opportunities and Future Outlook
The clearest whitespace sits in local and regional value addition that converts Africa-produced red seaweed into higher-value hydrocolloids, rather than exporting dried biomass. Morocco demonstrated movement in this direction when Setexam inaugurated an agar-agar production line in Kénitra in January 2025 (MAD 60 million). That added capacity can shorten lead times for regional food, pharmaceutical, and cosmetics users who otherwise rely on imports routed through South Africa and Middle Eastern trade lanes.
In East Africa, policy and project activity points to a developing processing ecosystem for seaweed, which is relevant for agar feedstock and for substituting imported hydrocolloids in niche applications. In June 2026, Tanzania unveiled an initiative focused on seaweed processing infrastructure and tax relief for farming inputs, including boats, ropes, and drying equipment, and UNCDF activity in Tanga (Mkinga district) includes establishing a seaweed processing plant to support local value addition. Financing and capability-building mechanisms, such as the Africa Fair Seaweed Finance Facility targeting USD 50 million in private-sector financing for female farmers (2024-2028), are intended to improve input quality and aggregation, while downstream users in halal and plant-based foods, plus expanding laboratory networks, provide pull for consistent, specification-grade agar and agarose.
Recent Industry Developments
- June 2026: Tanzania announced a seaweed-focused initiative that includes support for processing infrastructure and tax relief on key farming inputs such as boats, ropes, and drying equipment. The policy emphasis strengthens the operating environment for higher-value seaweed derivatives, including agar, by lowering bottlenecks at the farm and post-harvest stages.
- January 2025: Setexam inaugurated an agar-agar production line in Kénitra, Morocco, backed by an investment of 60 million Moroccan dirhams. The commissioning adds regional processing capacity and supports shorter, more controllable supply routes for food, pharmaceutical, and cosmetics users sourcing agar within Africa and nearby export corridors.
- September 2024: Zanzibar Seaweed Company (ZASCO) and Nutri-San Limited initiated construction of a seaweed processing plant on Pemba Island in the Zanzibar archipelago, with an investment of about TZS 7.4 billion (around USD 3 million) and a stated capacity of up to 30,000 tons per year. The project targets improved value capture from Zanzibar-grown seaweed and supports a larger, more organized feedstock base for ingredient-grade processing.


Research Methodology Framework and Report Scope
Market Definition and Coverage
This market counts the value of agar sold for use in Africa, including food thickening and gelling uses and lab and pharmaceutical grade uses where agar is the base material. Revenues are measured at the point of sale by suppliers and distributors into end users across the region.
Scope exclusions: This sizing excludes agar substitutes such as carrageenan and pectin blends, and it also excludes unrelated hydrocolloids that may be used for similar texture outcomes.
Segmentation Overview
-
By Form
- Powder
- Strips
- Flakes
-
By Application
- Food and Beverage
- Pharmaceuticals
- Cosmetics
- Other Applications
-
By Geography
- South Africa
- Egypt
- Nigeria
- Rest of Africa
Data Sources, Market Sizing, and Validation
Desk Research
Desk work starts with mapping the demand pool and supply availability so the model is anchored to real usage signals. We rely on public sources such as FAOSTAT for seaweed and algae context, UN Comtrade for trade flows where product coding allows, and national statistics offices in key countries for food manufacturing and pharma production indicators.
To make the numbers practical, we also review sources such as food additive standards and regulator guidance, trade and industry bodies in food processing, and peer reviewed papers that describe agar yields and typical use rates in formulations. Company annual reports, investor presentations, and press releases help confirm capacity changes, route to market, and pricing commentary. Where needed, paid subscriptions for company financials and shipment level import-export views are used to fill gaps in supplier coverage and to sanity check trade direction. These examples are not exhaustive, and many other public references were used for collection, validation, and clarification.
Primary Interviews and Surveys
Primary work is used to pressure test demand assumptions and pricing, because agar volumes and grades can differ by customer segment and country. We speak with a mix of importers, distributors, food ingredient buyers, and lab and pharma procurement contacts across Africa so regional variability is captured, and then the inputs are rechecked with a second set of subject experts when the first pass shows wide variance.
Distribution of primary research fieldwork respondents
| Company type | Respondent position |
|---|---|
| Top tier: 37% | CXOs: 12% |
| Mid tier: 44% | Functional/Unit leaders: 38% |
| Smaller Players: 19% | Managers: 50% |
Market-Sizing & Forecasting
Sizing is built using a top-down demand pool approach where food processing output, pharma and lab activity, and import dependency are translated into agar consumption. We then convert consumption into value using observed price bands by grade and form. After forming the main totals, we add selective bottom-up checks through supplier and distributor roll ups, channel checks in key countries, and sampled price per kilogram times estimated volumes, so the totals can be adjusted when the first cut appears too high or too low.
Key inputs include agar import volumes and unit values, local availability of seaweed feedstock and processing capacity signals, mix of food grade versus bacteriological grade usage, typical formulation inclusion rates in priority food categories, and freight and duties that influence landed prices. For forecasting, we run scenario analysis because supply conditions and logistics costs can shift, and the scenarios are tied to expected food manufacturing growth and replacement rates versus gelatin in specific uses. Where country level data is thin, we use proxy indicators from similar economies and then trim the output using interview based plausibility ranges.
Data Validation & Update Cycle
Outputs are cross-checked against independent signals such as trade direction, pricing movements, and the pace of end use growth in food and pharma. When a country shows an unusual jump, the assumptions are reopened, outliers are reviewed, and clarification calls are triggered before final sign off.
Each report goes through multi step analyst review so the math, sources, and logic stay consistent across the time series. The database is refreshed annually, and interim updates are made when material events occur such as capacity additions, regulation changes, or sustained currency shifts. Before delivery, we run a fresh review pass so the final numbers reflect the most recent public data and interview input.
Mordor Intelligence's Africa Agar Market Size Compared Against Other Published Estimates
Published market sizes for agar in Africa can look far apart even when they use similar forecast years, because the underlying region cut, product inclusions, and pricing basis are not always aligned. The biggest differences usually come from whether the study is strictly Africa-only or part of a wider MEA roll-up, and whether values are built from usage indicators or from broad supplier revenue allocations.
Carrageenan and pectin blends sit outside Mordor Intelligence's scope, which keeps the value tied to true agar demand rather than the wider hydrocolloid basket. That single exclusion explains a meaningful part of the spread you see across public figures.
Benchmark comparison
| Source | Market Size | Gaps in Research Methodology |
|---|---|---|
| Mordor Intelligence | USD 16.01 M (2026) | |
| Regional Consultancy A | USD 18.60 M (2026) | Often bundles agar with adjacent plant hydrocolloids sold through the same distributors, and it can apply an average price that reflects blended ingredients rather than agar-only grades. |
| Industry Publisher B | USD 187.40 M (2026) | Uses a Middle East and Africa roll-up that includes Gulf markets and a wider country set, which lifts the addressable demand pool well beyond Africa and can also mix food and industrial additive assumptions. |
The table shows that most of the gap is explained by scope first, especially when a wider MEA geography or a broader hydrocolloid basket is counted. By tying the model to import signals, realistic grade mix pricing, and end use demand checks, we keep the estimate traceable to clear variables that can be revisited each year as conditions change.


Key Questions Answered in the Report
What is the current Africa Agar Market size?
The Africa agar market was valued at USD 16.01 million in 2026 and is projected to reach USD 20.91 million by 2031, with a CAGR of 5.48% during the forecast period (2026-2031).
Which form of agar dominates the Africa market?
Powdered agar accounted for 66.65% of the Africa market share in 2025 and is projected to grow at a CAGR of 6.62% through 2031.
Which application segment is driving growth in Africa?
The food and beverage segment accounted for 61.90% of the market in 2025, while the pharmaceuticals segment is expected to achieve the highest CAGR of 7.05% during the forecast period from 2026 to 2031.
Which country lead the Africa agar market?
South Africa held the largest share at 32.10% in 2025.
Page last updated on:





