Aeroderivative Gas Turbine Market Size and Share
Market Overview
| Study Period | 2019 - 2030 |
|---|---|
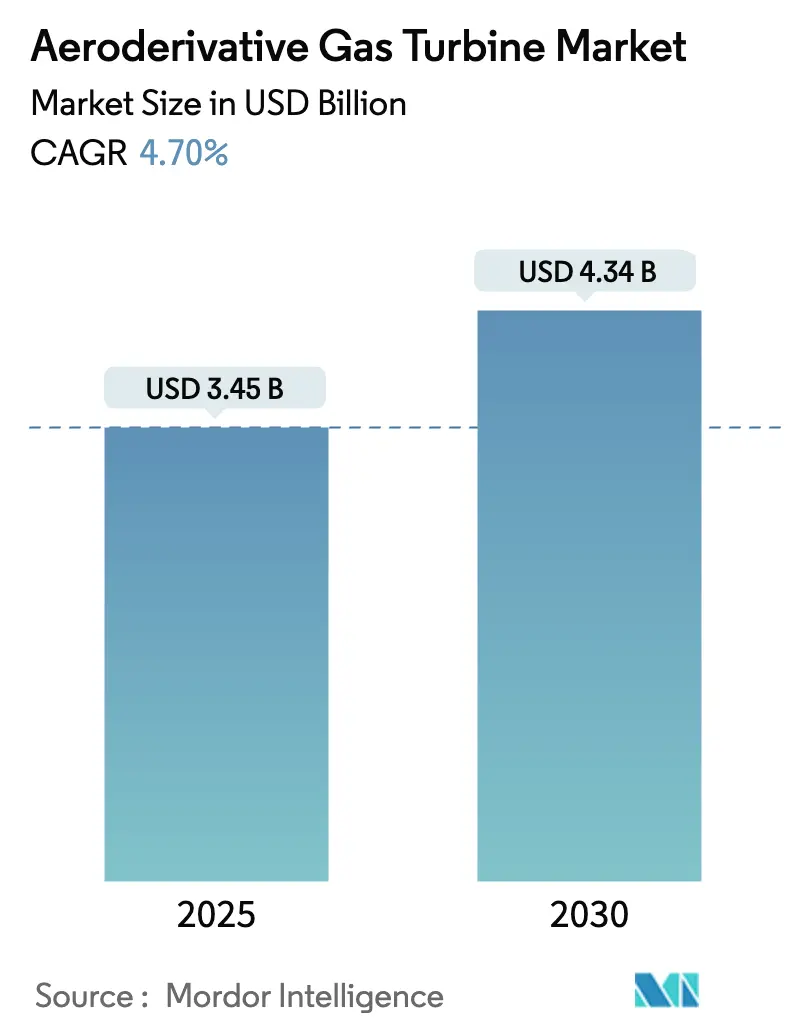
| Market Size (2025) | USD 3.45 Billion |
| Market Size (2030) | USD 4.34 Billion |
| Growth Rate (2025 - 2030) | 4.70% CAGR |
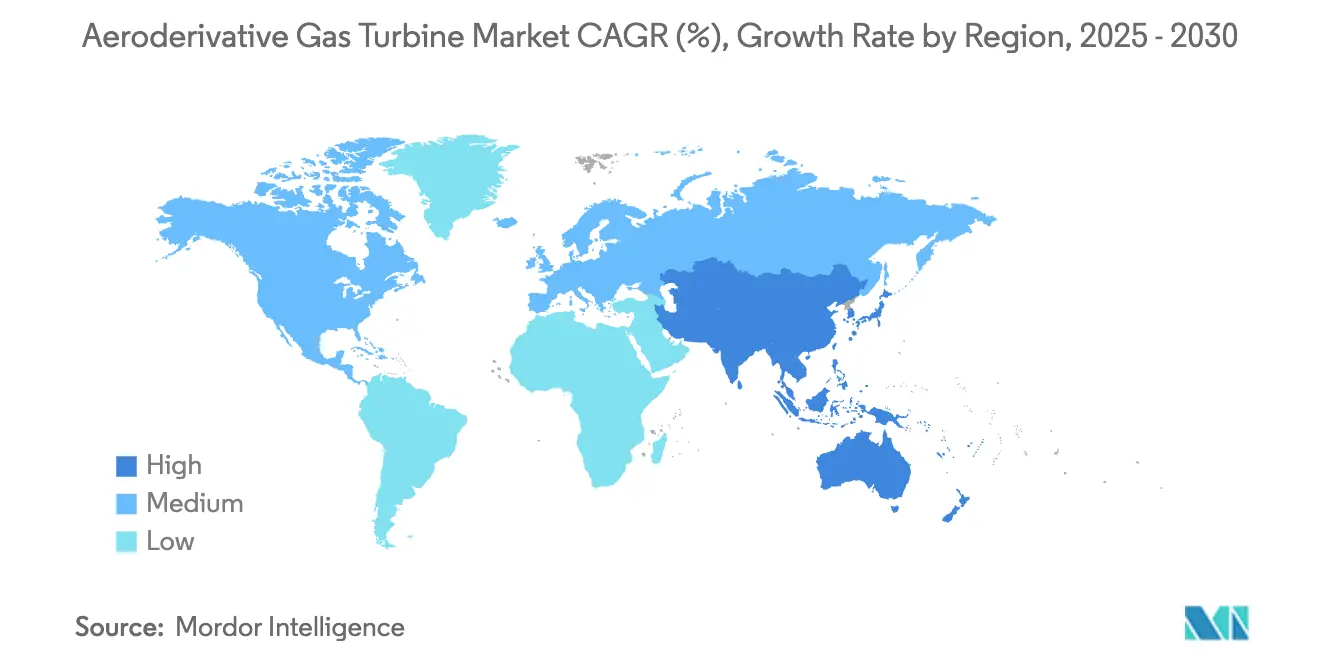
| Fastest Growing Market | Asia Pacific |
| Largest Market | North America |
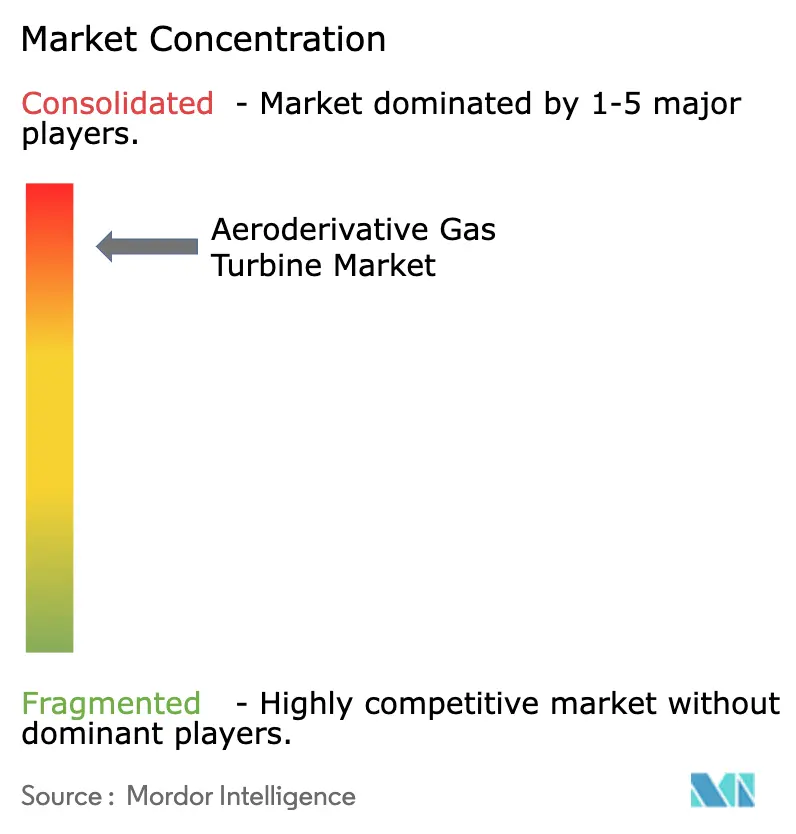
| Market Concentration | High |
Major Players *Disclaimer: Major Players sorted in no particular order Image © Mordor Intelligence. Reuse requires attribution under CC BY 4.0. | |
Aeroderivative Gas Turbine Market Analysis by Mordor Intelligence
The aeroderivative gas turbine market size stands at USD 3.45 billion in 2025 and is projected to reach USD 4.34 billion by 2030, advancing at a 4.70% CAGR. This expansion is underpinned by grid operators’ need for fast-start assets that can ramp within ten minutes, cycle repeatedly without efficiency losses, and help meet tightening emission limits. Aviation-derived cores give the equipment high power-to-weight ratios, allowing rapid deployment on constrained sites and offshore platforms. Operators also value the technology’s inherent fuel flexibility, with dual-fuel configurations enabling seamless shifts between natural gas, distillates, sustainable aviation fuel (SAF), and hydrogen blends. Competitive intensity remains high among a handful of aero-engine majors; however, players demonstrating validated hydrogen combustion and marinized variants are widening their lead in premium niches.
Key Report Takeaways
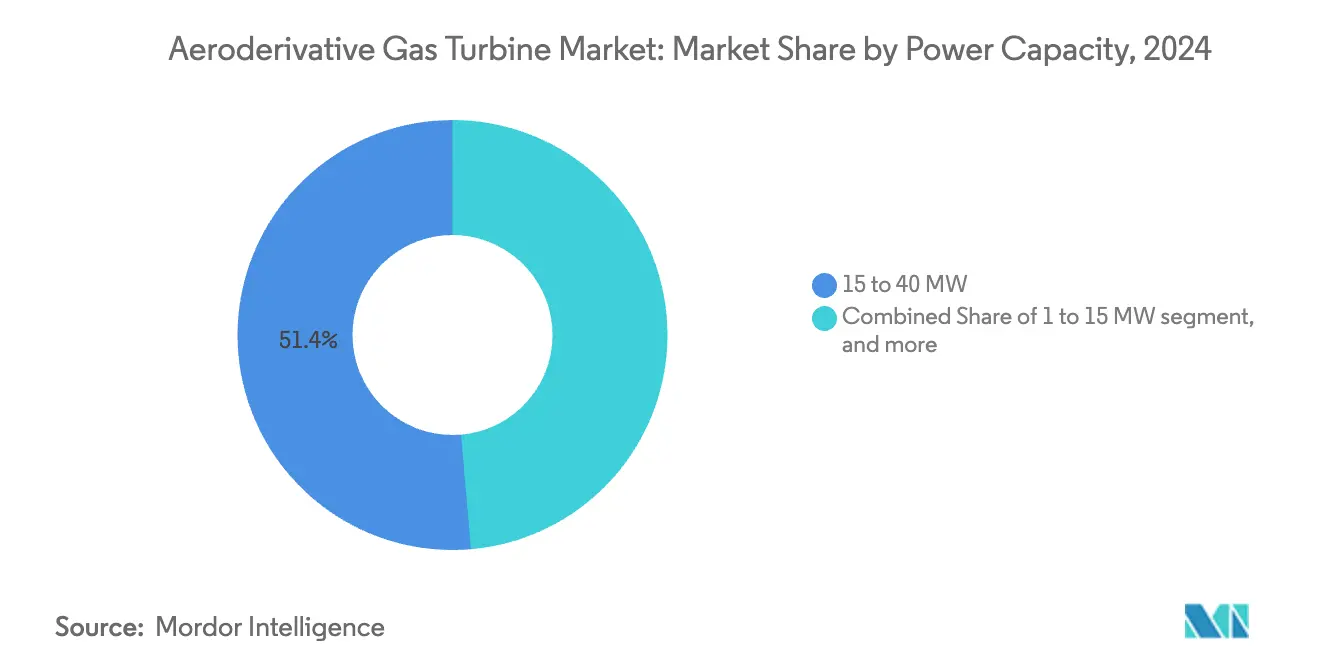
- By power capacity, the 15 to 40 MW band captured 51.37% of the aeroderivative gas turbine market share in 2024, while units rated 1 to 15 MW are forecasted to grow at a 5.98% CAGR through 2030.
- By application, power generation led with 53.85% revenue share in 2024; marine propulsion is advancing at a 7.43% CAGR to 2030.
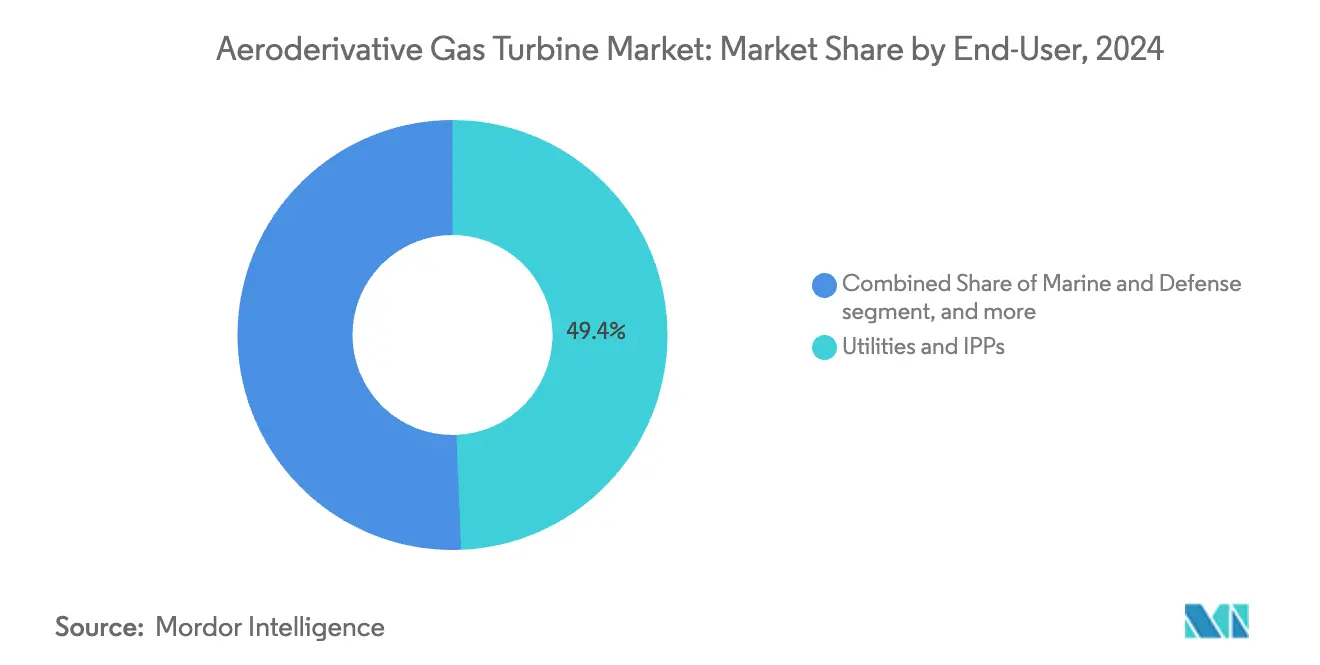
- By end-user, utilities and independent power producers held 49.36% of the aeroderivative gas turbine market size in 2024, whereas marine and defense users exhibit the highest projected CAGR at 6.55% through 2030.
- By fuel type, dual-fuel systems dominated with a 59.49% share in 2024; SAF and hydrogen blends are set to expand at a 7.89% CAGR over the same period.
- By geography, North America commanded 40.88% of 2024 revenues, while Asia-Pacific is on track for a 5.26% CAGR, the fastest worldwide.
Global Aeroderivative Gas Turbine Market Trends and Insights
Drivers Impact Analysis*
| Driver | (≈) % Impact on CAGR Forecast | Geographic Relevance | Impact Timeline |
|---|---|---|---|
| Decarbonization push elevating demand for fast-start, flexible generation assets | +1.20% | Global, early adoption in EU and California | Medium term (2-4 years) |
| Surging offshore E&P activity requiring lightweight mechanical-drive packages | +0.80% | North America Gulf Coast, North Sea, Brazil pre-salt | Long term (≥ 4 years) |
| Rising LNG carrier fleet adoption of aero-derivative propulsion packages | +0.70% | Global shipping routes, Asia-Pacific shipyards | Medium term (2-4 years) |
| Rapid growth of distributed energy resources in data centers and micro-grids | +0.60% | North America and EU hubs, emerging APAC markets | Short term (≤ 2 years) |
| Emergence of SAF-ready combustor retrofits unlocking new revenue streams | +0.50% | Global, led by aviation hubs with SAF infrastructure | Long term (≥ 4 years) |
| Military ship electrification programs leveraging marinized aero cores | +0.40% | NATO countries, Asia-Pacific naval upgrades | Long term (≥ 4 years) |
| Source: Mordor Intelligence | |||
Decarbonization Push Elevating Demand for Fast-Start, Flexible Generation Assets
Renewable curtailments in regions such as California exceeded 15,000 hours in 2024, creating lucrative ancillary-services revenue for turbines that can dispatch within minutes. Aeroderivative cores start 15-20% faster than heavy-duty frames while maintaining 35 MW-plus outputs in compact footprints. European utilities report 40% higher frequency-regulation income per installed megawatt versus combined-cycle plants, a premium driven by stringent grid-code response times. The ability to cycle multiple times daily without hot-section life penalties further enhances total cost of ownership. As carbon-pricing regimes tighten, flexible assets that avoid start-up emissions spikes gain additional financial advantage.
Surging Offshore E&P Activity Requiring Lightweight Mechanical-Drive Packages
Floating production systems and subsea compression stations favor machinery that can be air-lifted, and aeroderivatives weigh up to 60% less than comparable heavy-duty units at ConocoPhillips’ Willow project in Alaska.[1]ConocoPhillips, “Willow Project Overview,” Conocophillips.com Helicopter transport cuts logistics costs by USD 2-3 million per deployment and trims installation schedules by 25%, accelerating first-gas milestones. Operators appreciate simplified modular maintenance that allows hot-section swaps in under eight hours, minimizing outage duration in remote environments. Together, these factors improve the project's net present value despite the higher dollar-per-kilowatt capex.
Rising LNG Carrier Fleet Adoption of Aero-Derivative Propulsion Packages
Shipowners ordering new LNG tonnage increasingly specify aeroderivative propulsion. Evergreen Marine’s 24-ship order in 2024 targets 15% lower fuel burn and 8,000-hour maintenance intervals, double that of traditional marine turbines.[2]Evergreen Marine Corporation, “Fleet Information and Sustainability,” Evergreen-marine.com Lifecycle maintenance savings of 20-25% offset the up-front premium within seven years. Compatibility with future fuels such as ammonia or hydrogen supports compliance with IMO 2030 efficiency and carbon-intensity rules. Charterers reward vessels that surpass regulatory baselines with higher day rates, further reinforcing demand.
Rapid Growth of Distributed Energy Resources in Data Centers and Micro-Grids
Hyperscale data-center operators integrate aeroderivative combined heat-and-power systems to secure 99.9% availability, exceeding grid reliability metrics vital for AI workloads.[3]Microsoft Corporation, “Datacenter Sustainability,” Microsoft.com Waste-heat recovery drives 35% lower site-level energy cost, especially in warm climates where cooling equals 40% of consumption. The gas turbines’ black-start and islanding capabilities safeguard operations during grid disturbances, a decisive factor in regions exposed to extreme weather. Containerized 30 MW packages fit within existing campuses, avoiding land-acquisition delays.
Restraints Impact Analysis*
| Restraint | (≈) % Impact on CAGR Forecast | Geographic Relevance | Impact Timeline |
|---|---|---|---|
| Cost premium versus heavy-duty GTs in greater than 40 MW bracket | -0.90% | Global, price-sensitive emerging markets | Medium term (2-4 years) |
| Accelerated build-out of battery storage squeezing peaker hour demand | -0.60% | North America and EU high-renewable grids | Short term (≤ 2 years) |
| Volatile aviation-grade fuel supply chains impacting O&M costs | -0.40% | Global, fuel-import dependent regions | Short term (≤ 2 years) |
| Skills shortage for hot-section MRO in emerging markets | -0.30% | Asia-Pacific, Middle East, Africa | Long term (≥ 4 years) |
| Source: Mordor Intelligence | |||
Cost Premium Versus Heavy-Duty GTs in greater than 40 MW Bracket
National Energy Technology Laboratory data peg aeroderivative capital cost at USD 1,200-1,500 per kW compared with USD 800-1,000 for heavy-duty turbines of similar rating. For baseload profiles above 60% capacity factor, the 2-3% efficiency gain is insufficient to offset higher depreciation. Balance-of-plant simplifications further tilt economics toward heavy frames. As a result, utilities in emerging economies delay aeroderivative procurement unless weight or ramp-rate constraints outweigh capex.
Accelerated Build-Out of Battery Storage Squeezing Peaker Hour Demand
Battery installations reached 15 GW in the US during 2024 and supplied 60% of new peaking capacity additions. Four-hour lithium-ion systems absorb frequency-regulation and short-duration reserves once served by gas turbine peakers, trimming operating hours by 25% since 2022 in California. While aeroderivatives still dominate multi-hour backup and black-start duties, their revenue stack narrows if storage costs fall below USD 150 per kWh. Long-duration chemistries now under demonstration could further erode the flexibility premium.
*Our forecasts treat driver/restraint impacts as directional, not additive. The impact forecasts reflect baseline growth, mix effects, and variable interactions.
Segment Analysis
By Power Capacity: Mid-Range Units Anchor Demand as Smaller Packages Accelerate
The 15 to 40 MW class retained 51.37% of the aeroderivative gas turbine market share in 2024, underscoring its suitability for industrial cogeneration and distributed generation where waste-heat recovery lifts overall plant efficiency. Premium ancillary services income and footprint advantages validate the higher capital intensity. Units below 15 MW are gaining momentum at a 5.98% CAGR as containerized products slash installation costs by 30-40%, making them attractive for microgrids, remote mining, and island utilities. Growth in these segments is expected to raise their contribution to the aeroderivative gas turbine market size during the forecast horizon.
Larger than 40 MW machines are confined to niches where platform weight limits or shipboard space constraints outweigh scale economies. Offshore compression, naval propulsion, and certain peaking plants still specify high-output aeroderivatives, but combined-cycle heavy-duty turbines presently dominate greenfield baseload tenders in emerging markets. OEMs are therefore focusing R&D on modularity, digital twins, and alternative-fuel combustors to sustain the competitiveness of the top-end range.


By Application: Marine Propulsion Outpaces Power Generation Growth
Power-generation duty cycles delivered 53.85% of 2024 revenue as grid operators procured fast-start assets to back renewables and capture ancillary-services premiums. Ancillary-services participation is expected to preserve core demand despite storage incursions, anchoring roughly half of the aeroderivative gas turbine market through 2030. Marine propulsion, however, will post the steepest trajectory, climbing 7.43% annually as LNG carrier newbuilds and naval modernization reward the technology’s fuel efficiency and maintenance intervals. This application is poised to significantly expand the aeroderivative gas turbine market size for propulsion equipment over the decade.
Mechanical-drive opportunities in oil and gas remain steady: offshore liquefaction, subsea compression, and pipeline boosting deploy aeroderivatives where helicopter transportability and modular overhauls save schedule days and operating expense. With upstream capital expenditure recovering, these packages should hold share even as electrification progresses onshore.
By End-User: Utilities Dominate but Marine and Defense Deliver the Growth Premium
Utilities and independent power producers controlled 49.36% of 2024 installations, exploiting sub-10-minute ramp rates to earn high-value grid-stability fees. Long-term service contracts and availability guarantees reinforce their preference for proven aero cores. Nevertheless, marine and defense entities will record a 6.55% CAGR, the highest among end-users, supported by fleet renewal programs, integrated-electric warship designs, and rising bunker-fuel prices that magnify the economic merit of efficient propulsion. This momentum will gradually lift their weight in the aeroderivative gas turbine market size across the forecast window.
Oil and gas operators continue to specify aeroderivatives for weight-critical offshore platforms. In contrast, industrial process plants deploy them for cogeneration when pipeline gas supply is dependable and waste-heat streams are monetized. Together, these segments preserve a diversified demand mix that cushions the industry against cyclical swings in any vertical.
By Fuel Type: Dual-Fuel Retains Leadership, Alternative Blends Surge
Dual-fuel configurations held 59.49% share in 2024, a testament to operators’ desire for insurance against gas-supply interruptions or price spikes. The functionality also supports compliance with reserve-fuel mandates in critical infrastructure. While natural-gas-only units still dominate stable pipeline regions, retrofits enabling SAF and hydrogen blends are projected to rise 7.89% annually, the fastest among fuel classes. Successful 50% hydrogen tests on an LM6000 platform signal that combustor packages can be field-installed without wholesale engine replacement, enhancing the aeroderivative gas turbine market’s resilience to decarbonization policy shifts.
Alternative-fuel adoption will likely accelerate where carbon-credit markets close the economic gap and co-located green hydrogen production reduces delivered cost. OEMs already allocate significant R&D budgets to expand fuel-flex limits and certify higher blend ratios, positioning the portfolio for a post-2030 hydrogen uptake phase.
Geography Analysis
North America contributed 40.88% of the 2024 value, anchored by gas-fired peaker replacements, data-center campus generation, and Gulf of Mexico mechanical-drive demand. Favorable pipeline infrastructure and mature service networks lower ownership costs, bolstering the region’s aeroderivative gas turbine market share. Regulatory mandates requiring sub-10-minute starts for contingency reserve also sustain procurement.
Asia-Pacific is the growth engine with a 5.26% CAGR through 2030. Chinese shipyards incorporate aeroderivatives in LNG carriers, and regional navies order propulsion packages for frigates and destroyers. Japan and South Korea deploy units for grid balancing as renewables scale, although technician shortages for hot-section maintenance constrain rapid expansion. Localized MRO facilities opening in Singapore and Busan should gradually ease this bottleneck, broadening fleet support.
Europe favors turbines that qualify for SAF and hydrogen capability to meet rigorous emissions targets. Grid operators leverage their fast-ramp traits to manage volatile wind output in markets such as the United Kingdom and Germany. Meanwhile, the Middle East and Africa adopt selectively, mainly for offshore oil and gas compression and military vessels, given budget sensitivity in utility tenders.

Competitive Landscape
The market is highly concentrated, with GE Vernova, Siemens Energy, and Rolls-Royce drawing on decades of aviation-engine pedigree. Their combined share exceeds two-thirds of global deliveries, reflecting entrenched supply chains and certification know-how. Competitive advantage now pivots on validated hydrogen combustors and marinized derivatives that address premium navy and LNG segments.
New entrants focus on sub-15 MW packaged offerings that leverage containerization and digital twin analytics to shorten lead times and reduce site work. While such challengers innovate aggressively, they face certification and global service network hurdles that favor incumbents. The US Patent and Trademark Office logged more than 150 filings in 2024 related to alternative-fuel combustion and advanced ceramic matrix composites, underscoring the technology race.[4]US Patent and Trademark Office, “Patent Database Search,” Uspto.gov
Strategic collaborations are intensifying: Baker Hughes expanded Italian production to cut lead times by six months. MTU Aero Engines opened service hubs in Singapore and Dubai to close regional support gaps. Partnerships with shipbuilders, data center operators, and hydrogen developers reinforce pull-through sales and help incumbents lock in future revenues.
Aeroderivative Gas Turbine Industry Leaders
GE Vernova (General Electric Company)
Siemens AG
Mitsubishi Heavy Industries, Ltd.
MTU Aero Engines Holding AG
Rolls-Royce Holdings plc
- *Disclaimer: Major Players sorted in no particular order

Recent Industry Developments
- November 2024: GE Vernova completed 50% hydrogen-blend tests on its LM6000 platform, proving retrofit feasibility for decarbonized operation.
- April 2023: GE secured a contract from UCED Group (UCED), the energy division of Czech investment group CREDITAS Group, to supply a LM6000 PC Sprint aeroderivative gas turbine for the UCED Prostějov reserve power plant in Prague, Czech Republic.


Global Aeroderivative Gas Turbine Market Report Scope
| 1 to 15 MW |
| 15 to 40 MW |
| Greater than 40 MW |
| Power Generation |
| Mechanical Drive |
| Marine Propulsion |
| Utilities and IPPs |
| Oil and Gas Operators |
| Industrial and Process Plants |
| Marine and Defense |
| Natural Gas |
| Dual-Fuel |
| Sustainable Aviation Fuel (SAF) and Hydrogen Blends |
| North America | United States | |
| Canada | ||
| Mexico | ||
| Europe | United Kingdom | |
| France | ||
| Germany | ||
| Russia | ||
| Rest of Europe | ||
| Asia-Pacific | China | |
| India | ||
| Japan | ||
| South Korea | ||
| Australia | ||
| Rest of Asia-Pacific | ||
| South America | Brazil | |
| Rest of South America | ||
| Middle East and Africa | Middle East | Saudi Arabia |
| United Arab Emirates | ||
| Rest of Middle East | ||
| Africa | South Africa | |
| Rest of Africa | ||
| By Power Capacity (MW) | 1 to 15 MW | ||
| 15 to 40 MW | |||
| Greater than 40 MW | |||
| By Application | Power Generation | ||
| Mechanical Drive | |||
| Marine Propulsion | |||
| By End-User | Utilities and IPPs | ||
| Oil and Gas Operators | |||
| Industrial and Process Plants | |||
| Marine and Defense | |||
| By Fuel Type | Natural Gas | ||
| Dual-Fuel | |||
| Sustainable Aviation Fuel (SAF) and Hydrogen Blends | |||
| By Geography | North America | United States | |
| Canada | |||
| Mexico | |||
| Europe | United Kingdom | ||
| France | |||
| Germany | |||
| Russia | |||
| Rest of Europe | |||
| Asia-Pacific | China | ||
| India | |||
| Japan | |||
| South Korea | |||
| Australia | |||
| Rest of Asia-Pacific | |||
| South America | Brazil | ||
| Rest of South America | |||
| Middle East and Africa | Middle East | Saudi Arabia | |
| United Arab Emirates | |||
| Rest of Middle East | |||
| Africa | South Africa | ||
| Rest of Africa | |||


Key Questions Answered in the Report
What is the aeroderivative gas turbine market size in 2025, its expected value by 2030, and the corresponding CAGR?
The aeroderivative gas turbine market stands at USD 3.45 billion in 2025 and is projected to reach USD 4.34 billion by 2030, reflecting a 4.70% CAGR over the 2025-2030 period.
How fast can an aeroderivative gas turbine start and reach full load?
Modern units reach rated output in under 10 minutes, providing crucial flexibility for grids with high renewable penetration.
What is the projected growth rate for Asia-Pacific installations?
Asia-Pacific installations are forecasted to rise at a 5.26% CAGR between 2025 and 2030, led by naval and LNG applications.
Which application will expand the quickest through 2030?
Marine propulsion is expected to grow the fastest at 7.43% annually as shipowners seek higher fuel efficiency and IMO compliance.
Why do operators favor dual-fuel aeroderivative turbines?
Dual-fuel capability lets plants switch between natural gas and distillates, reducing exposure to supply disruptions and capturing peak-price opportunities.
What role will hydrogen play in future deployments?
Successful 50% blend demonstrations show hydrogen can be integrated via combustor retrofits, positioning assets for deeper decarbonization mandates.
Page last updated on:


