
Market Overview
| Study Period | 2020 - 2031 |
|---|---|
| Market Size (2026) | USD 22.16 Billion |
| Market Size (2031) | USD 40.06 Billion |
| Growth Rate (2026 - 2031) | 12.55 % |
| Fastest Growing Market | Middle East |
| Largest Market | Asia-Pacific |
| Market Concentration | Medium |
Major Players *Disclaimer: Major Players sorted in no particular order Image © Mordor Intelligence. Reuse requires attribution under CC BY 4.0. | |
Advanced Metering Infrastructure Market Analysis by Mordor Intelligence
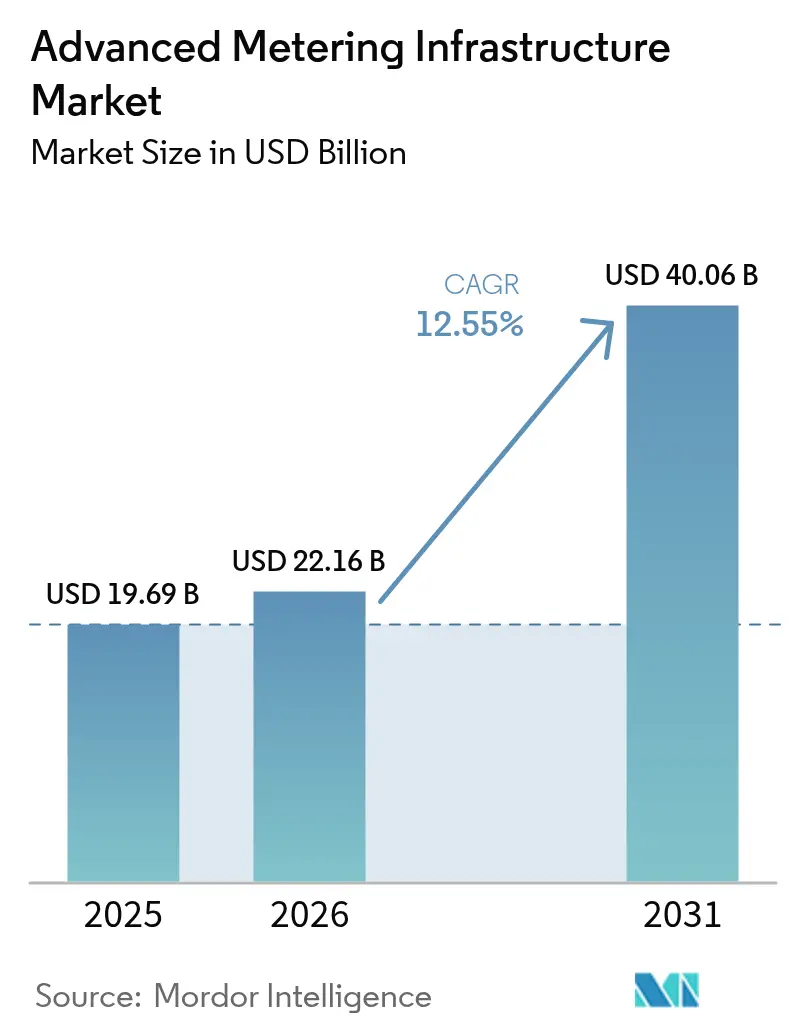
The Advanced Metering Infrastructure market size is expected to grow from USD 19.69 billion in 2025 to USD 22.16 billion in 2026 and is forecast to reach USD 40.06 billion by 2031 at 12.55% CAGR over 2026-2031. This trajectory underscores how nationwide mandates, mounting operational cost pressures, and the need to integrate renewable generation are accelerating utilities’ digital grid modernization. Electricity metering retains the lion’s share because mandated rollouts assure capital recovery, while water metering is now the fastest-growing niche as drought-prone regions embrace leak-detection benefits. The pivot toward managed services signals utilities’ preference for outcome-based contracts that shift cyber and integration risks onto vendors. Strategic alliances among meter makers, software firms, and cloud providers are creating bundled offerings that ease procurement hurdles while delivering edge analytics in near real time. As utilities grapple with supply-chain bottlenecks for transformers and semiconductors, AMI data is helping defer capital replacements by unlocking latent grid capacity.
Key Report Takeaways
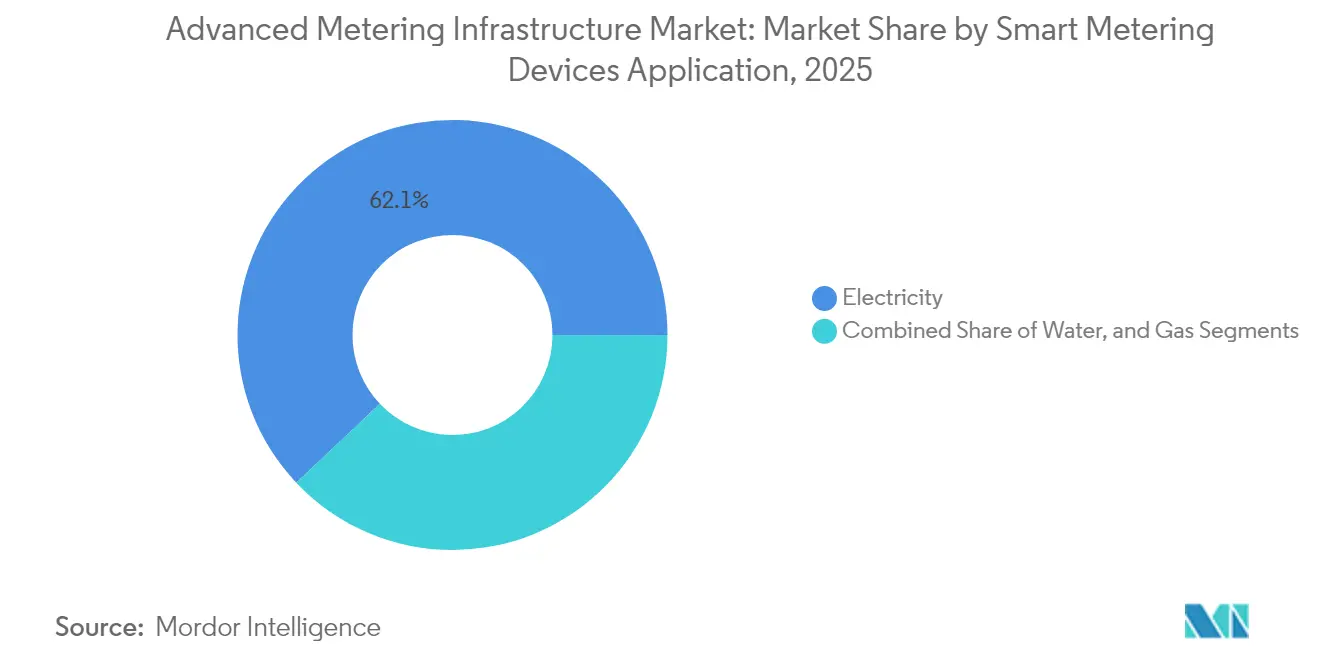
- By application, electricity metering commanded 62.05% of Advanced Metering Infrastructure market share in 2025, while water metering is advancing at a 13.12% CAGR through 2031.
- By service model, professional services led with 44.82% revenue share in 2025; managed services are expanding at a 13.28% CAGR to 2031.
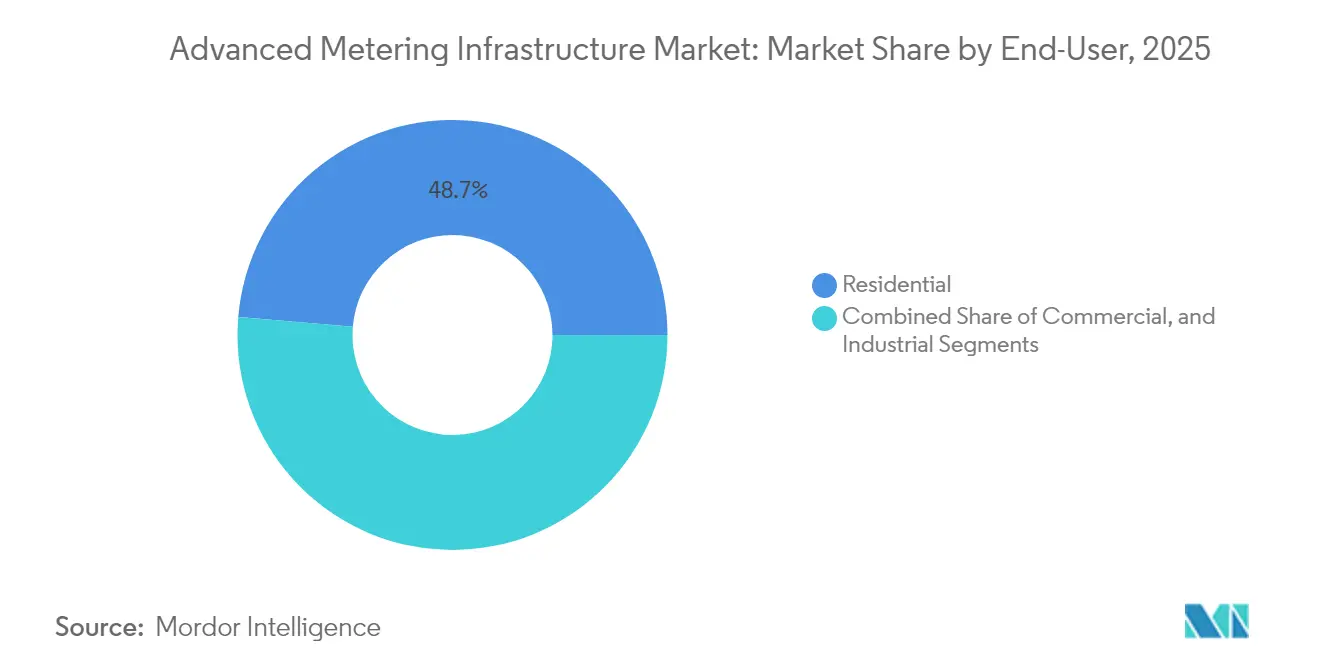
- By customer class, residential deployments held 48.67% of Advanced Metering Infrastructure market share in 2025, and commercial installations are projected to climb at a 12.74% CAGR through 2031.
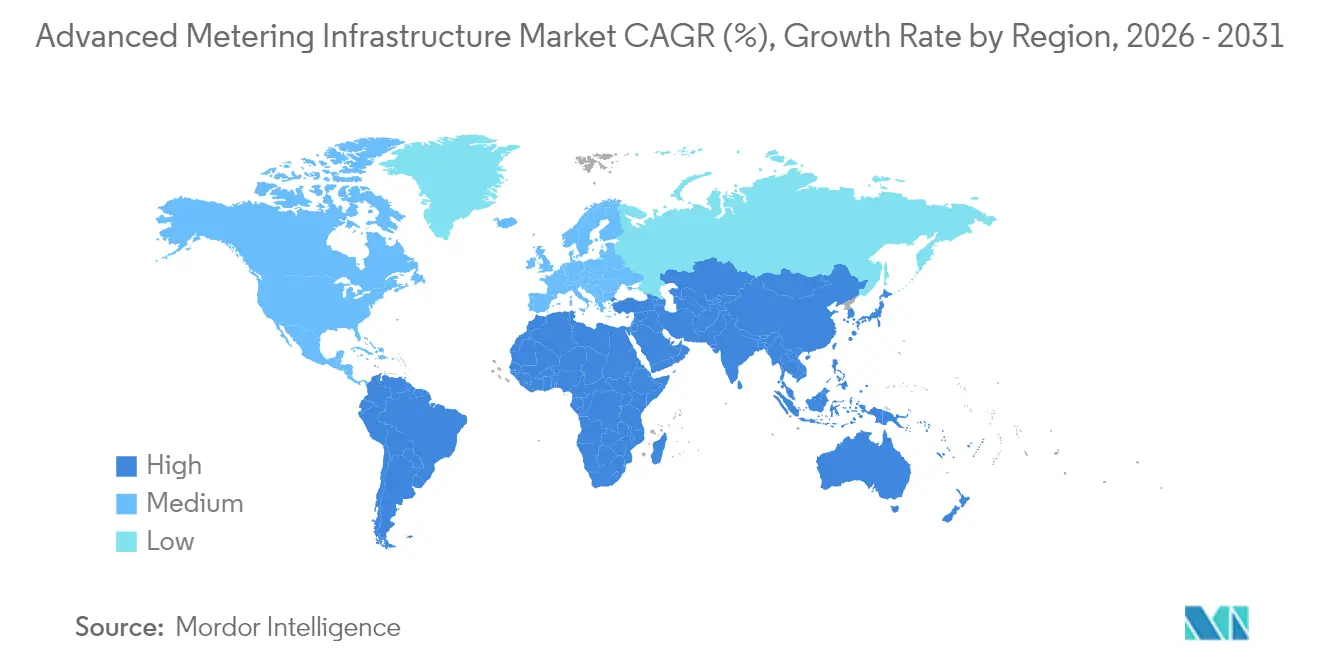
- By geography, Asia Pacific accounted for 40.22% of Advanced Metering Infrastructure market size in 2025, whereas the Middle East is set to rise at a 12.95% CAGR to 2031.
Note: Market size and forecast figures in this report are generated using Mordor Intelligence’s proprietary estimation framework, updated with the latest available data and insights as of 2026.
Market Trends and Insights
Drivers Impact Analysis of Advanced Metering Infrastructure Market*
| Driver | (~) % Impact on CAGR Forecast | Geographic Relevance | Impact Timeline |
|---|---|---|---|
| Government mandates for smart-meter roll-outs | +2.8% | Global – concentrated in EU, India, Australia | Medium term (2-4 years) |
| Utility cost-savings from remote meter reading | +2.1% | North America and Europe lead | Short term (≤ 2 years) |
| Integration of distributed energy resources and dynamic pricing | +1.9% | Asia Pacific core; spill-over to North America and EU | Long term (≥ 4 years) |
| Post-2025 EU Green Digital Taxonomics incentives | +1.4% | Europe; ripple into aligned markets | Long term (≥ 4 years) |
| Private 5G utility networks for low-latency AMI | +1.2% | North America and EU – early industrial adopters | Medium term (2-4 years) |
| Semiconductor localization grants lowering meter BOM | +0.9% | India, United States, EU early beneficiaries | Medium term (2-4 years) |
| Source: Mordor Intelligence | |||
Government Mandates for Smart-Meter Roll-Outs
Mandates transform discretionary upgrades into compulsory projects that guarantee demand visibility for suppliers and financiers. Australia’s program obliging every household to adopt smart meters by 2030 triggered bulk procurement that compressed meter unit costs and accelerated utility tenders.[1]Smart Energy International Staff, “Australia announces smart meter rollout by 2030,” Smart Energy International, smart-energy.com
Germany is enforcing intelligent measuring systems for customers consuming more than 6,000 kWh annually, compelling distribution system operators to schedule installations despite capital-budget constraints. India’s national mission targeting 250 million smart meters by 2026 is now the world’s largest single program, creating standardized specifications that enable multi-vendor interoperability and scale economies.[2]Smart Grid Bulletin Editors, “India smart meter rollout accelerates with 250 million target,” Smart Grid Bulletin, smartgridbulletin.comUtilities in mandated regions routinely secure lower interest rates because lenders treat statutory projects as lower risk than voluntary pilots. The certainty surrounding rollout timelines also incentivizes local assembly of radio modules, cushioning geopolitical shocks in semiconductor supply chains.
Utility Cost-Savings from Remote Meter Reading
Immediate labor savings strengthen investment cases, especially for utilities serving dispersed territories. Yorkshire Water eliminated 90% of manual meter-reading costs and materially cut customer-billing disputes after switching to AMI.[3]Yorkshire Water Communications Team, “Smart meters,” Yorkshire Water, yorkshirewater.comReduced truck rolls curb fuel expenses and carbon emissions, while automated reads slash estimated billing adjustments that previously distorted cash flows. Utilities can then redeploy field technicians toward higher-value inspections, enhancing asset health without hiring new staff. In territories with challenging terrain, remote reads remove safety hazards tied to accessing meters in flooded basements or remote cabins. Collectively, these benefits compress payback periods to as little as three years, reinforcing board-level confidence in successive AMI funding rounds.
Integration of Distributed Energy Resources and Dynamic Pricing
As rooftop solar, behind-the-meter storage, and electric vehicle charging proliferate, bidirectional flows strain legacy supervisory control systems. Research by the IEEE Power and Energy Society shows that AMI-enabled time-of-use tariffs can shave peak demand by 15-25% when paired with demand-response automation.[4]IEEE Power and Energy Society, “Dynamic Pricing and Demand Response in Smart Grids,” IEEE Xplore, ieeexplore.ieee.orgReal-time interval data feeds price algorithms that nudge customers to consume when renewable output is high, thereby flattening the duck curve without physical grid upgrades. Granular visibility into phase-level loading also guides utilities in pinpointing feeders requiring reconductoring, instead of blanket infrastructure upgrades. Regulatory alignment remains a gating factor because approval of dynamic tariffs varies widely, yet pilot programs in South Australia and California are proving political palatability when customer bills decline.
Private 5G Utility Networks for Low-Latency AMI
Utilities are building dedicated 5G networks to secure spectrum and guarantee sub-10 millisecond latency for protection schemes and outage management. Honeywell and Qualcomm’s cooperation on low-power edge gateways tailored for critical infrastructure exemplifies the move away from best-effort public cellular.[5]Honeywell Press Office, “Honeywell and Qualcomm Work to Revolutionize Energy Sector,” Honeywell, honeywell.comPrivate 5G overlays allow utilities to own encryption keys, bolstering data sovereignty and thwarting nation-state cyber threats. Embedded edge compute modules process voltage anomalies locally, enabling moment-by-moment switching decisions without traversing cloud backbones. Early adopters in the United States report 30% packet-loss reductions relative to 4G LTE, unlocking new use cases such as substation virtual fault detection and distributed protection relays. Capital costs are falling as governments auction off occupation-specific spectrum, accelerating deployments beyond pilot phases.
Restraints Impact Analysis of Advanced Metering Infrastructure Market*
| Restraint | (~) % Impact on CAGR Forecast | Geographic Relevance | Impact Timeline |
|---|---|---|---|
| High upfront capital expenditure | -1.8% | Smaller utilities worldwide | Short term (≤ 2 years) |
| Cybersecurity and data-privacy concerns | -1.2% | Heightened in highly regulated jurisdictions | Medium term (2-4 years) |
| Export-control limits on RF components | -0.9% | Global – concentrated pain in Asia Pacific | Medium term (2-4 years) |
| Utility workforce union resistance to remote disconnect | -0.6% | North America and Europe unionized operators | Short term (≤ 2 years) |
| Source: Mordor Intelligence | |||
High Upfront Capital Expenditure
Total cost of ownership climbs to USD 200-400 per meter once communication backhaul, head-end software, and integration services are included. Smaller cooperatives and municipal utilities find it harder to raise debt because they lack multi-year rate-recovery guarantees. Vendor financing can relieve pressure but often carries higher interest rates that erode savings. Parallel investments in cybersecurity, workforce reskilling, and consumer outreach push capex peaks even higher during the first two years of rollout. While grants and concessional loans exist, they rarely cover project-management or grid-integration costs, prolonging decision cycles among cash-constrained operators.
Cybersecurity and Data-Privacy Concerns
The U.S. Department of Energy’s 2024 guidelines recommend end-to-end encryption, network segmentation, and continuous monitoring, adding layers of complexity. Utilities must comply with GDPR, California’s CCPA, and sector-specific directives such as NERC CIP. Failure to encrypt personally identifiable consumption data risks multi-million-dollar fines and reputational harm. Utilities lacking specialized security teams often turn to managed service providers, but this introduces third-party-risk audits and vendor-lock-in anxieties. High-profile ransomware incidents targeting distribution networks intensify public scrutiny, with some city councils temporarily halting smart-meter projects until penetration tests demonstrate satisfactory resilience.
*Our forecasts treat driver/restraint impacts as directional, not additive. The impact forecasts reflect baseline growth, mix effects, and variable interactions.
Advanced Metering Infrastructure Market Segment Analysis
By Application Type:
Electricity Dominance Drives Market ExpansionElectricity metering applications commanded 62.05% of Advanced Metering Infrastructure market share in 2025, mirroring regulators’ focus on power-sector decarbonization timelines. This segment benefits from standardized meter communication protocols, remote disconnect features, and the immediate ability to curtail theft. Utilities deploying interval-data analytics report billing-accuracy improvements above 99.5%, which reduces revenue leakage and customer service calls. In contrast, water utilities are adopting AMI primarily to tackle non-revenue water that can exceed 25% in aging networks. Water metering’s 13.12% CAGR reflects rising drought exposure in California and Australia, where leak-detection alerts can lower losses by up to 20%. Gas metering lags because explosion-proof certification adds roughly 30% to meter list prices, and residential retrofits often require in-premise appointments that consumers resist.
The application mix influences software spending patterns. Meter data management platforms captured 40.96% of 2025 revenues, as utilities realized that scalable ingestion and cleansing of 15-minute interval data is essential before deriving insights. Meter data analytics is advancing at 12.83% CAGR, with utilities layering predictive maintenance and theft-detection models onto existing datasets. Electricity-first utilities are therefore increasing software-to-hardware spend ratios from 0.3:1 in 2022 to 0.5:1 by 2025, signaling a pivot from roll-out completion to value extraction. Vendors bundling analytics with head-end licenses at point of sale are outperforming those selling analytics as optional add-ons.



By End-User:
Residential Segment Leads While Commercial AcceleratesResidential deployments accounted for 48.67% of Advanced Metering Infrastructure market size in 2025, a direct consequence of government targets that prioritize households. Standardized meter form factors, drop-in socket replacements, and bulk purchase agreements keep unit costs low for utilities. Yet, realizing demand-response potential requires convincing millions of households to opt in, a process slowed by privacy worries and limited consumer awareness. Utilities therefore spend up to 10% of project budgets on customer-education campaigns explaining the benefits of time-of-use rates and real-time usage alerts.
Commercial meters are set to grow at 12.74% CAGR through 2031 because businesses need granular interval data to meet sustainability reporting obligations. Offices, malls, and data centers install multi-port meters with sub-circuit monitoring, yielding actionable insights into HVAC over-consumption and standby equipment waste. Industrial facilities face unique load-profile variance and install hardened meters that withstand high-voltage environments. IoT retrofit clamps offered by niche vendors allow factories to connect legacy electromechanical meters to cloud dashboards without full rip-and-replace investments, accelerating adoption in emerging economies where industrial meters exceed two decades of service life.
Geography Analysis
APAC Advanced Metering Infrastructure Market
Asia Pacific held 40.22% of Advanced Metering Infrastructure market share in 2025, anchored by India’s commitment to install 250 million meters by 2026 and China’s ongoing ultrahigh-voltage grid upgrades. Bulk procurement frameworks lower meter average selling prices by 18% compared with North American contracts, encouraging utilities to roll out multi-utility platforms that handle electricity, water, and gas concurrently. However, export-control limits on RF modules sourced from the United States add lead-time uncertainty, prompting state-run manufacturers to localize radio production capabilities.
North America Advanced Metering Infrastructure Market
North America remains a mature yet innovation-driven zone, with private 5G overlays gaining traction in Texas and Ontario. Utilities in the United States allocate up to 15% of AMI budgets to cybersecurity, reflecting stringent NERC CIP enforcement. Cold-weather specifications in Canada demand lithium-thionyl chloride batteries and dual-band mesh radios that maintain uptime at -40 °C, pushing vendors to design climate-robust variants. Mexico’s policy liberalization invites independent power producers to co-finance AMI in exchange for access to real-time load data that optimize merchant plant dispatch.
Europe Advanced Metering Infrastructure Market
Europe’s trajectory hinges on the EU Green Digital Taxonomics framework, which grants post-2025 incentives for meters that prove lifecycle carbon reductions. Germany’s legislated rollout milestones compel distribution grid operators to integrate smart meters with energy-saving dashboards, while the United Kingdom’s competitive metering market fosters innovative managed service offerings.
MEA Advanced Metering Infrastructure Market
The Middle East records the fastest regional CAGR of 12.95% as Saudi Arabia and the United Arab Emirates embed AMI into smart-city blueprints, dovetailing with rooftop solar mandates and electric-vehicle charging infrastructure. Africa’s growth remains nascent but strategic; South African utilities deploy AMI to curb non-technical losses surpassing 20%, whereas Nigerian discos pilot prepaid smart meters to stabilize cash flow.

Regulatory Landscape
Advanced metering infrastructure (AMI) deployments are increasingly shaped by interoperability, data-access, and measurement-accuracy requirements that affect both meter specifications and upstream software architectures. In Europe, Directive (EU) 2026/706 updated measuring instrument requirements to better accommodate smart electricity metering use cases, including direct current applications, and it tightened compliance expectations for meter certification and verification. In parallel, Implementing Regulation (EU) 2026/855 introduced interoperability requirements for electricity-market data exchange tied to customer switching, reinforcing the need for standardized interfaces between head-end systems, meter data management, and market platforms.
Outside Europe, regulators are codifying functionality and rollout governance rather than treating AMI as a discretionary modernization program. The UK Department for Energy Security and Net Zero (DESNZ) published the Smart Metering Policy Framework Post 2025, requiring licensees to submit deployment plans by 30 June 2026 and linking ongoing rollout obligations to measurable delivery governance after the prior targets framework ended in 2025. In Africa, the Nigerian Electricity Regulatory Commission (NERC) issued the 3rd Edition of its Metering Code in March 2026, defining capabilities such as multi-tariff support and remote load control, which increases the importance of secure remote operations and compliant prepayment and tariff logic in AMI stacks.
Value Chain Analysis
The AMI value chain spans semiconductor and radio components, meter and module manufacturing, communications networks (RF mesh, PLC, cellular, and emerging private 5G overlays), head-end systems, meter data management and analytics software, and deployment and lifecycle services delivered by utilities, system integrators, and managed-service providers. Hardware supply and certification remain upstream gating items, while utilities increasingly choose vendors based on integration readiness with distribution applications (for example ADMS) and the ability to run edge intelligence across multi-vendor fleets, shifting value capture toward software and recurring services.
Recent activity points to two structural shifts: ecosystem-led software extensibility and regional manufacturing localization. In January 2026, Mitsubishi Electric joined the Landis+Gyr Application Ecosystem under an MoU to develop grid-edge intelligence solutions for North American utilities, showing how platform ecosystems are pulling third parties into the AMI software layer. Localization is also moving from policy intent to executed capacity, with Ectron (an NEC subsidiary) partnering with Sagemcom in June 2026 to establish a smart meter manufacturing facility in Rusayl Industrial City, Oman, backed by an initial USD 10 million investment. On the demand-financing side, large rollout programs continue to attract structured capital, including the IFC-led consortium funding secured by Gemstar Infra in June 2026 for smart meter deployment across Rajasthan, reinforcing the role of development finance and project vehicles in scaling AMI procurement and installation.
Competitive Landscape
The Advanced Metering Infrastructure market is moderately consolidated, with the top five suppliers accounting for 58% of global deliveries in 2024. Itron, Landis+Gyr, and Sensus leverage joint ventures with cloud hyperscalers to infuse AI into grid-edge devices, transforming meters into sensor hubs capable of voltage analytics and outage prediction. Itron’s collaboration with Schneider Electric and Microsoft produced a distribution management platform that enables utilities to increase grid capacity by up to 20% without physical reinforcements. Landis+Gyr is bundling carbon-intensity insights within its head-end software, aligning with Europe’s sustainability taxonomy and securing multi-country framework agreements.
Challenger firms focus on domain-specific opportunities. EKM Metering targets industrial clients seeking sub-metering for ESG reporting, offering plug-and-play HTTP APIs that speed integration. Asian original device manufacturers such as Hexing are localizing communication modules to navigate export-control challenges and undercut Western incumbents on price by 12-15%. Meanwhile, Honeywell’s tie-up with Qualcomm positions it at the intersection of AMI and private 5G, a segment forecast to capture 18% of new meter shipments in North America by 2028. Vendors boasting NERC CIP and IEC 62351 compliance are winning tenders where data-privacy clauses demand verifiable security audits.
The competitive battleground is shifting from hardware margins toward recurring software and managed-service revenues. Utilities with depreciated first-generation AMI are pursuing upgrade-as-a-service contracts, enabling vendors to lock in ten-year operating fees while relieving utilities of obsolescence risk. As cloud costs decline, analytics modules priced per meter per month are emerging as a new monetization frontier, intensifying platform competition.
Advanced Metering Infrastructure Industry Leaders
Itron Inc.
IBM Corporation
Siemens AG
Schneider Electric SE
Honeywell International Inc.
- *Disclaimer: Major Players sorted in no particular order

Advanced Metering Infrastructure Market Companies Covered in this Report
- Itron Inc.
- Landis+Gyr Group AG
- Sensus USA Inc. (Xylem Inc.)
- Siemens Aktiengesellschaft
- Schneider Electric SE
- Honeywell International Inc.
- IBM Corporation
- Cisco Systems Inc.
- Aclara Technologies LLC
- Trilliant Holdings Inc.
- Kamstrup A/S
- Badger Meter Inc.
- Diehl Metering GmbH
- Neptune Technology Group Inc.
- Wasion Group Holdings Ltd.
- EDMI Limited
- Hexing Electrical Co. Ltd.
- Iskraemeco d.d.
- Aichi Tokei Denki Co. Ltd.
- Apator SA

Market Opportunities and Future Outlook
A primary opportunity is post-rollout value extraction and mid-life modernization, where utilities move from basic interval reads toward distribution operations use cases, cybersecurity hardening, and device-to-cloud lifecycle management. This shift is visible in utility and regulator activity: Great Britain reported over 41 million smart and advanced meters operating in Q1 2026 (72% of meters), while DESNZs post-2025 framework requires formal deployment plans by June 2026, raising governance, performance tracking, and supplier accountability beyond initial installation volumes. In the United States, program milestones such as Brownsville Public Utilities Board bringing production AMI data live across 52,194 meters (January 2026) and Utility Partners of America completing 500,000 residential electric meter installations for National Grid Massachusetts (April 2026) indicate continued large-scale execution and an installed base that can be monetized through analytics, outage management integration, and managed services.
Regulatory requirements are also creating whitespace for interoperable, multi-service functionality and tariff-enabled capabilities, which increases demand for standards-aligned software layers and integration services. India notified Central Electricity Authority amendment regulations in 2026 mandating that AMI support prepayment functionality and remain interoperable per CEA guidelines, pushing vendors to deliver compliant prepay stacks, secure remote operations, and integration-ready architectures suitable for multi-vendor deployments. In Europe, the shift toward interoperability for electricity-market data exchange (Implementing Regulation (EU) 2026/855) reinforces opportunities for meter data management, customer switching integration, and cybersecurity services, particularly for utilities managing heterogeneous AMI fleets and cross-border compliance requirements.
Recent Industry Developments in Advanced Metering Infrastructure Market
- March 2026: Itron expanded its UtilityIQ Application Suite to support the Itron Cellular 500G (gas) and 500W (water) modules, extending head-end software coverage beyond electricity use cases. The update strengthens interoperability across multi-utility deployments and supports utilities that are standardizing on cellular modules for harder-to-reach endpoints.
- December 2025: The City of Tucson partnered with Itron on an AMI water project to deploy 250,000 smart water communication modules, with a program timeline extending through 2029. The award underlines the scale of water AMI opportunities tied to leak detection and non-revenue water reduction, while expanding the long-duration services and module replacement pipeline.
- December 2024: Siemens signed a memorandum of understanding with PANA Infrastructure to collaborate on Meter Data Management Systems for Nigerias power sector. The initiative points to rising demand for software-centered AMI layers in emerging markets where loss reduction and billing improvement programs require meter data platforms alongside hardware rollouts.


Advanced Metering Infrastructure Market Report Scope and Research Methodology
Market Definition and Coverage
For this study, the advanced metering infrastructure market covers utility-grade systems that enable two-way meter data capture and communication. This includes smart meters, communication networks, and head-end and meter data management software supporting electricity, gas, and water metering.
Scope exclusions: We exclude standalone manual meter reading, basic AMR without two-way communications, and general grid automation that is not directly linked to metering data capture and management.
Segments Covered in This Report
- By Application Type
- Smart Metering Devices Application
- Electricity
- Water
- Gas
- Solution
- Meter Communication Infrastructure
- Meter Data Management Software
- Meter Data Analytics Software
- Services
- Professional (Program Management, Deployment, Consulting)
- Managed
- Smart Metering Devices Application
- By End-User
- Residential
- Commercial
- Industrial
- By Geography
- North America
- United States
- Canada
- Mexico
- South America
- Brazil
- Argentina
- Rest of South America
- Europe
- Germany
- United Kingdom
- France
- Italy
- Rest of Europe
- Asia Pacific
- China
- Japan
- India
- South Korea
- Australia and New Zealand
- Rest of Asia Pacific
- Middle East
- Saudi Arabia
- United Arab Emirates
- Turkey
- Rest of Middle East
- Africa
- South Africa
- Nigeria
- Kenya
- Rest of Africa
- North America
Data Sources, Market Sizing, and Validation
Desk Research
Desk research started with public, repeatable data points that explain where AMI demand is coming from and how fast deployments can realistically move. We referenced sources such as the US Energy Information Administration for utility and consumption context, the International Energy Agency for grid modernization signals, World Bank and UN population and urbanization series to anchor customer connections, and regulator or program portals where smart meter rollouts are mandated or funded.
To translate these signals into a workable market model, we also reviewed utility annual reports and rate case filings, investor presentations, and reputable press coverage of large tenders and rollout plans. Select paid subscriptions for company financials and news intelligence, plus patent databases, were used to sanity check supplier exposure and technology direction. Where disclosures were thin, an import-export shipment level database was used in a limited way to cross-check hardware movement. The examples above are illustrative only, and many other public sources were also used for data collection, validation, and clarification.
Primary Interviews and Surveys
Primary work was used to pressure test rollout timing, replacement cycles, and pricing behavior across meters, communications, and software services, which are not always visible in public reporting. We spoke with a mix of utilities, system integrators, component and solution suppliers, and channel partners across Americas, EMEA, and APAC, so gaps from desk research could be filled with on-the-ground checks and aligned assumptions.
Distribution of primary research fieldwork respondents
| Company type | Respondent position | Region |
|---|---|---|
| Top tier: 38% | CXOs: 15% | APAC: 49% |
| Mid tier: 45% | Functional/Unit leaders: 33% | EMEA: 30% |
| Smaller Players: 17% | Managers: 52% | Americas: 21% |
Market-Sizing & Forecasting
Sizing was built using both top-down and bottom-up logic, with the top-down view reconstructed from a demand pool that utilities can actually deploy against. In practice, we tied spending to indicators such as installed utility connections, smart meter rollout and replacement cycles, tender pipelines, communication mix shifts (PLC, RF mesh, cellular), and typical solution splits across meters, network, and data systems, which then roll up into value.
Those totals were corroborated with selective bottom-up approximations, including sampled contract values, supplier revenue exposure by region, and typical ASP checks against shipment volume for meter hardware. When a country or utility program had limited public disclosure, gaps were handled through proxy adoption rates from comparable markets, then corrected using primary feedback on rollout pacing and price movement. For forecasting, scenario analysis was used around mandate timelines, supply availability, and utility capex cycles. The final trajectory was anchored to what interviewees viewed as achievable ordering and installation capacity over the next few years.
Data Validation & Update Cycle
Outputs were validated through triangulation across independent signals, and then reviewed for variance by region, by utility type, and by component mix to keep the model aligned with real deployment behavior. We check for anomalies such as unrealistically high annual replacement rates, pricing that conflicts with recent tender outcomes, or growth that exceeds installation workforce constraints, and then re-contact sources when a correction is needed.
Each report goes through multi-step analyst review before sign-off, including a fresh cross-check against newly released policy updates and utility procurement notices. The report is refreshed annually, and interim updates are made when material events occur, such as large mandate revisions, major tender awards, or notable supply disruptions. Before delivery, a final update pass is performed so clients receive the latest view available at the time.
Mordor Intelligence's Advanced Metering Infrastructure Market Size Versus Other Published Estimates
Published AMI market numbers often vary because firms do not always count the same system elements, and they also choose different base years and currency timing. Differences also show up when one estimate follows announced policy targets, while another waits for funded utility orders and proven installation capacity.
A key gap driver in this market is whether software and data services are counted only when directly tied to meter operations, or if broader grid analytics and adjacent IoT platforms get bundled in. Another driver is how replacement cycles are treated for electricity versus gas and water, since the cadence can shift near-term value even when long-term adoption is similar. The spread is also affected by how tender pricing is adjusted over time, and by how quickly assumptions are refreshed after new rollout schedules are published, which is applied explicitly in the sizing logic used by Mordor Intelligence.
Benchmark comparison
| Source | Market Size | Gaps in Research Methodology |
|---|---|---|
| Mordor Intelligence | USD 19.69 B (2025) | |
| Global Consultancy A | USD 16.20 B (2024) | Uses a 2024 base year and a broader component scope that can blend AMI with adjacent grid software, and it does not make the rollout pacing assumptions traceable to utility level procurement signals. |
| Industry Publisher B | USD 12.60 B (2024) | Anchors sizing to a different estimation base year and applies a longer forecast window, which can understate near-term value when recent tender pricing and accelerated electricity meter deployments are not fully reflected. |
Overall, the differences come down to what gets counted as AMI, how rollout timing is translated into yearly spend, and how pricing is updated from real contracting signals. By keeping scope tied to metering plus the required communications and data layers, and then cross-checking results against tenders, rollout schedules, and supplier exposure, the estimate stays easier to reproduce and explain on a call.


Key Questions Answered in the Report
What is the current valuation of the Advanced Metering Infrastructure market?
The sector is valued at USD 22.16 billion in 2026 and is on track to rise to USD 40.06 billion by 2031.
Which application dominates global deployments?
Electricity metering holds 62.05% of 2025 installations, driven by statutory rollouts and immediate operational savings.
Which region grows fastest over the forecast period?
The Middle East is projected to increase at a 12.95% CAGR through 2031 as Saudi Arabia and the United Arab Emirates embed AMI into smart-city programs.
What service model is gaining momentum among utilities?
Managed services are expanding at a 13.28% CAGR because they let utilities outsource cyber, analytics, and network management responsibilities.
How do private 5G networks benefit AMI?
Dedicated 5G overlays lower latency, enhance data sovereignty, and integrate edge computing to support real-time grid automation.
What is the main financial barrier for smaller utilities?
Upfront capital outlay of USD 200-400 per meter strains budgets for municipal and cooperative operators lacking easy rate-recovery mechanisms.
Page last updated on:





