Adaptive Security Market Size and Share
Market Overview
| Study Period | 2019 - 2030 |
|---|---|
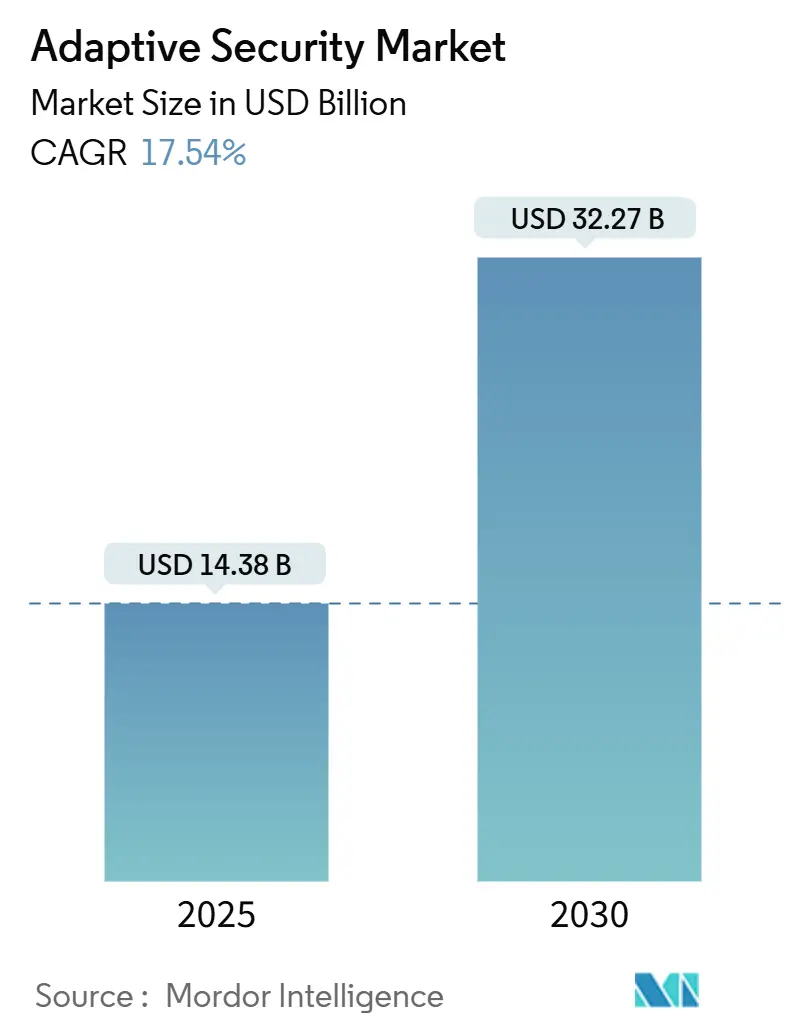
| Market Size (2025) | USD 14.38 Billion |
| Market Size (2030) | USD 32.27 Billion |
| Growth Rate (2025 - 2030) | 17.54% CAGR |
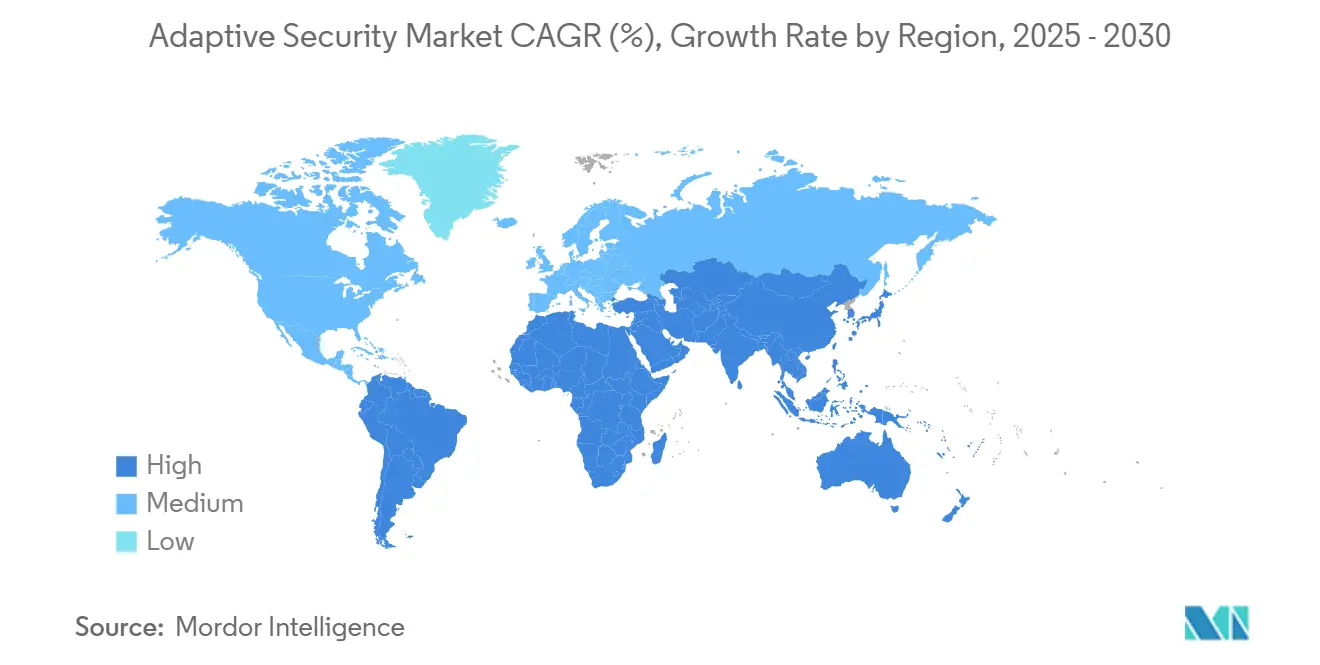
| Fastest Growing Market | Asia Pacific |
| Largest Market | North America |
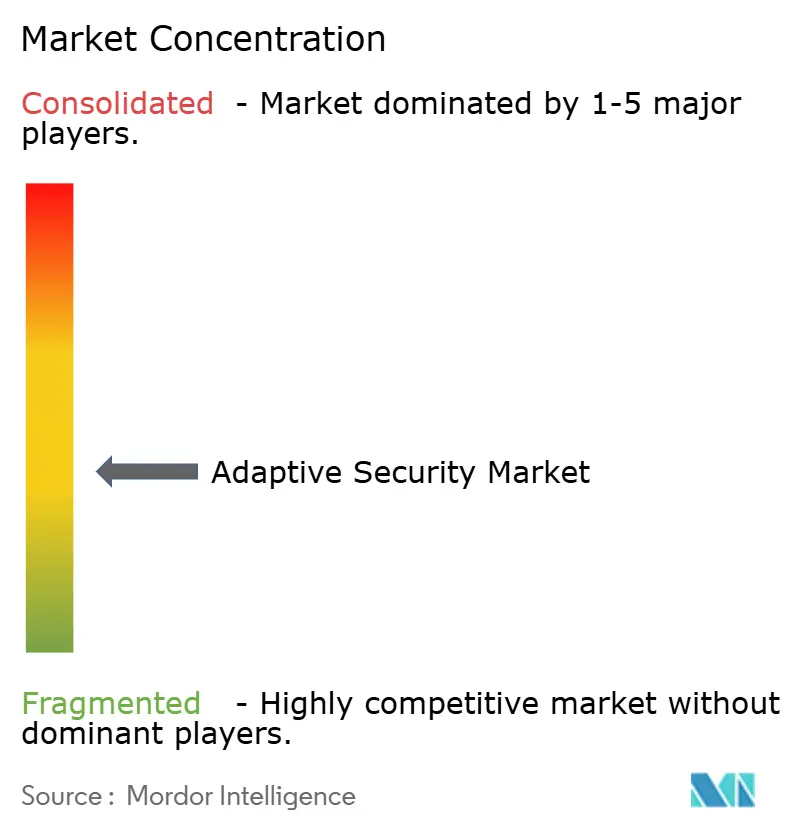
| Market Concentration | Medium |
Major Players *Disclaimer: Major Players sorted in no particular order Image © Mordor Intelligence. Reuse requires attribution under CC BY 4.0. | |
Adaptive Security Market Analysis by Mordor Intelligence
The adaptive security market is valued at USD 14.38 billion in 2025 and is forecast to reach USD 32.27 billion by 2030, advancing at a robust 17.54% CAGR. This expansion mirrors the rapid shift from perimeter-centric defenses to self-learning architectures that analyze user behavior, asset context, and threat intelligence in real time. Government zero-trust mandates, sharper regulatory penalties, and an unprecedented rise in AI-driven attack traffic are forcing enterprises to retire static controls and adopt continuously tuned safeguards. Vendors are embedding large-language-model reasoning, automated policy orchestration, and behavior analytics into unified platforms, reducing mean time to detect and respond while lowering administrative overhead. Organic demand is amplified by mounting board-level concern over brand damage and ransomware payouts that routinely exceed the cost of proactive controls.
Key Report Takeaways
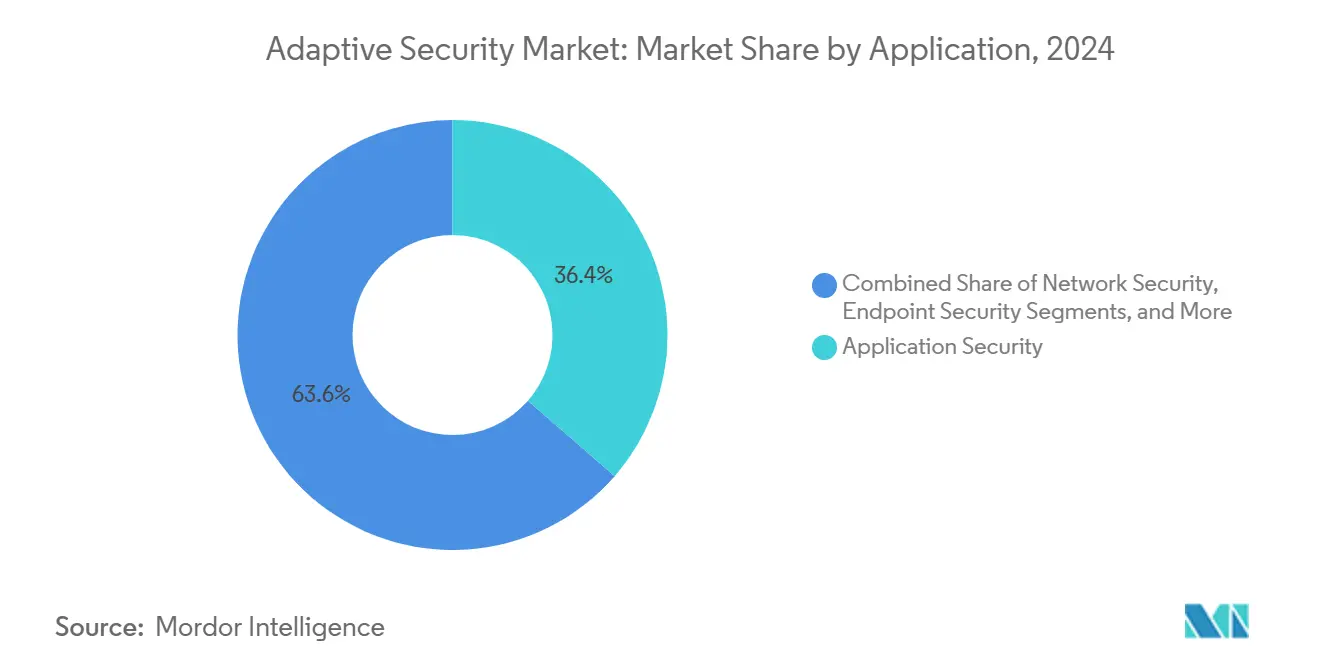
- By application, Application Security led with 36.4% of adaptive security market share in 2024; Cloud Security is on track to expand at an 18.1% CAGR through 2030.
- By offering, Solutions accounted for 62.6% share of the adaptive security market size in 2024, while Services post the highest projected CAGR at 17.8% through 2030.
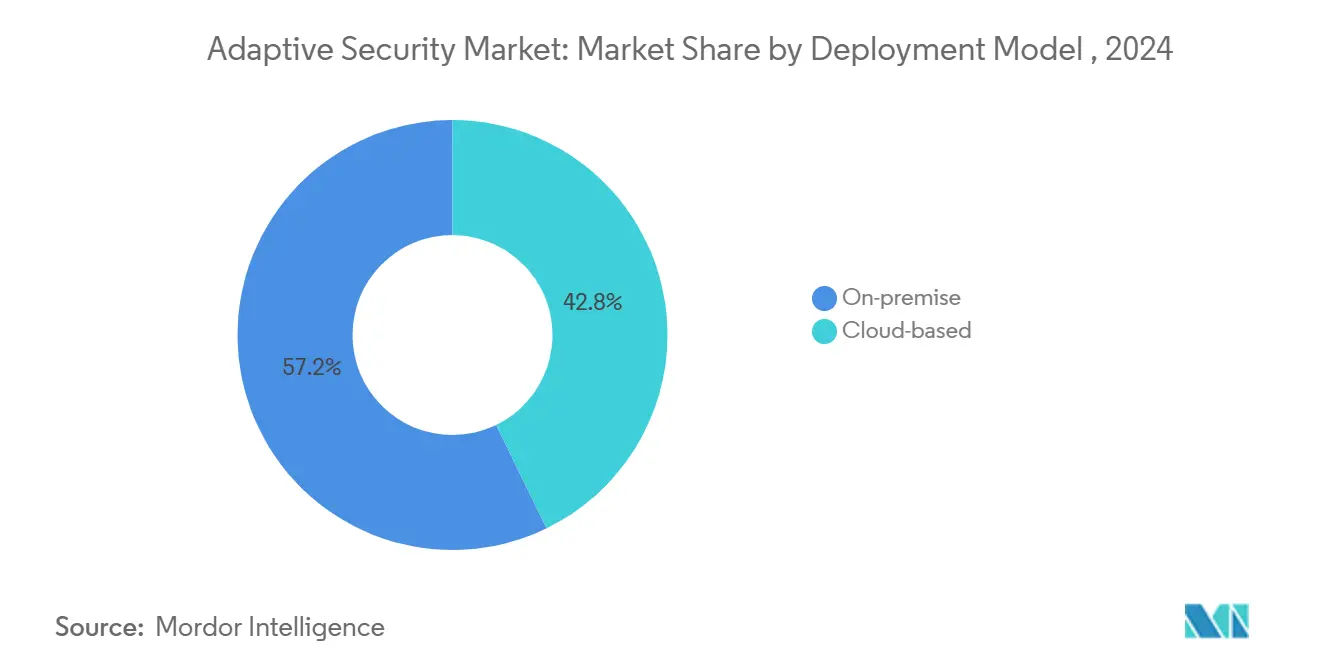
- By deployment, on-premise models held 57.2% of adaptive security market share in 2024; cloud-based deployments are forecast to grow at 19.7% CAGR to 2030.
- By end user, BFSI captured 27.1% revenue share in 2024; Healthcare is rising fastest at an 18.4% CAGR.
- By geography, North America dominated with 32.8% of 2024 revenue, whereas Asia-Pacific is positioned for the quickest climb at a 19.3% CAGR.
Global Adaptive Security Market Trends and Insights
Drivers Impact Analysis*
| Driver | (~) % Impact on CAGR Forecast | Geographic Relevance | Impact Timeline |
|---|---|---|---|
| Escalating volume and sophistication of cyber-attacks | 4.2% | Global | Short term (≤ 2 years) |
| Regulatory mandates (GDPR, CCPA, DORA, NIS2, etc.) | 3.8% | North America and EU, spill-over to Asia-Pacific | Medium term (2-4 years) |
| Enterprise cloud and SaaS sprawl needing zero-trust controls | 3.5% | Global, with concentration in North America and EU | Medium term (2-4 years) |
| AI-generated attack traffic outpacing rule-based defenses | 2.9% | Global, advanced markets first | Short term (≤ 2 years) |
| Surge in machine-to-machine identities requiring continuous risk scoring | 2.1% | Asia-Pacific core, spill-over to global | Long term (≥ 4 years) |
| 5G network-slicing driving micro-segmentation adoption | 1.2% | Asia-Pacific and EU early adopters, global expansion | Long term (≥ 4 years) |
| Source: Mordor Intelligence | |||
AI-Generated Attack Traffic Outpacing Rule-Based Defenses
AI-enabled adversaries now automate phishing, vulnerability discovery, and lateral movement, generating traffic patterns that evade signature-based tools. CrowdStrike launched agentic AI modules in 2025 that autonomously hunt and contain never-seen malware across endpoints and cloud workloads.[1]CrowdStrike, “Agentic AI Threat Hunting Launch,” crowdstrike.comDarktrace’s autonomous response engine already blocks suspicious sessions mid-stream, such as its 2025 mitigation of ClickFix phishing waves. These proof points illustrate how real-time behavior models supersede static rule sets, cementing demand for adaptive security market solutions that refine policies without human tuning.
Regulatory Mandates Driving Compliance-Driven Security Investments
The EU NIS2 and DORA regulations that took effect in 2025 impose fines up to EUR 10 million or 2% of global turnover for inadequate cyber controls, forcing banks, utilities, and digital service providers to implement continuous monitoring and least-privilege access. U.S. federal agencies face identical pressure under Executive Order 14028, with CISA’s Zero-Trust Maturity Model detailing phased milestones through fiscal 2027.[2]Cybersecurity and Infrastructure Security Agency, “Zero Trust Maturity Model,” cisa.govThe U.S. Department of Defense complements this with a mandatory zero-trust framework for all networks by 2027. Together, these mandates create a multiplier effect that boosts the adaptive security market as firms seek unified platforms capable of mapping a single control to multiple regulations.
Enterprise Cloud and SaaS Sprawl Necessitating Zero-Trust Controls
Rising multicloud adoption pushes workloads beyond fixed perimeters, leaving conventional VPNs ineffective. Seventy percent of enterprises have formed SaaS-dedicated security teams to tame sprawl, according to Cloud Security Alliance research cited in Microsoft’s 2025 Security Copilot launch. Palo Alto Networks’ 2025 partnership with Zero Networks adds automated micro-segmentation to next-generation firewalls, enabling identity-aware policies across hybrid assets.[3]Palo Alto Networks, “Zero Networks Partnership Announcement,” paloaltonetworks.com These moves highlight why adaptive security market vendors converge network, workload, and identity telemetry into a single policy engine that can follow resources wherever they reside.
Surge in Machine-to-Machine Identities Requiring Continuous Risk Scoring
Industry 4.0 rollouts connect operational-technology assets to corporate networks, multiplying non-human identities. Rockwell Automation notes that factories retrofitted with IIoT sensors often add thousands of unmanaged credentials per line. ISACA recommends AI-driven credential hygiene that verifies firmware status, location, and behavior before granting device access.[4]ISACA, “AI and IoT Security Governance Guide,” isaca.org 5G network slicing complicates matters further by enabling on-demand micro-networks, each demanding tailored policies, a scenario already underlined by GSMA guidelines for private 5G deployments. Adaptive identity governance is becoming a baseline capability as the adaptive security market evolves.
Restraints Impact Analysis*
| Restraint | (~) % Impact on CAGR Forecast | Geographic Relevance | Impact Timeline |
|---|---|---|---|
| Shortage of skilled cyber-security talent | -2.8% | Global, acute in Asia-Pacific and emerging markets | Medium term (2-4 years) |
| High TCO and integration complexity for brown-field IT estates | -2.1% | Global, concentrated in large enterprises | Short term (≤ 2 years) |
| Legacy OT/ICS environments with proprietary protocols | -1.6% | Manufacturing and utilities globally | Long term (≥ 4 years) |
| Data-sovereignty conflicts in multi-cloud deployments | -1.3% | EU and Asia-Pacific regulatory environments | Medium term (2-4 years) |
| Source: Mordor Intelligence | |||
Shortage of Skilled Cybersecurity Talent
There are nearly 600,000 unfilled U.S. cybersecurity roles, and experienced practitioners enjoy zero percent unemployment, according to Varonis’ 2025 labor snapshot. Small firms and Asian SMEs struggle most, with Japan’s 2024 SME survey showing staff shortages as the top cyber-readiness barrier. This gap encourages managed detection and response services and fuels the 17.8% CAGR forecast for the Services segment within the adaptive security market. Fortinet answered the skills crunch by embedding GenAI playbooks into FortiAnalyzer 2025, enabling lean teams to triage alerts that formerly required senior analysts.
High TCO and Integration Complexity for Brownfield IT Estates
Retrofitting zero-trust controls onto decades-old infrastructure often demands full network re-architecture. CISA’s 2024 progress audit found budget overruns of 15-30% across federal pilots when integrating legacy authentication schemes. Manufacturers face similar friction: proprietary field-bus protocols frequently lack modern encryption, making agent deployment risky for uptime. These unanticipated costs impede quick adoption, tempering adaptive security market growth, though vendors now counter with overlay platforms that minimize rip-and-replace.
*Our forecasts treat driver/restraint impacts as directional, not additive. The impact forecasts reflect baseline growth, mix effects, and variable interactions.
Segment Analysis
By Application: Safeguarding API-First Architectures
Adaptive security market size for Application Security stood at USD 5.23 billion in 2024 and preserved a 36.4% slice of revenue owing to heightened API exploitation. Akamai’s 2025 Apps and API report revealed that APIs account for 57% of all observed traffic and are increasingly weaponized. Enterprises therefore deploy runtime inspection, schema validation, and behavior baselining to block injection attacks that bypass perimeter gateways. Cloud Security, meanwhile, advances at an 18.1% CAGR as zero-trust policy engines embed directly into container orchestrators and serverless runtimes, giving DevOps teams native safeguards. Vendors such as Syncloop layer unsupervised anomaly detection over Kubernetes clusters, reducing false positives and easing SOC fatigue. Network and endpoint controls remain essential but converge into platform bundles so buyers can streamline telemetry pipelines and automate kill-chain disruption.


By Offering: Services Expansion Signals Outsourcing Momentum
Despite Solutions retaining 62.6% of 2024 sales, the adaptive security market size for Services will grow faster as boards outsource detection, response, and compliance reporting to experts. Skills shortages and 24×7 coverage needs push even Fortune 500 firms toward managed orchestration. Ciena’s case study on optical network customers shows service providers packaging AI-driven threat analytics into connectivity deals, offloading capex and skill burdens for industrial clients. Service providers leverage multitenant SIEMs and AIOps to reduce per-customer cost and expand gross margin, reinforcing a cycle where technology buyers prefer outcomes over tool ownership.
By Deployment Model: Cloud-Native Security Gains Ground
On-premise models still command a 57.2% revenue share in the 2024 adaptive security market, due to data-sovereignty mandates in finance and defense. Yet cloud deployment accelerates at 19.7% CAGR as hyperscalers deliver sovereign cloud zones and confidential computing for regulated workloads. Singapore’s Productivity Solutions Grant subsidizes migration by covering up to 50% of qualifying cybersecurity expenses, catalyzing uptake among SMEs. Cloud-delivered engines refresh policy logic daily, a task that on-prem teams often defer because of change-control windows, further tipping economics in favor of SaaS models.
By End User: Healthcare Leads Growth Upswing
BFSI generated the highest 2024 spend, representing 27.1% of adaptive security market share, driven by global Basel III, PCI-DSS, and real-time payments mandates. Breach costs in finance topped USD 6 million on average, according to JumpCloud’s 2024 impact analysis. Healthcare enjoys the steepest trajectory, up 18.4% CAGR, as ransomware groups exploit electronic health record dependence and downtime sensitivity. Palo Alto Networks’ 2025 Medical IoT Security roll-out segments infusion pumps and imaging devices, aligning with HIPAA logging rules. Manufacturing follows closely, 90% of plant leaders now list IT/OT cybersecurity among the top-three budget items per Oil and Gas IQ’s 2025 Industry 4.0 poll.
Geography Analysis
North America’s 32.8% share stems from early zero-trust pilots, venture funding depth, and federal spending. Executive Order 14028 and CISA guidance obligate federal agencies to deploy continuous authentication, spurring private-sector imitation in supply chains. Microsoft provides prescriptive blueprints for agencies migrating to Security Copilot, accelerating best-practice diffusion across the region. Local talent pools and a well-developed cyber-insurance market also sustain premium pricing for high-assurance products.
Asia-Pacific is set for the fastest climb at a 19.3% CAGR through 2030. Japan’s Cybersecurity Strategy Council earmarked JPY 1.2 trillion for public-private R&D programs, fostering domestic vendors that integrate post-quantum cryptography and threat-intel sharing. Singapore’s Smart Nation blueprint injects funding for AI SOC automation, while multinational manufacturers relocate facilities to Southeast Asia and demand adaptive safeguards for smart factories. China’s dominance in AI security patents, accounting for 70% of 2023 global filings, puts pressure on neighbors to accelerate local innovation and cross-border threat-sharing pacts.
Europe records solid growth on the back of regulatory heft. NIS2 forces energy, water, and transport operators to verify supply-chain hardening, while DORA extends similar rules to financial entities. ENISA’s 2025 survey showed 86% policy adoption but only 47% budget allocation, implying pent-up demand for turnkey managed services. The upcoming Cyber Resilience Act broadens coverage to all digital products, fueling fresh procurements among consumer-electronics manufacturers.

Competitive Landscape
The adaptive security market features a moderately consolidated top tier where Cisco, Palo Alto Networks, and CrowdStrike bundle network, workload, and identity analytics into single-license platforms. Cisco’s 2025 release of an open-source AI reasoning engine lowers the barrier to entry for community-driven detection models and reinforces its ecosystem moat. Palo Alto Networks complements organic R&D with tuck-in deals such as the Zero Networks integration that brings identity-centric segmentation directly into its NGFW OS. CrowdStrike expands into cloud posture management with Falcon Cloud, leveraging its endpoint dominance for cross-selling.
Strategic acquisitions continue: Mastercard paid USD 2.65 billion for threat-intel specialist Recorded Future, while Sophos spent USD 859 million for Secureworks’ MDR unit, collectively boosting data-lake breadth and analytics. Eager to differentiate, incumbents pump double-digit percentages of revenue into AI and ML to shorten detection latencies and enable self-healing.
Challenger vendors carve niches in micro-segmentation, API security, and post-quantum readiness. Illumio and ColorTokens win design-wins inside healthcare and telco clouds by automating policy creation based on workload labels. Clavister secured an EU patent for AI-driven policy generation in November 2024, signaling small-cap innovation that attracts OEM attention. Patent filings from Chinese institutes accelerate (up 35% YoY in 2024), intensifying competition for differentiated IP and hastening standards harmonization.
Adaptive Security Industry Leaders
Trend Micro
Rapid7
Cisco Systems
Juniper Networks
IBM Corp.
- *Disclaimer: Major Players sorted in no particular order

Recent Industry Developments
- June 2025: MIND secured USD 30 million in funding to expand its AI-driven data loss prevention solutions, reflecting investor confidence in machine-learning-based proactive controls.
- June 2025: NTT DATA launched AI-powered Software-Defined Infrastructure services for Cisco products, addressing outdated technology that hinders 80% of enterprises’ digital progress.
- May 2025: Palo Alto Networks partnered with Zero Networks to integrate NGFWs with automated micro-segmentation for dynamic policy orchestration.
- April 2025: Cisco unveiled open-source AI reasoning models at RSAC 2025, encouraging community adoption of AI-enhanced threat detection.
- April 2025: Fortinet extended FortiAI across the Security Fabric, enabling autonomous threat protection through GenAI and AIOps


Research Methodology Framework and Report Scope
Market Definitions and Key Coverage
Our study defines the adaptive security market as all commercial software, hardware-enabled functions, and managed services that continuously monitor user behavior, asset context, and external intelligence to predict, prevent, detect, and respond to cyber threats across network, endpoint, application, and cloud layers.
According to Mordor Intelligence, revenues are recorded at the point a vendor or service provider recognizes sales for these adaptive capabilities within a unified or modular offering.
Scope exclusion: products that only provide conventional signature-based or perimeter firewalls without embedded behavioral analytics are not counted.
Segmentation Overview
- By Application
- Application Security
- Network Security
- Endpoint Security
- Cloud Security
- Others
- By Offering
- Solutions
- Services
- By Deployment Model
- On-premise
- Cloud-based
- By End User
- BFSI
- Government and Defense
- Manufacturing (Industry 4.0)
- Healthcare and Life Sciences
- Energy and Utilities
- Others
- By Geography
- North America
- United States
- Canada
- Mexico
- South America
- Brazil
- Argentina
- Rest of South America
- Europe
- United Kingdom
- Germany
- France
- Sweden
- Rest of Europe
- Asia-Pacific
- China
- Japan
- India
- Australia
- South Korea
- Rest of Asia-Pacific
- Middle East and Africa
- Saudi Arabia
- United Arab Emirates
- Turkey
- South Africa
- Rest of Middle East and Africa
- North America
Detailed Research Methodology and Data Validation
Primary Research
Mordor analysts interviewed CISOs, SOC managers, and channel partners across North America, Europe, and fast-growing Asia to validate spending intent, deployment hurdles, and typical contract sizes. Short surveys with managed security providers helped fine-tune cloud versus on-premise penetration assumptions.
Desk Research
We started with public datasets that map the global threat surface, such as ENISA breach notifications, U.S. FTC identity-theft statistics, and Asia-Pacific CERT advisories, which reveal incident volumes and attack vectors. Trade associations, including the Cloud Security Alliance and the Open Web Application Security Project, supplied adoption ratios for zero-trust and DevSecOps patterns. Company 10-Ks, investor decks, and patent filings were mined through D&B Hoovers and Dow Jones Factiva to benchmark vendor revenue splits and pipeline momentum. Customs shipment records from Volza helped us sense hardware-based adaptive appliance flows. This list is illustrative; several other open and subscription sources informed granular checks.
Market-Sizing & Forecasting
A top-down reconstruction of demand pools, built from national cyber spending, enterprise IT outlays, and incident cost benchmarks, is corroborated with bottom-up spot checks such as sampled average selling price multiplied by installed-base refresh rates and capacity roll-ups from leading MSSPs. Key variables include breach frequency, mean time to detect, zero-trust policy rollout rates, cloud workload share, and security staff vacancy levels, which together drive our multivariate regression forecast. Where supplier roll-ups left gaps, we inferred volumes by aligning channel inventory turns with announced backlog figures.
Data Validation & Update Cycle
Outputs pass a three-level review: automated variance scanners flag anomalies, senior analysts reconcile outliers, and a final peer audit signs off the model. Reports refresh annually, with interim updates triggered by material M&A or regulatory shifts. Just before release, one analyst performs a fresh data sweep so clients receive our latest view.
Why Mordor's Adaptive Security Baseline Earns Unmatched Decision Trust
Published figures often diverge because firms differ on what constitutes 'adaptive,' the breadth of service revenue counted, and currency conversion timing. We disclose each assumption, keep refresh cycles yearly, and, crucially, let primary evidence overrule legacy ratios when markets pivot.
Key gap drivers include others bundling broader cyber tools, treating pilot projects as mature revenue, or projecting aggressive price erosion without validating supplier contracts. Mordor's base year (2025) reflects booked revenue only and tempers price compression with real ASP trends gathered in interviews.
Benchmark comparison
| Market Size | Anonymized source | Primary gap driver |
|---|---|---|
| USD 14.38 B (2025) | Mordor Intelligence | - |
| USD 11.7 B (2024) | Regional Consultancy A | Includes non-behavioral SIEM tools and rolls 2024 currency at 2023 FX rates |
| USD 13.6 B (2024) | Trade Journal B | Counts proof-of-concept deals and assumes uniform 20% annual price drop |
| USD 12.27 B (2024) | Global Consultancy C | Uses installed-base extrapolation without validating multi-tenant service revenue |
These comparisons show that when scope, pricing, and refresh cadence are normalized, Mordor's 2025 baseline offers a balanced, transparent anchor that decision-makers can trace to clearly documented variables and repeatable steps.


Key Questions Answered in the Report
How large is the adaptive security market in 2025?
The adaptive security market is valued at USD 14.38 billion in 2025 and is projected to reach USD 32.27 billion by 2030.
What is the expected CAGR for the adaptive security market through 2030?
The market is forecast to expand at a 17.54% compound annual growth rate from 2025 to 2030.
Which application segment is growing the fastest?
Cloud Security is the fastest-growing application segment, advancing at an 18.1% CAGR through 2030 as enterprises secure hybrid and multicloud workloads.
Which region will see the highest growth?
Asia-Pacific is set to record the quickest rise with a 19.3% CAGR through 2030, supported by government digital initiatives and expanding 5G infrastructure.
What key factor is driving enterprises to adopt adaptive security solutions?
The surge in AI-generated cyberattacks that evade signature-based tools is pushing organizations toward platforms that leverage machine-learning analytics and autonomous response.
Page last updated on:


