Market Overview
| Study Period | 2017 - 2028 |
|---|---|
| Forecast Data Period | 2024 - 2028 |
| Historical Data Period | 2017 - 2022 |
| Market Size (2024) | USD 15.89 Billion |
| Market Size (2028) | USD 20.14 Billion |
| Growth Rate (2024 - 2028) | 6.10% CAGR |
| Market Concentration | Low |
Major Players*Disclaimer: Major Players sorted in no particular order Image © Mordor Intelligence. Reuse requires attribution under CC BY 4.0. | |

Acrylic Adhesives Market Analysis by Mordor Intelligence
The Acrylic Adhesives Market size is estimated at 15.89 billion USD in 2024, and is expected to reach 20.14 billion USD by 2028, growing at a CAGR of 6.10% during the forecast period (2024-2028).
The acrylic adhesives industry is experiencing a significant transformation driven by increasing environmental regulations and sustainability initiatives worldwide. Water-borne technology has emerged as the dominant manufacturing process, accounting for over 77% of the market share in 2023, reflecting the industry's shift towards eco-friendly solutions. This transition is further supported by stringent VOC emission regulations implemented across major markets, particularly in Europe and North America. Manufacturers are investing heavily in research and development to create innovative formulations that maintain high performance while reducing environmental impact. These developments are reshaping the competitive landscape as companies race to meet evolving regulatory requirements and consumer preferences.
The electronics and electrical equipment manufacturing sector has become a crucial growth driver for acrylic adhesives, with the household appliances industry projected to grow at a CAGR of 5.77% through 2028. The increasing miniaturization of electronic devices and the growing complexity of assembly requirements have led to heightened demand for specialized adhesive solutions. Advanced acrylic adhesives formulations are being developed to meet the specific needs of electronic component assembly, offering improved thermal conductivity and electrical insulation properties. The integration of smart technologies in consumer electronics and the rapid expansion of the Internet of Things (IoT) devices are creating new application opportunities for acrylic adhesives.
A notable trend in the market is the accelerating adoption of electric vehicles, which is projected to grow at a remarkable CAGR of 17.75% through 2028. This transformation in the automotive sector is driving innovation in adhesive technologies, particularly for battery assembly and lightweight material bonding applications. Manufacturers are developing new formulations specifically designed for electric vehicle production, focusing on thermal management and structural bonding capabilities. The industry is witnessing increased collaboration between adhesive manufacturers and automotive OEMs to develop customized solutions that meet the unique requirements of electric vehicle assembly.
The construction industry's projected annual growth rate of 3.5% through 2030 is catalyzing advancements in acrylic adhesive formulations for building applications. Manufacturers are focusing on developing products with enhanced durability, weather resistance, and compatibility with diverse construction materials. The trend towards sustainable building practices has led to increased demand for adhesives that contribute to energy efficiency and green building certifications. Innovation in this sector is particularly focused on developing products that can withstand extreme weather conditions while maintaining long-term structural integrity, addressing the growing concerns about climate resilience in construction projects.
Global Acrylic Adhesives Market Trends and Insights
Fast paced growth of e-commerce industry in developing nations to augment the industry
- In 2020, the packaging industry started with multiple long-term trends driving higher demand, and growth accelerated as economic activity switched to address the challenges posed by the COVID-19 pandemic. The industry's robust performance supported rising revenues and the expansion of important end markets such as food and beverage and healthcare and also demonstrated the industry's general stability during a period of overall economic uncertainty.
- Packaging M&A activities soared in 2021, as buyers and sellers enthusiastically returned to the market after deal-making almost ceased during the pandemic in 2020. During the pandemic, the strong performance of packaging companies reinforced the idea that the industry offers stability during moments of general market turbulence. The pandemic also strengthened previously existing tailwinds, including rapid e-commerce expansion and brand owners employing packaging to differentiate their products on supermarket shelves, positioning the sector for stronger long-term growth.
- As of now, dissolvable packaging, space-saving packaging, and smart packaging are a few innovations that have come up in the packaging industry. The adoption of edible packaging, an interesting and innovative alternative that alleviates the reliance on fossil fuels and has the potential to significantly decrease the carbon footprint, is now becoming popular across the food industry owing to its sustainability. These factors have created a growth opportunity for the packaging industry in the food and beverage sector, which is expected to boost the packaging industry's growth during the forecast period.


Growing residential and infrastructural development to thrive the construction sector
- The building and construction industry witnessed steady growth, with a CAGR of 2.6% from 2017 to 2019. This growth was driven by the upswing in global economic activity and increasing demand for single-family homes. In 2020, the COVID-19 pandemic had a major impact on the global building and construction industry. Constraints in labor supply, disruptions in construction finances and the supply chain, and economic uncertainty negatively impacted the global building and construction industry.
- Though the industry showed positive growth in 2021, the pandemic's effect on supply chains, which resulted in a hike in raw material prices, is still plaguing the industry. However, as the construction industry heavily influences a nation's economy, countries in Europe, North America, and Asia-Pacific have used the construction industry to restart their economic cycles by offering support schemes. Some support schemes include the Homebuilder Programme in Australia and the economic recovery plan of EU countries.
- The Asia-Pacific region experiences the highest volume of construction activities, and it is expected to remain the largest construction market till 2028 due to its huge population, increasing urbanization, and increasing investments in infrastructural development in countries like China, India, Japan, Indonesia, and South Korea.
- Increasing emphasis on green buildings and efforts to reduce emissions from global construction activities are expected to result in more sustainable operational procedures during the forecast period. For example, France has sanctioned EUR 7.5 billion for the construction industry to transform itself into a low-carbon energy economy.

OTHER KEY INDUSTRY TRENDS COVERED IN THE REPORT
- Rapid growth of civil and military aviation will boost the aircraft production
- Easy availability of resources will support the footwear industry specifically in developing countries
- Favorable government policies to promote electric vehicles will propel automotive industry
Segment Analysis: End User Industry
Packaging Segment in Acrylic Adhesives Market
The packaging segment dominates the global acrylic adhesives market, commanding approximately 60% of the total market share in 2024. This significant market position is primarily driven by the extensive use of acrylic adhesives in various packaging applications, including flexible packaging, labels, tapes, and other pressure-sensitive applications. The segment's dominance is further strengthened by the growing e-commerce industry worldwide, which has substantially increased the demand for packaging solutions. Modern lifestyles and the rising demand for packaged food and beverages have significantly influenced adhesives consumption, with water-based acrylic adhesives being particularly preferred due to their eco-friendly nature and low VOC emissions. The packaging industry's adoption of sustainable and innovative packaging solutions has also contributed to the increased usage of acrylic adhesives, as they offer excellent bonding properties while meeting environmental regulations.
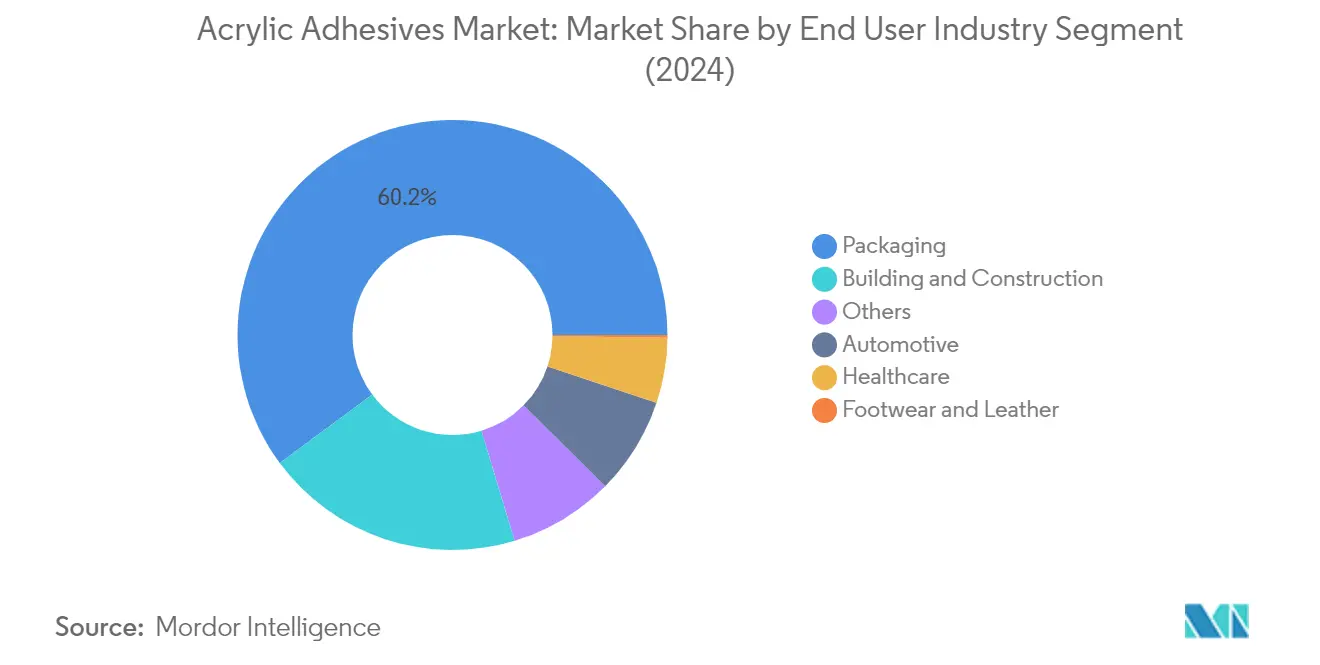

Automotive Segment in Acrylic Adhesives Market
The automotive segment is emerging as the fastest-growing segment in the acrylic adhesives market, with a projected growth rate of approximately 7% during 2024-2029. This remarkable growth is primarily attributed to the increasing adoption of lightweight materials in vehicle manufacturing and the growing trend toward electric vehicle production. Automotive manufacturers are increasingly replacing traditional mechanical fasteners with acrylic adhesives to reduce vehicle weight and improve fuel efficiency. The segment's growth is further supported by the adhesives' ability to bond dissimilar materials, crucial in modern automotive design where multiple substrates are used. The expansion of electric vehicle production globally has created additional demand for acrylic adhesives, as these vehicles require specialized bonding solutions for battery assemblies and other components.
Remaining Segments in End User Industry
The other significant segments in the acrylic adhesives market include building and construction, healthcare, footwear and leather, and various other industrial applications. The building and construction segment maintains a strong presence due to the increasing use of acrylic adhesives in both residential and commercial construction projects. The healthcare segment is gaining importance due to the growing demand for medical device assembly and wound care applications. The footwear and leather segment, while smaller, continues to utilize acrylic adhesives for specific applications requiring strong bonding properties. These segments collectively contribute to the market's diversity and demonstrate the versatility of acrylic adhesives across different industrial applications.
Segment Analysis: Technology
Water-borne Segment in Acrylic Adhesives Market
Water-borne acrylic adhesives dominate the global market, commanding approximately 85% market share in 2024, owing to their superior environmental credentials and cost-effectiveness compared to other technologies. These adhesives utilize water as a carrier medium to separate adhesive molecules, forming strong bonds upon water evaporation. Their popularity stems from low volatile organic compound (VOC) content, making them environmentally friendly and compliant with stringent regulations worldwide. Water-borne acrylic adhesives are particularly prevalent in industries requiring bonding of wood, paper, textiles, leather, and other porous substrates. The segment's dominance is further reinforced by increasing adoption in footwear manufacturing and construction applications, where their ease of application and strong bonding properties make them the preferred choice.
Remaining Technology Segments in Acrylic Adhesives Market
The remaining technology segments in the acrylic adhesives market include solvent-borne, UV curable acrylic glue, and reactive technologies, each serving specific application needs. Solvent-borne adhesives, while facing regulatory pressure due to higher VOC content, maintain their position in applications requiring superior binding performance and flexibility. UV curable acrylic glue has carved out a niche in specialized applications where rapid curing is essential, particularly in electronics and medical device assembly. Reactive acrylic adhesives, known for their structural bonding capabilities, continue to find applications in high-performance areas such as automotive assembly and aerospace applications. These segments complement the water-borne segment by addressing specific technical requirements that water-borne technologies may not fully satisfy.
Acrylic Adhesives Market Geography Segment Analysis
Acrylic Adhesives Market in Asia-Pacific
The Asia-Pacific region represents the largest market for acrylic adhesives globally, driven by extensive manufacturing capabilities across the automotive, aerospace, construction, and packaging industries. Countries like China, India, Japan, South Korea, and Southeast Asian nations including Malaysia, Singapore, Thailand, and Indonesia form the key markets in this region. The region's dominance is supported by rapid industrialization, increasing urbanization, and growing investments in infrastructure development. The presence of major automotive manufacturing hubs, an expanding electronics industry, and rising construction activities continue to fuel the demand for acrylic adhesives across various applications.
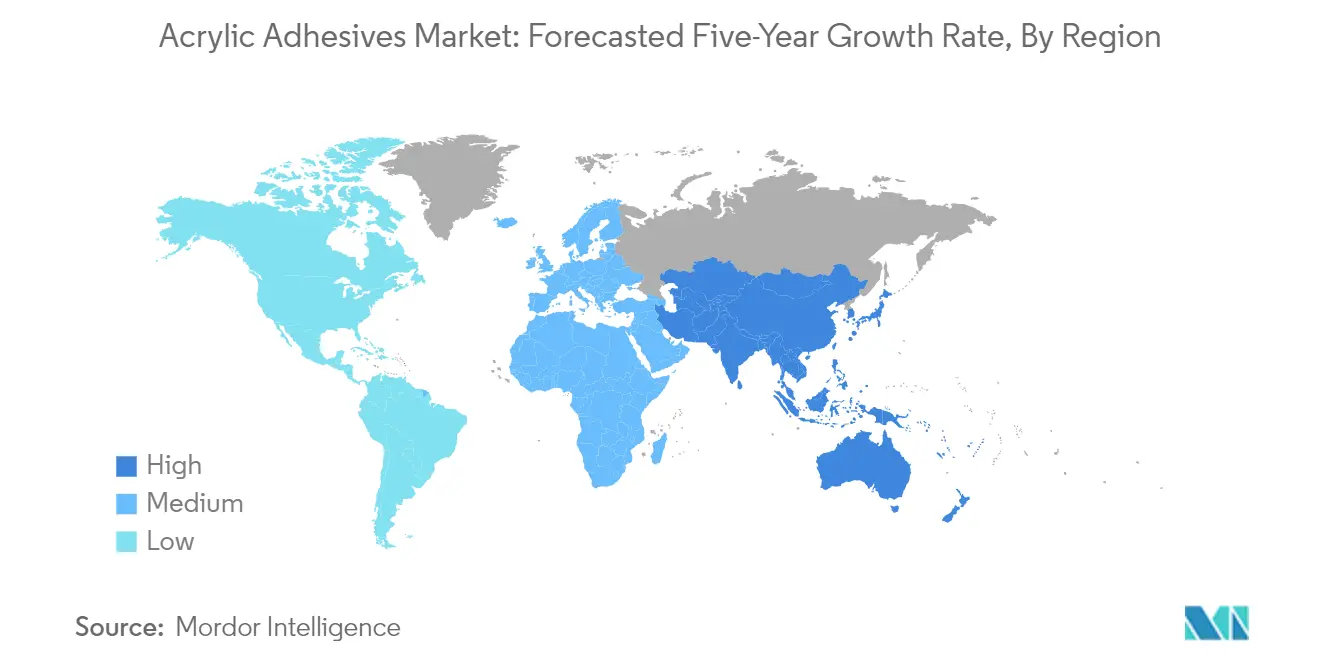
Acrylic Adhesives Market in China
China emerges as the dominant force in the Asia-Pacific acrylic adhesives market, leveraging its massive manufacturing base and diverse end-user industries. The country's robust automotive sector, extensive electronics manufacturing capabilities, and booming construction industry drive substantial demand for acrylic adhesives. China's market position is strengthened by its well-established supply chains, advanced manufacturing facilities, and strategic focus on industrial development. The country accounts for approximately 35% of the region's acrylic adhesives consumption in 2024, supported by increasing domestic demand and export-oriented manufacturing activities.
Acrylic Adhesives Market in India
India represents the fastest-growing market for acrylic adhesives in the Asia-Pacific region, with a projected growth rate of approximately 6% during 2024-2029. The country's growth trajectory is driven by rapid industrialization, an expanding automotive sector, and increasing investments in infrastructure development. India's emergence as a manufacturing hub, supported by government initiatives promoting domestic production, continues to boost demand for acrylic adhesives. The country's electronics manufacturing sector, growing packaging industry, and rising construction activities further contribute to market expansion.
Acrylic Adhesives Market in Europe
Europe represents a sophisticated market for acrylic adhesives, characterized by advanced manufacturing capabilities and stringent quality standards. The region's market is driven by a strong presence in the automotive, aerospace, and construction industries, with countries like Germany, France, the United Kingdom, Italy, Spain, and Russia leading the demand. European manufacturers focus on developing innovative, environmentally-friendly adhesive solutions, aligning with the region's strict environmental regulations. The market benefits from robust research and development activities and increasing adoption of advanced bonding technologies across industries.
Acrylic Adhesives Market in Germany
Germany stands as the largest market for acrylic adhesives in Europe, driven by its advanced automotive industry, robust manufacturing sector, and strong focus on technological innovation. The country's leadership position is supported by the presence of major automotive manufacturers, aerospace companies, and construction firms. Germany accounts for approximately 25% of Europe's acrylic adhesives consumption in 2024, reflecting its significant industrial base and sophisticated manufacturing capabilities.
Acrylic Adhesives Market in Italy
Italy emerges as the fastest-growing market for acrylic adhesives in Europe, with an expected growth rate of approximately 6% during 2024-2029. The country's growth is driven by increasing investments in the manufacturing sector, rising automotive production, and expanding construction activities. Italy's strong presence in furniture manufacturing, a growing packaging industry, and an increasing focus on sustainable building practices contribute to market expansion. The country's emphasis on technological advancement and quality manufacturing supports continued market growth.
Acrylic Adhesives Market in Middle East & Africa
The Middle East & Africa region presents a growing market for acrylic adhesives, characterized by increasing industrialization and infrastructure development. The region's market dynamics are shaped by expanding construction activities, a growing packaging industry, and a rising automotive sector. Saudi Arabia and South Africa represent the key markets in this region, with different industrial strengths and growth patterns.
Acrylic Adhesives Market in Saudi Arabia
Saudi Arabia leads the Middle East & Africa market for acrylic adhesives, supported by extensive construction activities and a growing industrial base. The country's market leadership is driven by massive infrastructure projects, including the development of new cities and industrial zones. Saudi Arabia's focus on economic diversification and industrial development continues to create new opportunities for acrylic adhesives across various applications.
Acrylic Adhesives Market in South Africa
South Africa represents the fastest-growing market for acrylic adhesives in the Middle East & Africa region. The country's growth is driven by expanding manufacturing activities, rising automotive production, and increasing construction projects. South Africa's diverse industrial base, growing packaging sector, and improving infrastructure development contribute to market expansion. The country's strategic position as a manufacturing hub in Africa supports continued market growth.
Acrylic Adhesives Market in North America
North America represents a mature market for acrylic adhesives, characterized by advanced manufacturing capabilities and high technological adoption. The region encompasses key markets including the United States, Canada, and Mexico, each contributing significantly to market growth. The United States emerges as both the largest and fastest-growing market in the region, driven by its robust automotive sector, aerospace industry, and construction activities. The region's market is characterized by a strong focus on innovation, increasing demand for high-performance adhesives, and a growing emphasis on sustainable solutions. The presence of major manufacturers, extensive research and development activities, and diverse end-user industries continue to drive market growth across the region.
Acrylic Adhesives Market in South America
South America presents an evolving market for acrylic adhesives, with growing industrial applications and increasing manufacturing activities. The region's market is primarily driven by Brazil and Argentina, with Brazil emerging as both the largest and fastest-growing market. The region's automotive sector, expanding packaging industry, and growing construction activities contribute to market growth. Increasing investments in manufacturing capabilities, rising domestic demand, and improving economic conditions support market expansion. The region's focus on industrial development and infrastructure improvement creates sustained demand for acrylic adhesives across various applications.

Competitive Landscape
Top Companies in Acrylic Adhesives Market
The global acrylic adhesives market is led by major players including 3M, Henkel AG & Co. KGaA, Avery Dennison Corporation, H.B. Fuller, and Sika AG. These companies are actively pursuing product innovation, particularly in developing sustainable and low-VOC acrylic adhesives solutions to meet evolving environmental regulations and customer demands. Strategic expansion moves have focused on establishing new manufacturing facilities and innovation centers, particularly in high-growth regions like Asia-Pacific and the Middle East. Companies are strengthening their distribution networks through partnerships and acquisitions of local players to enhance market penetration. The industry has witnessed significant investment in research and development, with companies developing specialized adhesive solutions for emerging applications in electronics, medical devices, and automotive sectors. Operational agility has become crucial, with manufacturers implementing advanced production technologies and flexible supply chain strategies to respond to market fluctuations and raw material challenges.
Market Dominated by Global Chemical Conglomerates
The acrylic adhesives market structure is characterized by the strong presence of large chemical conglomerates that leverage their extensive research capabilities, global distribution networks, and diverse product portfolios. These major players benefit from economies of scale, established brand recognition, and long-standing relationships with key end-users across industries such as packaging, construction, and automotive. The market also includes specialized manufacturers who focus on niche applications and regional markets, particularly in emerging economies where local knowledge and relationships are crucial for market success.
The industry has witnessed significant consolidation through mergers and acquisitions, as companies seek to expand their geographic presence, enhance technological capabilities, and strengthen their market position. Major players are actively acquiring smaller, specialized companies to gain access to innovative technologies and expand their product offerings. Regional players are increasingly becoming attractive acquisition targets for global companies looking to establish or strengthen their presence in specific markets, particularly in Asia-Pacific and Latin America where construction and industrial growth drive demand.
Innovation and Sustainability Drive Future Success
For incumbent companies to maintain and increase their market share, focusing on sustainable product development and technological innovation will be crucial. Companies need to invest in developing bio-based and environmentally friendly adhesive solutions while maintaining high performance standards. Building strong relationships with key end-users through customized solutions and technical support services will help create barriers to entry. Expanding presence in high-growth markets through strategic partnerships and localized manufacturing facilities will also be essential for maintaining competitive advantage.
New entrants and smaller players can gain ground by focusing on specialized market segments and developing innovative solutions for specific applications or industries. Success will depend on building strong distribution networks, offering superior technical support, and maintaining competitive pricing strategies. Companies must also consider potential regulatory changes regarding environmental protection and safety standards, particularly in developed markets. The increasing focus on sustainable packaging and construction materials presents opportunities for companies that can develop innovative, eco-friendly adhesive solutions. Understanding and adapting to regional market dynamics and customer preferences will be crucial for both established players and new entrants. The development of modified acrylic adhesive and fluoroacrylate adhesive solutions could provide competitive advantages in niche applications.
Acrylic Adhesives Industry Leaders
3M
AVERY DENNISON CORPORATION
H.B. Fuller Company
Henkel AG & Co. KGaA
Sika AG
- *Disclaimer: Major Players sorted in no particular order


Recent Industry Developments
- July 2022: Mapei started the construction of its third manufacturing facility in Kosi, Mathura, to cater to the demand generated from Northern India.
- February 2022: Arkema Group completed the acquisition of Ashland's Performance Adhesives business. Ashland is a world leader in high-performance adhesives in the United States.
- February 2022: H.B. Fuller announced the acquisition of Fourny NV to strengthen its Construction Adhesives business in Europe.


Global Acrylic Adhesives Market Report Scope
Aerospace, Automotive, Building and Construction, Footwear and Leather, Healthcare, Packaging are covered as segments by End User Industry. Reactive, Solvent-borne, UV Cured Adhesives, Water-borne are covered as segments by Technology. Asia-Pacific, Europe, Middle East & Africa, North America, South America are covered as segments by Region.End User Industry
| Aerospace |
| Automotive |
| Building and Construction |
| Footwear and Leather |
| Healthcare |
| Packaging |
| Other End-user Industries |
Technology
| Reactive |
| Solvent-borne |
| UV Cured Adhesives |
| Water-borne |
Region
| Asia-Pacific | Australia |
| China | |
| India | |
| Indonesia | |
| Japan | |
| Malaysia | |
| Singapore | |
| South Korea | |
| Thailand | |
| Rest of Asia-Pacific | |
| Europe | France |
| Germany | |
| Italy | |
| Russia | |
| Spain | |
| United Kingdom | |
| Rest of Europe | |
| Middle East & Africa | Saudi Arabia |
| South Africa | |
| Rest of Middle East & Africa | |
| North America | Canada |
| Mexico | |
| United States | |
| Rest of North America | |
| South America | Argentina |
| Brazil | |
| Rest of South America |
| End User Industry | Aerospace | |
| Automotive | ||
| Building and Construction | ||
| Footwear and Leather | ||
| Healthcare | ||
| Packaging | ||
| Other End-user Industries | ||
| Technology | Reactive | |
| Solvent-borne | ||
| UV Cured Adhesives | ||
| Water-borne | ||
| Region | Asia-Pacific | Australia |
| China | ||
| India | ||
| Indonesia | ||
| Japan | ||
| Malaysia | ||
| Singapore | ||
| South Korea | ||
| Thailand | ||
| Rest of Asia-Pacific | ||
| Europe | France | |
| Germany | ||
| Italy | ||
| Russia | ||
| Spain | ||
| United Kingdom | ||
| Rest of Europe | ||
| Middle East & Africa | Saudi Arabia | |
| South Africa | ||
| Rest of Middle East & Africa | ||
| North America | Canada | |
| Mexico | ||
| United States | ||
| Rest of North America | ||
| South America | Argentina | |
| Brazil | ||
| Rest of South America | ||


Market Definition
- End-user Industry - Building & Construction, Packaging, Automotive, Aerospace, Woodworking & Joinery, Footwear & Leather, Healthcare, and Others are the end-user industries considered under the acrylic adhesives market.
- Product - All acrylic adhesive products are considered in the market studied
- Resin - Under the scope of the study, different kinds of acrylate monomers, like 2-Ethylhexyl acrylate and butyl acrylate are considered
- Technology - For the purpose of this study, Water-borne, Solvent-borne, Reactive, Hot Melt, and UV Cured adhesive technologies are taken into consideration.
| Keyword | Definition |
|---|---|
| Hot-melt Adhesive | Hot melt adhesives are generally 100% solid formulations, based on thermoplastic polymers. They are solid at room temperature and are activated upon heating above their softening point, at which stage they are liquid, and hence, can be processed. |
| Reactive Adhesive | A reactive adhesive is made up of monomers that react in the adhesive curing process and do not evaporate from the film during use. Instead, these volatile components become chemically incorporated into the adhesive. |
| Solvent-borne Adhesive | Solvent-borne adhesives are mixtures of solvents and thermoplastic, or slightly cross-linked polymers, such as polychloroprene, polyurethane, acrylic, silicone, and natural and synthetic rubbers (elastomers). |
| Water-borne Adhesive | Water-borne adhesives use water as a carrier or diluting medium to disperse a resin. They are set by allowing the water to evaporate or be absorbed by the substrate. These adhesives are compounded with water as a diluent, rather than a volatile organic solvent. |
| UV Cured Adhesive | UV curing adhesives induce curing and create a permanent bond without heating by using ultraviolet (UV) light or other radiation sources. An aggregation of monomers and oligomers is cured or polymerized by ultraviolet (UV) or visible light in a UV adhesive. Because UV is a radiating energy source, UV adhesives are often referred to as radiation curing or rad-cure adhesives. |
| Heat-resistant Adhesive | Heat-resistant Adhesives refer to those that do not break down under high temperatures. One aspect of a complicated system of circumstances is the adhesive's capacity to withstand disintegration brought on by high temperatures. As the temperature rises, adhesives may liquefy. They can withstand stresses resulting from differing coefficients of expansion and contraction, which might be an additional advantage. |
| Reshoring | Reshoring is the practice of moving commodity production and manufacturing back to the nation where the business was founded. Onshoring, inshoring, and back shoring are further terms used. Offshoring, the practice of producing items abroad to lower labor and manufacturing costs, is the opposite of this. |
| Oleochemicals | Oleochemicals are compounds produced from biological oils or fats. They resemble petrochemicals, which are substances made from petroleum. The oleochemical business is built on the hydrolysis of oils or fats. |
| Nonporous Materials | Nonporous materials are substances that do not permit the passage of liquid or air. Nonporous materials are those that are not porous, such as glass, plastic, metal, and varnished wood. Since no air can get through, less airflow is required to raise these materials, negating the requirement for high airflow. |
| EU-Vietnam Free Trade Agreement | A trade agreement and an investment protection agreement were concluded between the European Union and Vietnam on June 30, 2019. |
| VOC content | Compounds with limited solubility in water and high vapor pressure are known as Volatile Organic Compounds (VOCs). Many VOCs are human-made chemicals that are used and produced in the manufacture of paints, pharmaceuticals, and refrigerants. |
| Emulsion Polymerization | Emulsion polymerization is a method of producing polymers or connected groups of smaller chemical chains known as monomers, in a water solution. The method is often used to make water-based paints, adhesives, and varnishes, in which the water stays with the polymer and is marketed as a liquid product. |
| 2025 National Packaging Targets | In 2018, the Australian Environment Ministry set the following 2025 National Packaging Targets: 100% of the packaging must be reusable, recyclable, or compostable by 2025, 70% of plastic packaging must be recycled or composted by 2025, 50% of average recycled content must be included in packaging by 2025, and problematic and unnecessary single-use plastic packaging must be phased out by 2025. |
| Russian Government’s Import Substitution Policy | The Western sanctions suspended the distribution of several high-tech items to Russia, including those required by the raw material export sectors and the military-industrial complex. In response, the government launched an "import substitution" scheme, appointing a special commission to oversee its implementation in early 2015. |
| Paper Substrate | Paper substrates are paper sheets, reels, or boards with a base weight of up to 400 g/m2 that has not been converted, printed or otherwise altered. |
| Insulation Material | A material that inhibits or blocks heat, sound, or electrical transmission is known as Insulation Material. The variety of insulation materials includes thick fibers like fiberglass, rock and slag wool, cellulose, and natural fibers as well as stiff foam boards and sleek foils. |
| Thermal Shock | A temperature change known as thermal shock generates stress in a material. It commonly results in material breakdown and is especially prevalent in brittle materials like ceramics. When there is a quick temperature change, either from hot to cold or vice versa, this process occurs abruptly. It occurs more frequently in materials with poor heat conductivity and insufficient structural integrity. |


Research Methodology
Mordor Intelligence follows a four-step methodology in all our reports.
- Step-1: Identify Key Variables: The quantifiable key variables (industry and extraneous) pertaining to the specific product segment and country are selected from a group of relevant variables & factors based on desk research & literature review; along with primary expert inputs. These variables are further confirmed through regression modeling (wherever required).
- Step-2: Build a Market Model: In order to build a robust forecasting methodology, the variables and factors identified in Step-1 are tested against available historical market numbers. Through an iterative process, the variables required for market forecast are set and the model is built on the basis of these variables.
- Step-3: Validate and Finalize: In this important step, all market numbers, variables and analyst calls are validated through an extensive network of primary research experts from the market studied. The respondents are selected across levels and functions to generate a holistic picture of the market studied.
- Step-4: Research Outputs: Syndicated Reports, Custom Consulting Assignments, Databases & Subscription Platforms


