Market Overview
| Study Period | 2021 - 2031 |
|---|---|
| Forecast Data Period | 2026 - 2031 |
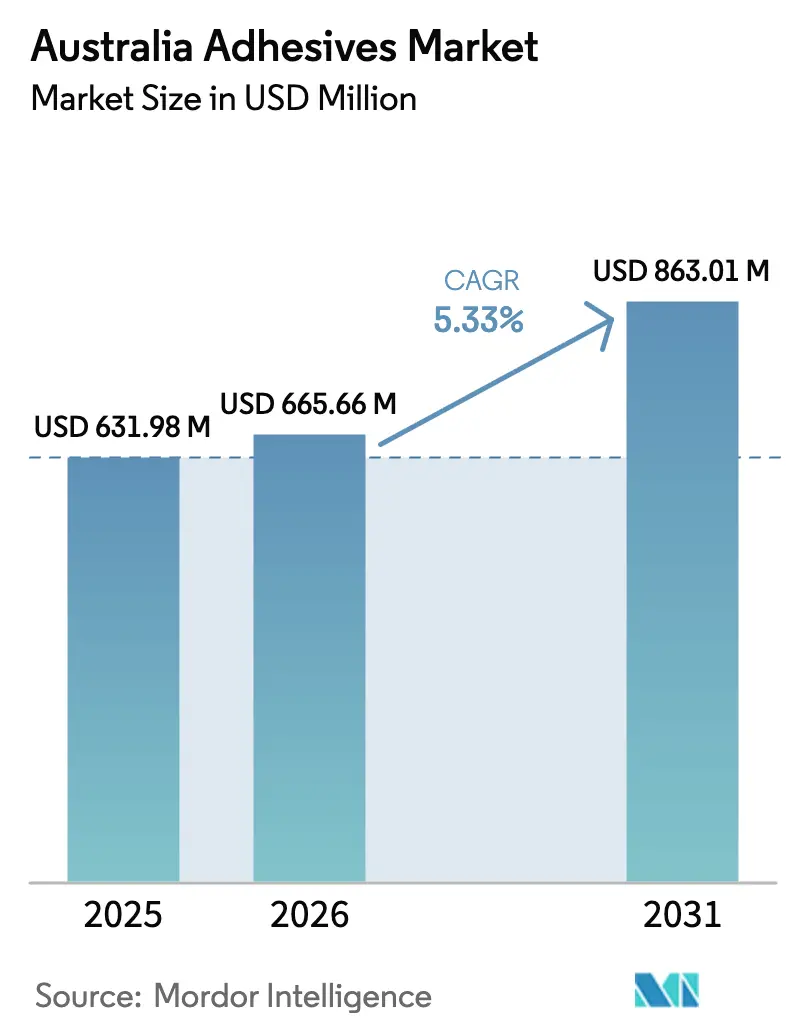
| Base Year Market Size (2025) | USD 631.98 Million |
| Market Size (2026) | USD 665.66 Million |
| Market Size (2031) | USD 863.01 Million |
| Growth Rate (2026 - 2031) | 5.33% CAGR |
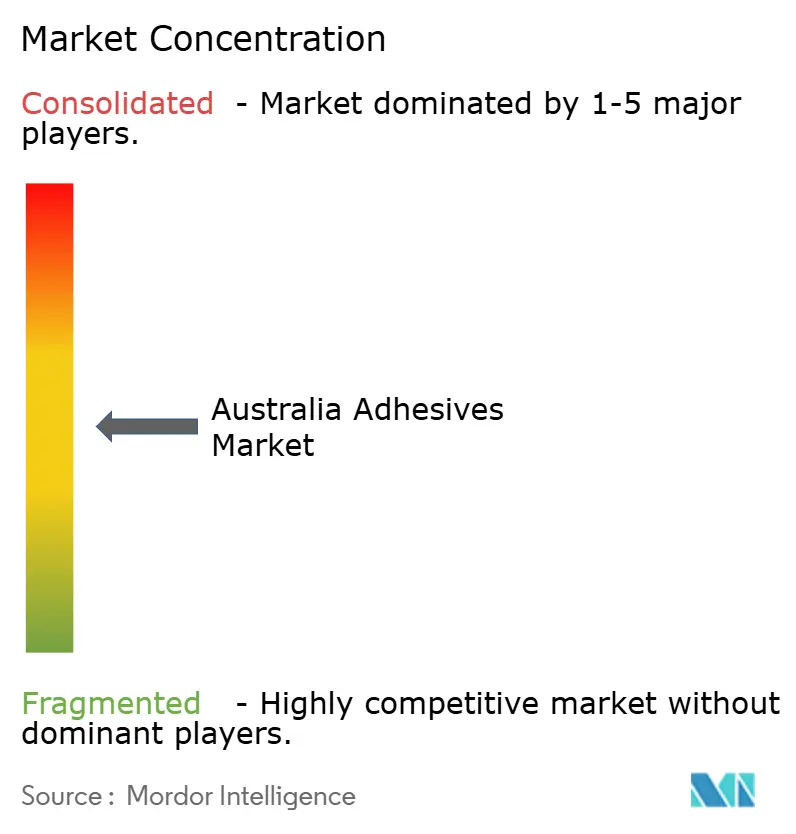
| Market Concentration | Medium |
Major Players *Disclaimer: Major Players sorted in no particular order Image © Mordor Intelligence. Reuse requires attribution under CC BY 4.0. | |
Australia Adhesives Market Analysis by Mordor Intelligence
The Australia Adhesives Market size is projected to be USD 631.98 million in 2025, USD 665.66 million in 2026, and reach USD 863.01 million by 2031, growing at a CAGR of 5.33% from 2026 to 2031. Residential construction activity, fast-rising parcel logistics, and tightening indoor-air-quality rules are the principal forces shaping the Australia Adhesives market. Low-VOC water-borne chemistries continue to gain favor because Green Star certification is now mandatory for federal building projects, while hot-melt systems benefit from high-speed corrugated case sealing and energy-saving applicators. End users in automotive electrification and aerospace maintenance are switching to structural bonding solutions that cut weight and improve fatigue resistance. Suppliers that can provide locally filled packs with robust environmental declarations are securing preferred-vendor status among contractors and converters.
Key Report Takeaways
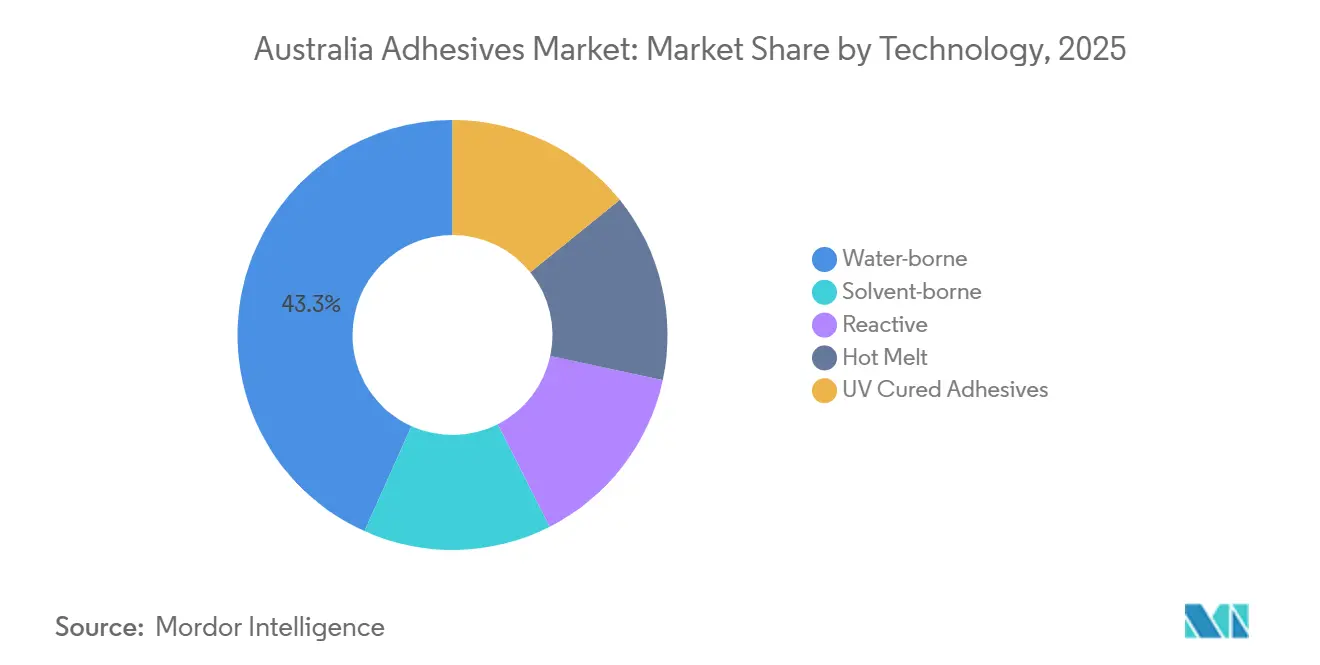
- By technology, water-borne adhesives led with 43.28% of the Australia Adhesives market share in 2025, while hot-melt systems are projected to record the fastest growth at a 6.45% CAGR through 2031.
- By resin, acrylics captured 25.22% of the Australia Adhesives market size in 2025, but vinyl-acetate-ethylene and ethylene-vinyl-acetate copolymers are the fastest risers at a 6.27% CAGR over 2026-2031.
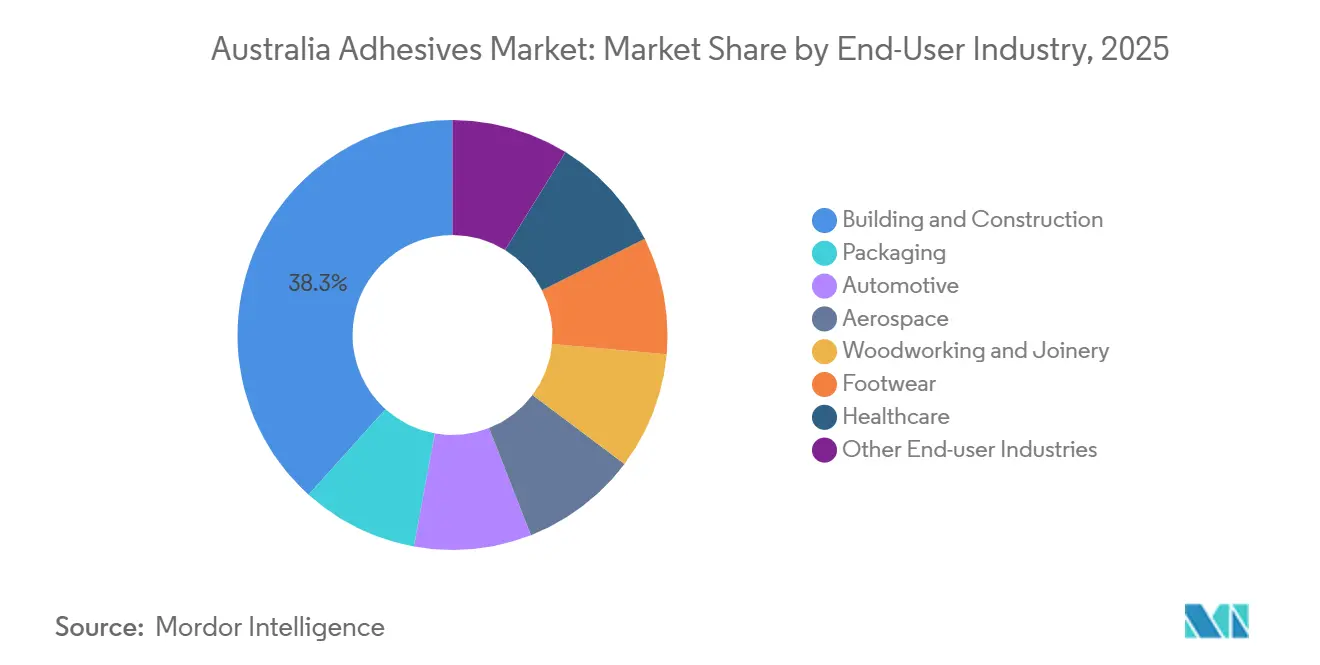
- By end-user industry, building and construction commanded 38.33% revenue in 2025, whereas automotive applications are forecast to expand at a 6.31% CAGR through 2031, owing to accelerating battery-electric vehicle output.
Note: Market size and forecast figures in this report are generated using Mordor Intelligence’s proprietary estimation framework, updated with the latest available data and insights as of January 2026.
Australia Adhesives Market Trends and Insights
Drivers Impact Analysis*
| Driver | (~) % Impact on CAGR Forecast | Geographic Relevance | Impact Timeline |
|---|---|---|---|
| Rapid uptake of lightweight composites in Australian aerospace MRO | +0.4% | National, concentrated in NSW and VIC aerospace hubs | Medium term (2–4 years) |
| E-commerce-driven demand spike for corrugated packaging | +1.2% | National, with highest intensity in NSW, VIC, and QLD distribution centres | Short term (≤ 2 years) |
| Green-star building certification favouring low-VOC, water-borne systems | +1.5% | National, early gains in Sydney, Melbourne, Brisbane CBD projects | Medium term (2–4 years) |
| Decarbonisation mandates pushing bio-based adhesive chemistries | +0.6% | National, policy-driven across federal and state procurement | Long term (≥ 4 years) |
| Mining sector automation needing high-temperature bonding | +0.5% | WA, QLD, NT mining regions | Medium term (2–4 years) |
| Source: Mordor Intelligence | |||


Rapid Uptake of Lightweight Composites in Australian Aerospace MRO
Composite airframe repairs in Australia now rely on epoxy and polyurethane adhesives that match original equipment specifications. Airflite operates a CASR Part 145 facility able to restore carbon-fiber control surfaces and nacelles for civil and military fleets[1]Airflite, “CASR Part 145 Composite Repair Services,” airflite.com.au. ATL Composites introduced TECHNIGLUE R28, a thixotropic epoxy manufactured domestically for high-load unmanned-air-system structures. Composite retrofits trim aircraft mass by up to 20%, cutting fuel burn and aligning with ICAO emissions targets. As fleets age, recurring bonding work underpins steady volumes for suppliers certified to aviation standards. The Australia Adhesives market benefits from the clustering of MRO hangars in Sydney and Melbourne, which shortens delivery times and lowers logistics risk.
E-Commerce-Driven Demand Spike for Corrugated Packaging
Online retail sales touched AUD 4.7 billion in June 2025, a 13% year-on-year increase, driving consumption of corrugated cases that use hot-melt and water-borne adhesives for sealing and tray forming. Robatech’s 2025 Alpha melter delivers 46% lower energy use versus prior units, while Valco Melton’s EcoStitch applicator cuts adhesive consumption by up to 70% through precision dosing[2]Robatech, “Alpha Melter Energy Savings,” robatech.com. The national target that all packaging be reusable, recyclable, or compostable by 2025 is hastening the switch from plastic to fiber-based formats, lifting demand for paperboard laminating glues. As fulfillment centers concentrate in NSW, VIC, and QLD, the Australia Adhesives market sees geographically focused surges in hot-melt volumes. Equipment retrofits that integrate Industry 4.0 analytics further cement hot-melt adoption by proving real-time cost savings.
Green-Star Building Certification Favouring Low-VOC Systems
The Green Building Council of Australia certified more than 1,000 projects in 2024-25, doubling the prior year, and Green Star Buildings v1.1 became compulsory for new registrations from May 2026. Credits reward adhesives with verified environmental product declarations and VOC levels below Good Environmental Choice Australia thresholds. Safe Work Australia limits of 1 ppm for formaldehyde, 50 ppm for toluene, and 80 ppm for xylene intensify pressure to reformulate solvent-borne products. Contractors thus favor water-borne acrylic and VAE dispersions for flooring, panel lamination, and interior fit-outs. With 46% of CBD office space already holding at least one Green Star rating, refurbishment jobs create repeat orders for compliant adhesives, reinforcing market momentum.
Decarbonisation Mandates Pushing Bio-Based Chemistries
Henkel’s net-zero roadmap, validated by the Science Based Targets initiative, commits to 90% absolute Scope 1-3 cuts by 2045 and signals stronger demand for renewable feedstocks in Australia. IEA Bioenergy notes that bio-based adhesives command a 9% share in Europe at a competitive EUR 1.65 kg price point. Scion’s Ligate bio-adhesive, derived from wood-pulp by-products, is in commercial trials with panel producers in Australasia and matches conventional strength without formaldehyde release. An August 2025 study showed soybean-meal glue modified with sodium carboxymethyl cellulose, achieving 1.07 MPa wet shear along with antimicrobial performance, meeting indoor-air guidelines. Despite the promise, AICIS reviews for novel constituents can last up to 18 months, slowing scale-up. Early adopters in Green Star projects and export-oriented timber panels nonetheless create niches that lift the Australia Adhesives market.
Restraints Impact Analysis*
| Restraint | (~) % Impact on CAGR Forecast | Geographic Relevance | Impact Timeline |
|---|---|---|---|
| Tightening VOC limits under NICNAS reforms | -0.8% | National, affecting solvent-borne adhesive manufacturers and importers | Short term (≤ 2 years) |
| Skilled-labour shortages in timber joinery segment | -0.3% | National, acute in regional NSW, VIC, and QLD | Medium term (2–4 years) |
| Slow approval cycle for novel chemistries by APVMA | -0.2% | National, impacting bio-based and antimicrobial adhesive launches | Long term (≥ 4 years) |
| Source: Mordor Intelligence | |||
Tightening VOC Limits Under AICIS Reforms
AICIS scheduled vinyl acetate monomer in 2017, triggering warning-label needs for preparations above 1% because of carcinogenic concerns. A draft April 2024 assessment recommended stricter labeling for cyanoacrylates after sensitisation cases among beauty salon staff. Combined with workplace exposure ceilings, the rules force formulators to cut solvents or adopt reactive systems, adding R&D cost and extending time-to-market. The Australia Adhesives industry faces short-term margin compression and possible SKU rationalisation as smaller importers struggle with compliance studies.
Skilled-Labour Shortages in Timber Joinery
Furniture and joinery shops need trained operators for precise adhesive application, yet apprenticeship uptake is falling, and older technicians are retiring. The University of Melbourne demonstrated an adhesive-free timber-steel composite reaching 95% composite action, hinting at mechanical joining workarounds that sidestep labor constraints. In regional NSW and QLD, competition from infrastructure projects diverts carpenters away from cabinet shops, slowing the adoption of advanced water-borne adhesives that have tighter open-time windows. The drag on throughput trims short-term volumes in the Australia Adhesives market, especially for interior wood panels.
*Our forecasts treat driver/restraint impacts as directional, not additive. The impact forecasts reflect baseline growth, mix effects, and variable interactions.
Segment Analysis
By Technology: Hot-Melt Gains on Automation and Energy Efficiency
Water-borne products remain the largest slice at 43.28% owing to Green Star traction, though raw-material inflation and longer set times moderate expansion. Solvent-borne lines retreat as compliance costs climb. Reactive polyurethane and epoxy chemistries hold defensive niches in aerospace, mining, and automotive where bond strength and thermal stability outweigh price sensitivity. UV-curable grades stay in specialty electronics because line-of-sight curing adds capex. Hot-melt systems' market share is forecasted to grow with a CAGR of 6.45% during the forecast period (2026-2031). Energy-efficient melters and electric applicators shrink running costs, while instant green strength permits faster case-packer speeds, improving overall equipment effectiveness for converters.
The Australia Adhesives market benefits from retrofit-friendly innovations such as Robatech Alpha’s backward compatibility to guns installed as early as 2000. Digital control of stitch patterns allows converters to reduce glue dots without jeopardizing case integrity, decreasing adhesive kilograms per thousand boxes, and directly boosting profit margins. These cost-out metrics resonate with procurement managers tasked with meeting corporate carbon budgets.


By Resin: VAE/EVA Copolymers Capture Dual-Use Advantage
VAE and EVA copolymers' market share is projected to grow with a CAGR of 6.27% during the forecast period (2026-2031), the fastest jump among resins. Their dual ability to function as low-VOC water-borne binders for joinery and as fast-setting hot-melts for packaging gives converters stocking simplicity and formulators sourcing leverage. Acrylics, while still the largest resin group with a market share of 25.22% in 2025, face substitution by silyl-modified hybrids that deliver better flexibility and solvent-free credentials, especially in facade sealants.
Polyurethane lines prosper in vehicle glass bonding and sports footwear assembly, yet stricter methylene-diphenyl-diisocyanate exposure thresholds raise handling precautions, nudging some assemblers toward SMP technology. Epoxies remain indispensable in composite repairs and mining-equipment overhaul, supported by locally made TECHNIGLUE R28 that meets aerospace shear standards. Regulatory scrutiny on cyanoacrylates for consumer eyelash glues introduces extra documentation, trimming volume in retail channels. Silicone sealants for high-temperature gaskets benefit from Soudal’s Western Sydney filling plant, which shortens lead times across Pacific construction markets.
By End-User Industry: Automotive Electrification Drives Composite Bonding
Building and construction retained 38.33% of the Australia Adhesives market share in 2025 as dwelling commencements climbed 11.6% year-on-year to 48,778 units and Green Star upgrades spread across CBD offices. Automotive demand is the growth engine: battery-electric sales reached 103,269 units in 2025 and require gap-filling, crash-durable adhesives for battery packs and mixed-material body structures, lifting segment CAGR to 6.31% through 2031. Packaging adhesives ride 13% annual growth in online retail parcels, aided by national plastic-waste reduction targets that steer grocery retailers toward paper-based formats. Aerospace MRO facilities in Perth and Melbourne continue to pull structural epoxies for radar-absorbing panels, while mining automation calls for heat-resistant bonding agents in ruggedised sensors.
Woodworking volumes are pressured by limited skilled labor and the emergence of mechanical joining systems that bypass glue lines. Footwear and medical sectors remain niche but valuable because they demand specialized biocompatible or high-peel formulations and hence command premium margins in the Australia Adhesives industry.
Geography Analysis
New South Wales and Victoria together delivered the most of national dwelling starts in the September 2025 quarter, concentrating construction-grade adhesive consumption around Sydney and Melbourne, where 46% of CBD office floors are already Green Star certified. Queensland shows brisk parcel-logistics expansion around Brisbane, which spurs corrugated box production that relies on hot-melt stitching equipment. Western Australia leads in mining automation; autonomous hauling fleets operating in the Pilbara require electronics potted with high-temperature silicone and epoxy compounds capable of surviving 120°C heat and constant vibration.
South Australia hosts naval-ship construction and composites work that consumes structural adhesives, while Tasmania’s forestry sector favors water-borne wood glues for panel lamination. The Australian Capital Territory, though small in volume, sets procurement precedents by insisting on Green Star and low-toxicity documentation for government refurbishments. Local warehousing of packaged adhesives in Perth and Darwin cuts lead times for remote mining camps, a logistical edge that international brands without regional depots lack. Consequently, suppliers with multi-state distribution nodes gain share across the Australia Adhesives market.
Competitive Landscape
The Australia Adhesives market is moderately fragmented. Domestic moves matter. Soudal commissioned a Western Sydney silicone filling line in 2025, enabling faster response to project-specific demand and slashing shipping costs. ATL Composites markets Australian-made TECHNIGLUE R28 for aerospace and marine, highlighting sovereign capability. Across the Australia adhesives industry, suppliers that pair local technical labs with verifiable environmental product declarations are winning specifications in Green Star projects.
Australia Adhesives Industry Leaders
3M
Henkel AG & Co. KGaA
Sika AG
H.B. Fuller Company
Selleys
- *Disclaimer: Major Players sorted in no particular order

Recent Industry Developments
- March 2026: Spicers Australia Pty Ltd, or Spicers Australia, revealed its intention to acquire Spandex Australia. Spandex Australia offers a range of products, from digital print media and adhesive films to vehicle wrapping films and laminates. This can help the Australian adhesives market grow.
- September 2025: Tex Year partnered with Australia's leading label manufacturer to create a clean-recycling label adhesive for HDPE milk bottles, which allows for the efficient detachment of labels from the bottles.


Australia Adhesives Market Report Scope
Adhesives, including glue, cement, and paste, bond two surfaces together, preventing their separation. Available in forms like liquid, paste, or tape, these substances are defined by their stickiness, allowing them to adhere to materials such as wood, metal, or skin.
The Australia Adhesives Market is segmented by technology, resin, and end-user industry. By Technology, the market is segmented into water-borne, solvent-borne, reactive, hot melt, and UV-cured adhesives. By Resin, the market is segmented into polyurethane, epoxy, acrylic, cyanoacrylate, VAE/EVA, silicone, and other resins. By End-user Industry, the market is segmented into building and construction, packaging, automotive, aerospace, woodworking and joinery, footwear, healthcare, and other end-user industries. The market sizes and forecasts are provided in terms of value (USD).
By Technology
| Water-borne |
| Solvent-borne |
| Reactive |
| Hot Melt |
| UV Cured Adhesives |
By Resin
| Polyurethane |
| Epoxy |
| Acrylic |
| Cyanoacrylate |
| VAE/EVA |
| Silicone |
| Other Resins |
By End-User Industry
| Building and Construction |
| Packaging |
| Automotive |
| Aerospace |
| Woodworking and Joinery |
| Footwear |
| Healthcare |
| Other End-user Industries |
| By Technology | Water-borne |
| Solvent-borne | |
| Reactive | |
| Hot Melt | |
| UV Cured Adhesives | |
| By Resin | Polyurethane |
| Epoxy | |
| Acrylic | |
| Cyanoacrylate | |
| VAE/EVA | |
| Silicone | |
| Other Resins | |
| By End-User Industry | Building and Construction |
| Packaging | |
| Automotive | |
| Aerospace | |
| Woodworking and Joinery | |
| Footwear | |
| Healthcare | |
| Other End-user Industries |


Market Definition
- End-user Industry - Building & Construction, Packaging, Automotive, Aerospace, Woodworking & Joinery, Footwear & Leather, Healthcare, and Others are the end-user industries considered under the adhesives market.
- Product - All adhesive products are considered in the market studied
- Resin - Under the scope of the study, resins like Polyurethane, Epoxy, Acrylic, Cyanoacrylate, VAE/EVA, and Silicone are considered
- Technology - For the purpose of this study, Water-borne, Solvent-borne, Reactive, Hot Melt, and UV Cured adhesive technologies are taken into consideration.
| Keyword | Definition |
|---|---|
| Hot-melt Adhesive | Hot melt adhesives are generally 100% solid formulations, based on thermoplastic polymers. They are solid at room temperature and are activated upon heating above their softening point, at which stage they are liquid, and hence, can be processed. |
| Reactive Adhesive | A reactive adhesive is made up of monomers that react in the adhesive curing process and do not evaporate from the film during use. Instead, these volatile components become chemically incorporated into the adhesive. |
| Solvent-borne Adhesive | Solvent-borne adhesives are mixtures of solvents and thermoplastic, or slightly cross-linked polymers, such as polychloroprene, polyurethane, acrylic, silicone, and natural and synthetic rubbers (elastomers). |
| Water-borne Adhesive | Water-borne adhesives use water as a carrier or diluting medium to disperse a resin. They are set by allowing the water to evaporate or be absorbed by the substrate. These adhesives are compounded with water as a diluent, rather than a volatile organic solvent. |
| UV Cured Adhesive | UV curing adhesives induce curing and create a permanent bond without heating by using ultraviolet (UV) light or other radiation sources. An aggregation of monomers and oligomers is cured or polymerized by ultraviolet (UV) or visible light in a UV adhesive. Because UV is a radiating energy source, UV adhesives are often referred to as radiation curing or rad-cure adhesives. |
| Heat-resistant Adhesive | Heat-resistant Adhesives refer to those that do not break down under high temperatures. One aspect of a complicated system of circumstances is the adhesive's capacity to withstand disintegration brought on by high temperatures. As the temperature rises, adhesives may liquefy. They can withstand stresses resulting from differing coefficients of expansion and contraction, which might be an additional advantage. |
| Reshoring | Reshoring is the practice of moving commodity production and manufacturing back to the nation where the business was founded. Onshoring, inshoring, and back shoring are further terms used. Offshoring, the practice of producing items abroad to lower labor and manufacturing costs, is the opposite of this. |
| Oleochemicals | Oleochemicals are compounds produced from biological oils or fats. They resemble petrochemicals, which are substances made from petroleum. The oleochemical business is built on the hydrolysis of oils or fats. |
| Nonporous Materials | Nonporous materials are substances that do not permit the passage of liquid or air. Nonporous materials are those that are not porous, such as glass, plastic, metal, and varnished wood. Since no air can get through, less airflow is required to raise these materials, negating the requirement for high airflow. |
| EU-Vietnam Free Trade Agreement | A trade agreement and an investment protection agreement were concluded between the European Union and Vietnam on June 30, 2019. |
| VOC content | Compounds with limited solubility in water and high vapor pressure are known as Volatile Organic Compounds (VOCs). Many VOCs are human-made chemicals that are used and produced in the manufacture of paints, pharmaceuticals, and refrigerants. |
| Emulsion Polymerization | Emulsion polymerization is a method of producing polymers or connected groups of smaller chemical chains known as monomers, in a water solution. The method is often used to make water-based paints, adhesives, and varnishes, in which the water stays with the polymer and is marketed as a liquid product. |
| 2025 National Packaging Targets | In 2018, the Australian Environment Ministry set the following 2025 National Packaging Targets: 100% of the packaging must be reusable, recyclable, or compostable by 2025, 70% of plastic packaging must be recycled or composted by 2025, 50% of average recycled content must be included in packaging by 2025, and problematic and unnecessary single-use plastic packaging must be phased out by 2025. |
| Russian Government’s Import Substitution Policy | The Western sanctions suspended the distribution of several high-tech items to Russia, including those required by the raw material export sectors and the military-industrial complex. In response, the government launched an "import substitution" scheme, appointing a special commission to oversee its implementation in early 2015. |
| Paper Substrate | Paper substrates are paper sheets, reels, or boards with a base weight of up to 400 g/m2 that has not been converted, printed or otherwise altered. |
| Insulation Material | A material that inhibits or blocks heat, sound, or electrical transmission is known as Insulation Material. The variety of insulation materials includes thick fibers like fiberglass, rock and slag wool, cellulose, and natural fibers as well as stiff foam boards and sleek foils. |
| Thermal Shock | A temperature change known as thermal shock generates stress in a material. It commonly results in material breakdown and is especially prevalent in brittle materials like ceramics. When there is a quick temperature change, either from hot to cold or vice versa, this process occurs abruptly. It occurs more frequently in materials with poor heat conductivity and insufficient structural integrity. |


Research Methodology
Mordor Intelligence follows a four-step methodology in all our reports.
- Step-1: Identify Key Variables: The quantifiable key variables (industry and extraneous) pertaining to the specific product segment and country are selected from a group of relevant variables & factors based on desk research & literature review; along with primary expert inputs. These variables are further confirmed through regression modeling (wherever required).
- Step-2: Build a Market Model: In order to build a robust forecasting methodology, the variables and factors identified in Step-1 are tested against available historical market numbers. Through an iterative process, the variables required for market forecast are set and the model is built on the basis of these variables.
- Step-3: Validate and Finalize: In this important step, all market numbers, variables and analyst calls are validated through an extensive network of primary research experts from the market studied. The respondents are selected across levels and functions to generate a holistic picture of the market studied.
- Step-4: Research Outputs: Syndicated Reports, Custom Consulting Assignments, Databases & Subscription Platforms


