Acromegaly Treatment Market Size and Share
Market Overview
| Study Period | 2020 - 2031 |
|---|---|
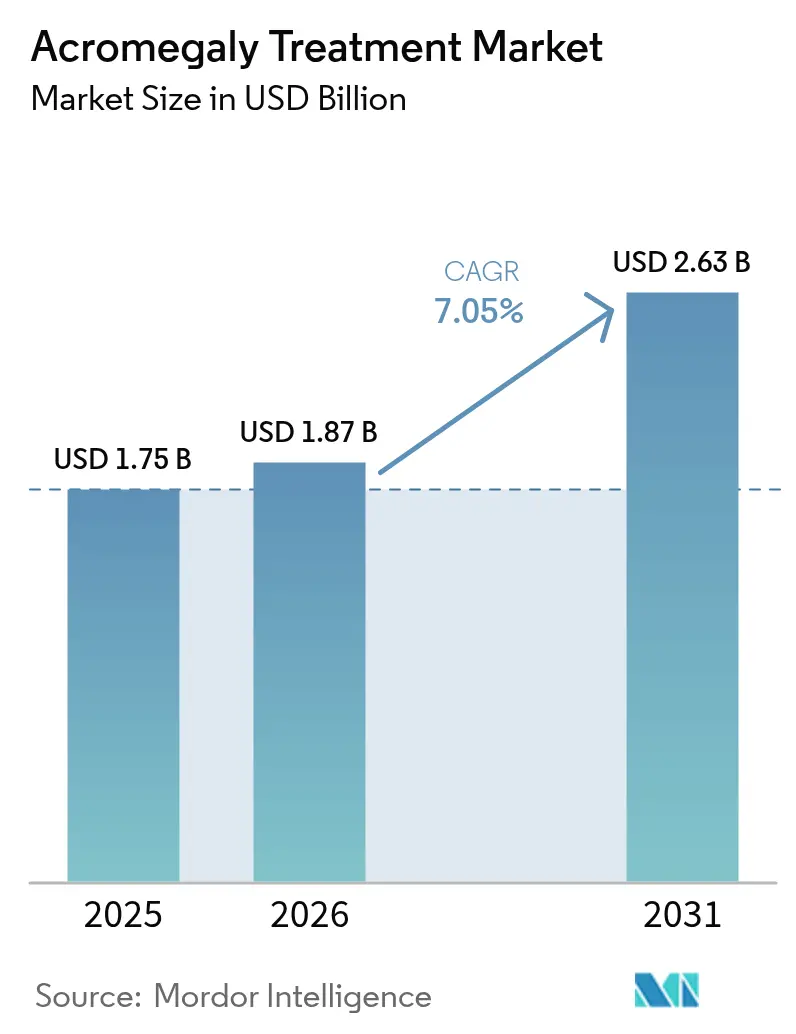
| Market Size (2026) | USD 1.87 Billion |
| Market Size (2031) | USD 2.63 Billion |
| Growth Rate (2026 - 2031) | 7.05% CAGR |
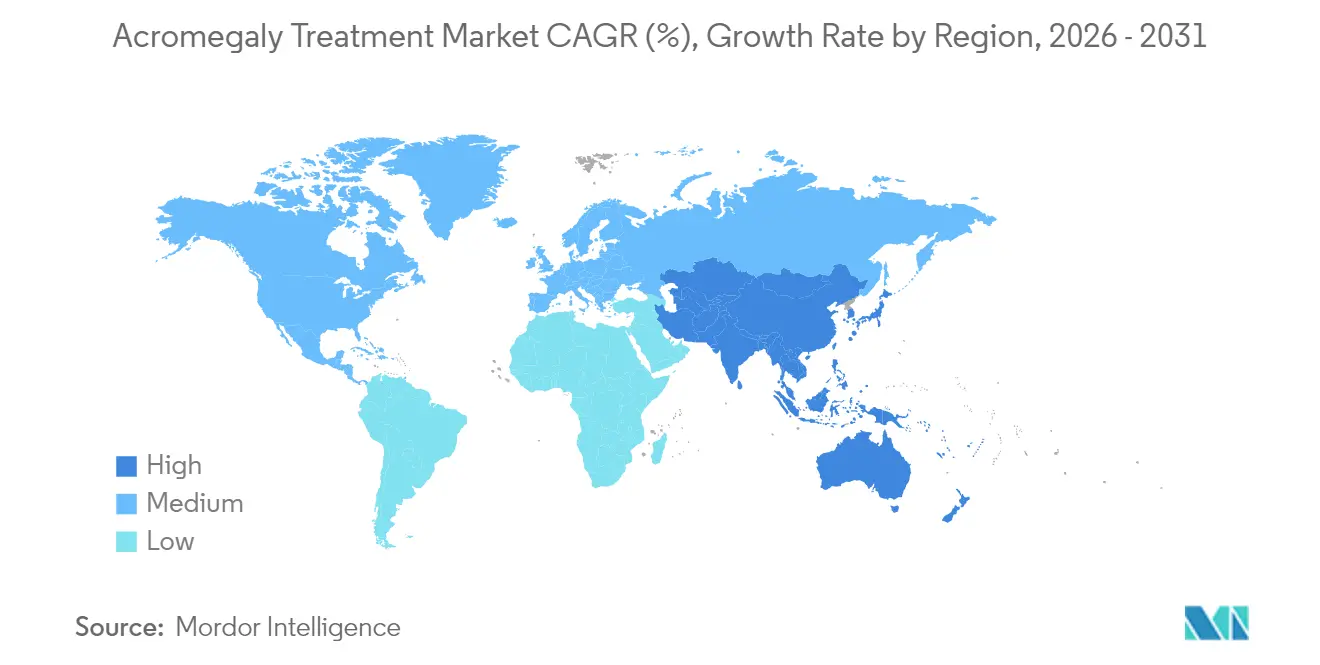
| Fastest Growing Market | Asia Pacific |
| Largest Market | North America |
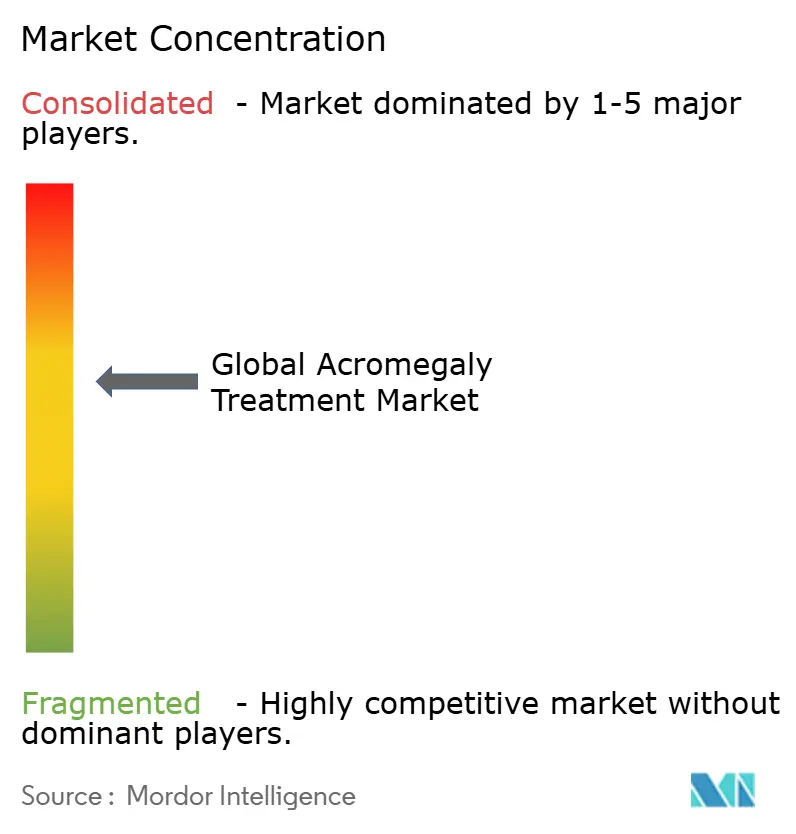
| Market Concentration | Medium |
Major Players *Disclaimer: Major Players sorted in no particular order Image © Mordor Intelligence. Reuse requires attribution under CC BY 4.0. | |
Acromegaly Treatment Market Analysis by Mordor Intelligence
Acromegaly treatment market size in 2026 is estimated at USD 1.87 billion, growing from 2025 value of USD 1.75 billion with 2031 projections showing USD 2.63 billion, growing at 7.05% CAGR over 2026-2031. Growth is fueled by a rising pool of diagnosed patients, earlier detection protocols, and the steady launch of patient-friendly long-acting formulations. Industry participants are allocating larger budgets to clinical programs that improve biochemical control rates and reduce dosing frequency, while payers are experimenting with outcomes-based agreements to offset therapy costs. Digital dispensing channels, especially online pharmacies, are scaling quickly as oral options reach the market, and specialized surgical centers are reinforcing demand for adjuvant pharmacological care. Competitive momentum is intensifying as emerging biotechs challenge established players with differentiated delivery platforms, setting the stage for a pipeline-driven shift in market leadership.
Key Report Takeaways
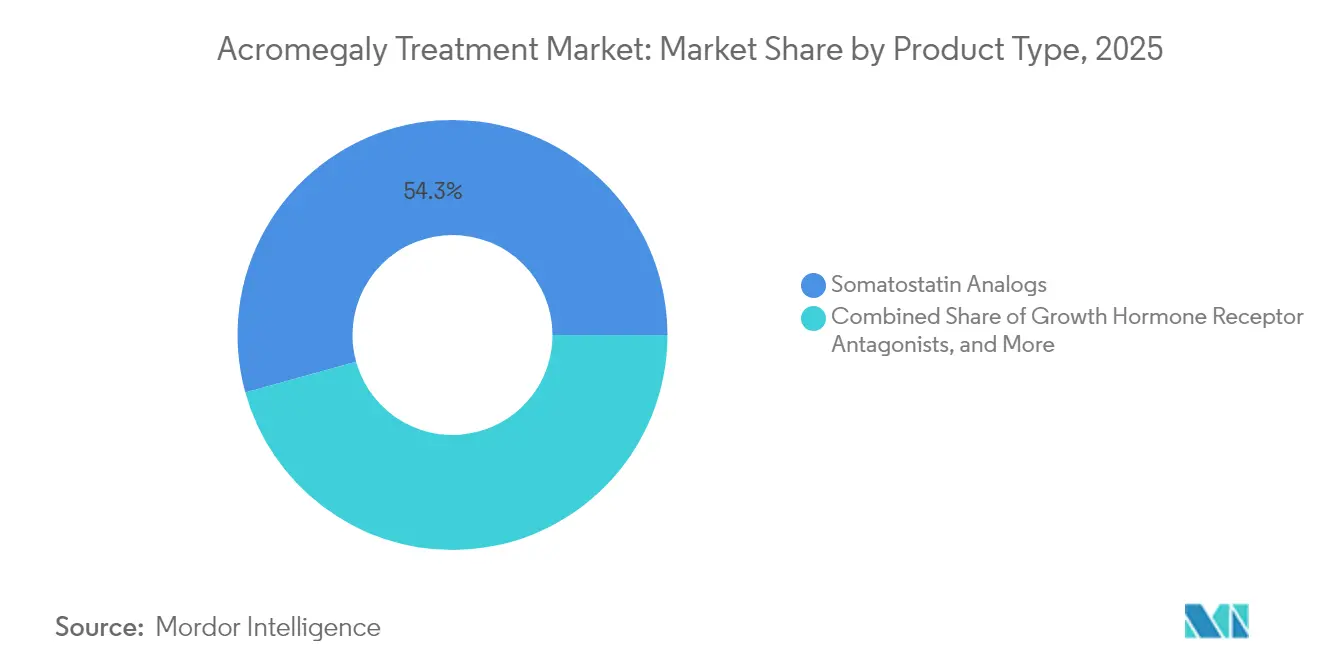
- By product type, somatostatin analogs led with 54.30% of the acromegaly treatment market share in 2025, while growth hormone receptor antagonists are projected to expand at a 9.15% CAGR to 2031.
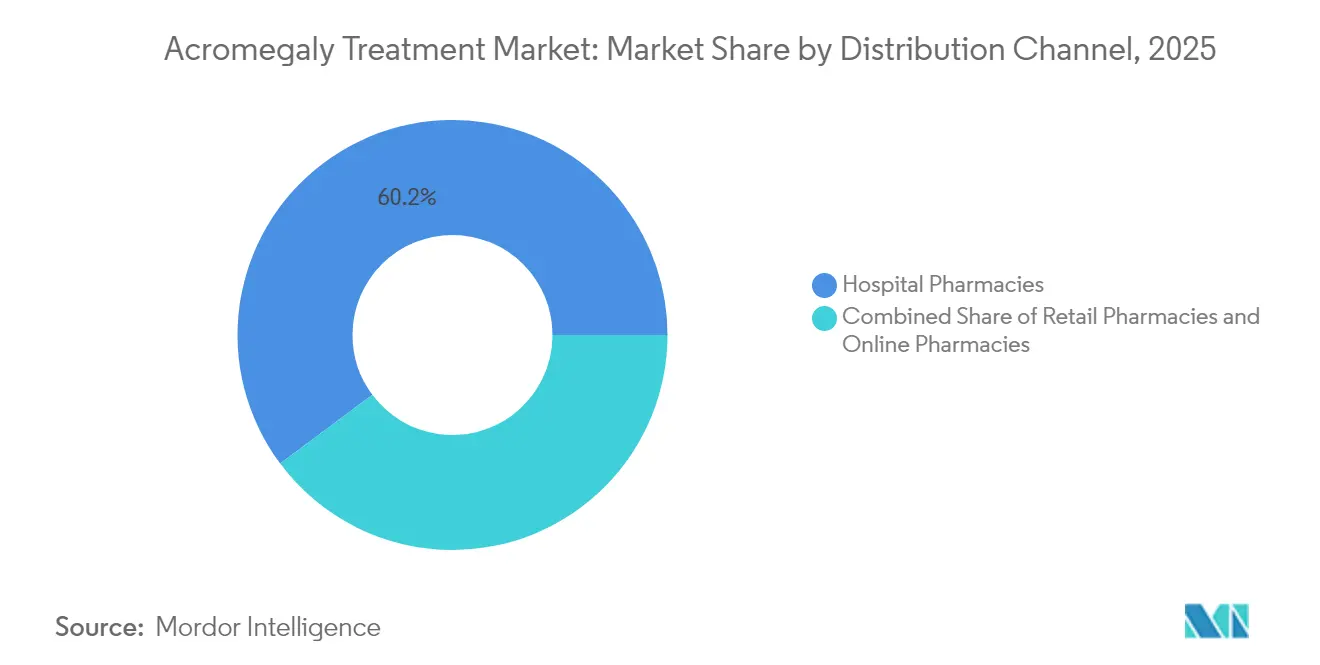
- By distribution channel, hospital pharmacies accounted for 60.20% share of the acromegaly treatment market size in 2025; online pharmacies are advancing at a 13.10% CAGR through 2031.
- By geography, North America held 42.60% of the acromegaly treatment market share in 2025; Asia Pacific is forecast to grow at an 7.95% CAGR between 2026 and 2031.
Note: Market size and forecast figures in this report are generated using Mordor Intelligence’s proprietary estimation framework, updated with the latest available data and insights as of 2026.
Global Acromegaly Treatment Market Trends and Insights
Drivers Impact Analysis*
| Driver | (~) % Impact on CAGR Forecast | Geographic Relevance | Impact Timeline |
|---|---|---|---|
| Rising prevalence of GH-secreting pituitary adenomas | +2.2% | Global, higher in Europe and North America | Long term (≥ 4 years) |
| Earlier diagnosis under updated Endocrine Society guidelines | +1.9% | North America & Europe, expanding in Asia Pacific | Medium term (2-4 years) |
| Transition toward long-acting depot formulations | +1.5% | Europe with spill-over to North America and Asia Pacific | Medium term (2-4 years) |
| Orphan-drug incentives accelerating R&D funding | +1.1% | Global, strongest in US and EU | Long term (≥ 4 years) |
| Growing adoption of MRI-guided trans-sphenoidal surgery creating adjuvant demand | +0.9% | North America, Europe, advanced systems in Asia | Medium term (2-4 years) |
| Expansion of national rare-disease reimbursement lists | +0.6% | China, Brazil, GCC | Medium term (2-4 years) |
| Source: Mordor Intelligence | |||
Rising Prevalence of Growth Hormone–Secreting Pituitary Adenomas
The global incidence of acromegaly now approaches 0.38 per 100,000 person-years, and prevalence has reached 5.9 per 100,000 population[1]Mi Kyung Kim, “Insulin-Like Growth Factor 1 as a Pillar in Acromegaly: From Diagnosis to Long-Term Management,” Endocrinology and Metabolism, doi.org. High-resolution MRI and sensitive IGF-1 assays shorten diagnostic delays and uncover latent cases, especially among middle-aged adults. A European registry tracking 3,173 patients reported a median diagnostic age of 43.5 years for men and 46.4 years for women, with noted delays in female cohorts[2]Patrick Petrossians, “Acromegaly at Diagnosis in 3173 Patients from the Liège Acromegaly Survey Database,” Endocrine-Related Cancer, erc.bioscientifica.com. As the recognized patient base expands, manufacturers are scaling production capacity and broadening compassionate-use programs, while insurers model higher long-term spending on endocrine disorders.
Earlier Diagnosis from Endocrine Society Guideline Uptake
The 14th Acromegaly Consensus shifted the confirmatory threshold to IGF-1 levels 1.3 times above the upper normal limit, removing the need for routine GH suppression tests. Specialized centers now report a compressed diagnostic lag of 5-7 years versus the previous 10-12-year average. Earlier intervention expands the acromegaly treatment market by adding patients who previously progressed to advanced disease states. Laboratories offering same-day IGF-1 testing see double-digit revenue gains, and multidisciplinary clinics integrate sleep-apnea and diabetes screenings to flag high-risk individuals sooner.
Transition Toward Long-Acting Depot Formulations in Europe
European endocrinologists increasingly prescribe monthly depot injections that can be self-administered at home. In Phase 3 data, CAM2029 achieved biochemical control in 77.2% of participants compared with 37.5% on placebo. Patient preference surveys show 88.9% favor long-acting options for convenience and fewer injection-site reactions. Regulatory momentum continues; the European Medicines Agency issued a positive opinion for Oczyesa (octreotide) in April 2025. These developments are prompting hospital formularies to reorder stock toward depot versions, boosting recurring revenues for device-integrated delivery systems.
Orphan-Drug Incentives Accelerating R&D Funding
Seven investigational agents now hold orphan designation in either the US or EU, unlocking fee waivers, tax credits, and 10-year exclusivity in Europe. Paltusotine secured EU orphan status in March 2025, positioning Crinetics for an expedited review[3]European Medicines Agency, “CHMP Meeting Highlights April 2025,” ema.europa.eu. The National Institutes of Health earmarked USD 1.0 million in 2024 for a first-in-class antibody program directed at excess growth hormone activity. These incentives lower development risk, attract venture capital, and broaden the competitive field, reinforcing innovation cycles that keep the acromegaly treatment market on a high-growth trajectory.
Restraints Impact Analysis*
| Restraint | % Impact on CAGR Forecast | Geographic Relevance | Impact Timeline |
|---|---|---|---|
| Post-injection fibrosis and lipoatrophy limiting depot compliance | −1.5% | Global, higher where follow-up care is limited | Medium term (2-4 years) |
| Pegvisomant-induced liver enzyme elevations necessitating monitoring | −1.1% | Global, pronounced in low-resource diagnostics | Short term (≤ 2 years) |
| Limited specialist centers in low-income Africa & Caribbean nations | −0.8% | Africa, Caribbean, other low-income regions | Long term (≥ 4 years) |
| High annual therapy cost (> USD 250 K) constraining payer budgets | −1.3% | Global, highest impact where universal coverage is absent | Medium term (2-4 years) |
| Source: Mordor Intelligence | |||
Post-Injection Fibrosis & Lipoatrophy Limiting Depot Compliance
Long-term use of injectable somatostatin analogs leads to injection-site reactions in up to 20% of patients, with 5-8% developing significant fibrosis or lipoatrophy that forces regimen changes. Oral octreotide capsules deliver a 65% biochemical response without these complications but introduce challenges such as variable absorption and the need for twice-daily dosing. Clinicians now rotate injection sites more aggressively and consider early oral switchovers for high-risk profiles, yet real-world adherence data indicate continued attrition that erodes potential acromegaly treatment market size gains.
Pegvisomant-Induced Liver Enzyme Elevations Necessitating Monitoring
French ACROSTUDY data covering 312 patients over 6.3 years confirmed that pegvisomant normalizes IGF-1 in 64.4% of recipients but requires regular hepatic monitoring due to elevated transaminases. Annual monitoring adds USD 1,200-1,800 to treatment costs, intensifying payer scrutiny in value-based contracts. Combination regimens with somatostatin analogs raise hepatotoxicity risk to 11-15% of patients, prompting development of next-generation antagonists such as AZP-3813, which aims for lower liver liability.
*Our forecasts treat driver/restraint impacts as directional, not additive. The impact forecasts reflect baseline growth, mix effects, and variable interactions.
Segment Analysis
By Product Type: Somatostatin Analogs Maintain Dominance
Somatostatin analogs accounted for 54.30% of acromegaly treatment market share in 2025, anchored by Somatuline (lanreotide) revenue of USD 1,121.3 million. The segment benefits from broad guideline endorsements as first-line medical therapy and from depot innovations that enhance patient convenience. Growth hormone receptor antagonists held a smaller slice of the acromegaly treatment market size but are set to grow at 9.15% CAGR through 2031 as pegvisomant and pipeline entrants demonstrate high biochemical normalization rates. Oral nonpeptide agents such as paltusotine showed 83% IGF-1 control in PATHFNDR-1, signaling future shifts in prescribing patterns toward once-daily oral therapy.
Pipeline activity is reshaping competitive dynamics. CAM2029 offers once-monthly subcutaneous delivery with patient-enabled autoinjectors, improving adherence and reducing clinic visits. Developers are also exploring antisense RNA and GHRH receptor blockade to penetrate refractory disease niches. As these modalities reach late-stage trials, the acromegaly treatment industry may witness a redistribution of revenue streams, with oral and self-administered products capturing share from hospital-administered injectables.


By Distribution Channel: Hospital Pharmacies Lead, Online Segment Surges
Hospital pharmacies controlled 60.20% of the acromegaly treatment market in 2025 because complex injectables are typically initiated under specialist supervision. This channel benefits from integrated care pathways, bundled service billing, and close monitoring capabilities. The acromegaly treatment market size for hospital pharmacies will hold steady as new long-acting depots still require specialist oversight on initiation, dose titration, and MRI follow-up.
Online pharmacies represent the fastest-growing channel at a 13.10% CAGR, propelled by the commercialization of oral agents that bypass cold-chain handling. Wider telemedicine adoption removed geographic barriers for follow-up consultations, allowing accredited e-pharmacies to deliver costly endocrinology drugs directly to patients. Regulations such as the Prescription Drug Price Transparency Act highlight wide price spreads; in Minnesota alone, high drug prices affected 75,000 residents and added USD 53.2 million to state spending in 2022. Transparent pricing paired with direct-to-patient distribution positions the online segment to capture incremental acromegaly treatment market share over the next five years.
Geography Analysis
North America remains the anchor for the acromegaly treatment market, holding 42.60% share in 2025. Approximately 27,000 diagnosed patients reside in the United States, with 11,000 receiving pharmacologic intervention. The Inflation Reduction Act introduced a USD 2,000 cap on Medicare Part D out-of-pocket drug costs, improving adherence prospects for seniors. Academic centers in Boston, Houston, and Los Angeles are early adopters of oral somatostatin receptor agonists, accelerating physician experience curves and influencing guideline updates across the region.
Europe ranks second by revenue, driven by widespread use of long-acting depots and robust specialist networks. Surveyed Pituitary Tumor Centers of Excellence reported that 48.9% of patients are on medical therapy, with first-generation somatostatin receptor ligands as the preferred option for nearly half the cohort. Health technology assessment bodies such as NICE and IQWiG scrutinize incremental clinical value, leading to active price negotiations but also fostering uptake of cost-effective depot innovations. EMA approval cycles remain predictable, supporting steady expansion of the acromegaly treatment market size in large economies such as Germany, France, and Italy.
The Asia Pacific acromegaly treatment market is projected to grow at an 7.95% CAGR through 2031. China, Japan, and South Korea account for the bulk of regional volume, thanks to rising specialist density and expanded private insurance coverage. Thailand’s rare-disease audit showed only 46.8% of recommended medicines registered and just 22.93% listed as essential, underscoring lingering access gaps. India’s USD 574.5 million Production Linked Incentive scheme aims to localize manufacturing for complex injectables, which could cut costs and widen availability. As regional governments roll out universal health programs, demand for affordable depot and oral therapies will lift the overall acromegaly treatment market.

Competitive Landscape
Market concentration is moderate. Ipsen maintains leadership with Somatuline, representing roughly one-third of corporate revenue, while Novartis and Pfizer retain sizeable but stable positions through portfolio breadth. Recordati bolstered its presence by acquiring niche endocrine assets that complement its rare-disease focus. New entrants emphasize differentiated delivery; CAM2029 promises at-home monthly dosing, and paltusotine seeks to eliminate injections altogether. AZP-3813 from Amolyt Pharma targets improved hepatic safety to address pegvisomant drawbacks.
Strategic alliances and licensing deals accelerate technology transfer. Ipsen partners with device firms to co-develop pre-filled syringes that cut nurse administration time. Crinetics collaborates with contract manufacturers in Singapore to secure supply ahead of expected 2025 approval. Patent filings for octreotide nano-depot systems and oral receptor agonists surged 18% year-on-year, concentrated in the US and Europe but rising in Korea and China. Digital therapeutics add another competitive dimension; remote IGF-1 monitoring apps paired with smart injectors are in pilot studies at US academic centers.
White-space opportunities revolve around treatment-resistant disease that affects up to 40% of patients on first-generation analogs. Combination regimens integrating pegvisomant with somatostatin analogs report 90% biochemical control but remain cost-intensive and monitor-heavy. Companies that align value-based pricing with real-world evidence could break through payer resistance and expand reach within the acromegaly treatment market.
Acromegaly Treatment Industry Leaders
Novartis AG
Ipsen SA
Pfizer Inc.
Recordati S.p.A.
Amryt Pharma plc
- *Disclaimer: Major Players sorted in no particular order

Recent Industry Developments
- May 2025: The European Medicines Agency’s CHMP issued a positive opinion for Oczyesa (octreotide) for maintenance therapy in adults with acromegaly who responded to somatostatin analogues.
- March 2025: Crinetics Pharmaceuticals received EU orphan-drug designation for paltusotine, a once-daily oral selective somatostatin receptor type 2 agonist.
- February 2025: Camurus announced ACROINNOVA data showing 77.2% of CAM2029-treated patients achieved IGF-1 ≤ 1 ULN compared with 37.5% on placebo.


Research Methodology Framework and Report Scope
Market Definitions and Key Coverage
Our study defines the acromegaly treatment market as all prescription pharmaceutical products, both branded and generic, used to normalize serum IGF-1 or control tumor burden in adults with growth hormone-secreting pituitary adenomas. Revenues are recorded at manufacturer sales price and tracked across hospital, retail, and online pharmacy channels in 17 countries.
Scope exclusion: surgical fees, radiotherapy services, and diagnostic imaging equipment are outside this value pool.
Segmentation Overview
- By Product Type
- Somatostatin Analogs
- Growth Hormone Receptor Antagonists
- Dopamine Agonists
- Other Product Types
- By Distribution Channel
- Hospital Pharmacies
- Retail Pharmacies
- Online Pharmacies
- Geography
- North America
- United States
- Canada
- Mexico
- Europe
- Germany
- United Kingdom
- France
- Italy
- Spain
- Rest of Europe
- Asia-Pacific
- China
- Japan
- India
- Australia
- South Korea
- Rest of Asia-Pacific
- Middle East & Africa
- GCC
- South Africa
- Rest of Middle East & Africa
- South America
- Brazil
- Argentina
- Rest of South America
- North America
Detailed Research Methodology and Data Validation
Primary Research
We interview endocrinologists, neurosurgeons, and payers across North America, Europe, and three key Asia-Pacific markets to validate treated patient estimates, average yearly drug costs, and switching triggers between somatostatin analogs and GHR antagonists. Structured surveys with specialty pharmacists further clarify channel mark-ups and emerging depot formulation preferences.
Desk Research
Mordor analysts first assemble a fact base from non-paywalled tier-one repositories such as the NIH Rare Diseases Registry, Eurostat hospital discharge files, China NHC yearbooks, and OECD health expenditure tables. Therapy uptake patterns are cross-checked through US FDA Orange Book approvals, EMA PRAC minutes, and Canadian Patented Medicine Prices Review Board price files, followed by adverse event signals harvested from the FAERS dashboard. Subscription data sets, including D&B Hoovers for company revenue splits and Questel patent counts, help us track competitive intensity. This list is illustrative; many additional secondary sources inform the evidence stack.
Market-Sizing & Forecasting
A top-down prevalence to treated cohort build estimates the addressable pool using diagnosed prevalence, treatment penetration, and therapy adherence ratios. Results are stress tested with bottom-up cross-checks such as sampled ASP × vial volume from hospital tenders and limited supplier roll-ups. Key model drivers include median age at diagnosis, shift toward long-acting injectables, generic octreotide launch timing, payer orphan drug incentives, and regional GDP per capita trends. Multivariate regression projects each driver through 2030, and an ARIMA overlay captures sudden policy shocks. Data gaps, chiefly in emerging markets, are filled by linear interpolation bounded by expert agreed confidence ranges.
Data Validation & Update Cycle
Outputs pass a three-layer review: automated variance flags, senior analyst logic checks, and annual model refresh aligned with new clinical trial readouts. Interim updates are triggered by material events such as FDA approvals or price control rulings, ensuring clients always receive a current view.
Why Mordor's Acromegaly Treatment Baseline Earns Trust
Published figures often vary because firms choose different inclusion criteria, currency conversions, and refresh cadences.
Key gap drivers include: other publishers roll surgical and radiation revenues into drug sales, assume uniform dosing rather than real-world titration, or apply static exchange rates that ignore recent dollar strength. Mordor's disciplined scope, driver-level forecasting, and yearly refresh narrow these variances.
Benchmark comparison
| Market Size | Anonymized source | Primary gap driver |
|---|---|---|
| USD 1.75 B (2025) | Mordor Intelligence | - |
| USD 1.64 B (2024) | Global Consultancy A | Includes only five regions and applies flat adherence rate |
| USD 2.20 B (2023) | Industry Association B | Bundles surgery and radiation spend; assumes constant ASP growth |
In sum, our bottom checked top-down model, anchored to transparent drivers and refreshed every twelve months, delivers a balanced baseline that decision makers can reliably trace and replicate.


Key Questions Answered in the Report
What is the current size of the acromegaly treatment market?
The acromegaly treatment market is valued at USD 1.87 billion in 2026 and is projected to reach USD 2.63 billion by 2031.
Which therapy class dominates the market today?
Somatostatin analogs account for 54.30% of market share, reflecting their guideline-endorsed first-line status and strong sales of agents like lanreotide.
Why are online pharmacies gaining traction in this market?
Oral products such as octreotide capsules enable direct-to-patient shipping, and broader telehealth adoption supports remote prescription fulfillment, resulting in a 13.10% CAGR for online channels.
How are pricing pressures being addressed?
Payers favor outcomes-based contracts, and legislative actions like the Medicare Part D out-of-pocket cap aim to enhance affordability without stifling innovation.
Which pipeline product could disrupt current treatment patterns?
Paltusotine, an oral selective somatostatin receptor type 2 agonist, reported 83% IGF-1 normalization in late-stage trials and holds EU orphan designation, positioning it for potential market disruption in 2025.
Page last updated on:


