Market Overview
| Study Period | 2020 - 2031 |
|---|---|
| Forecast Data Period | 2026 - 2031 |
| Historical Data Period | 2020 - 2024 |
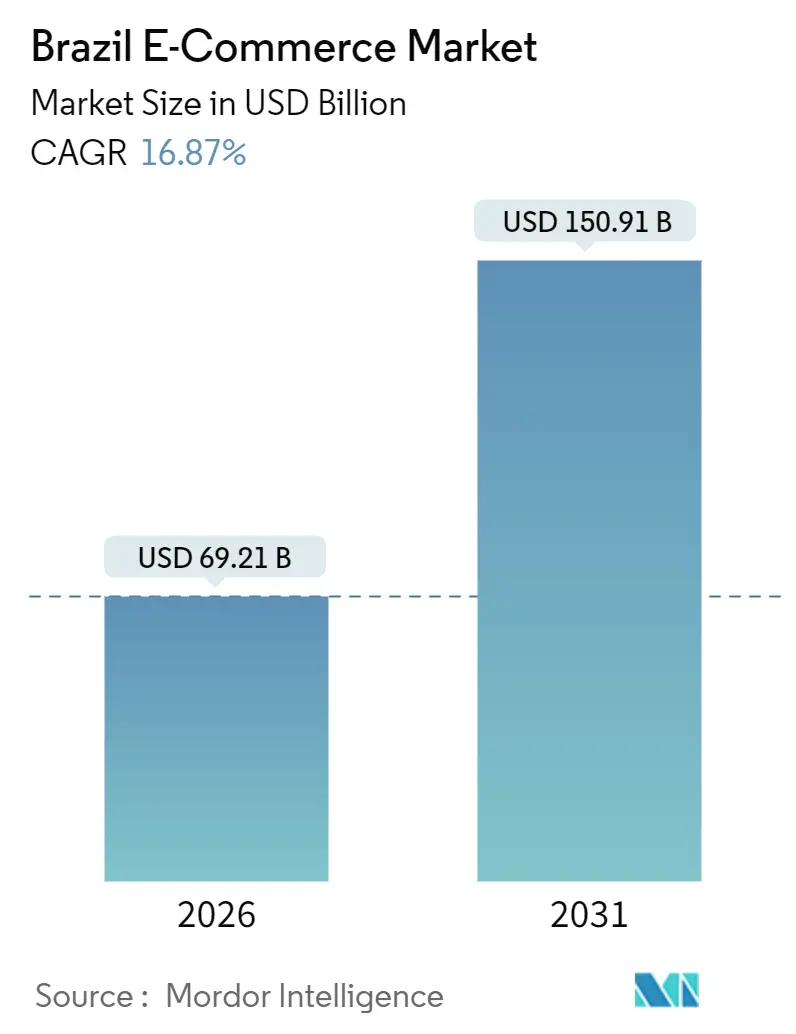
| Market Size (2026) | USD 69.21 Billion |
| Market Size (2031) | USD 150.91 Billion |
| Growth Rate (2026 - 2031) | 16.87% CAGR |
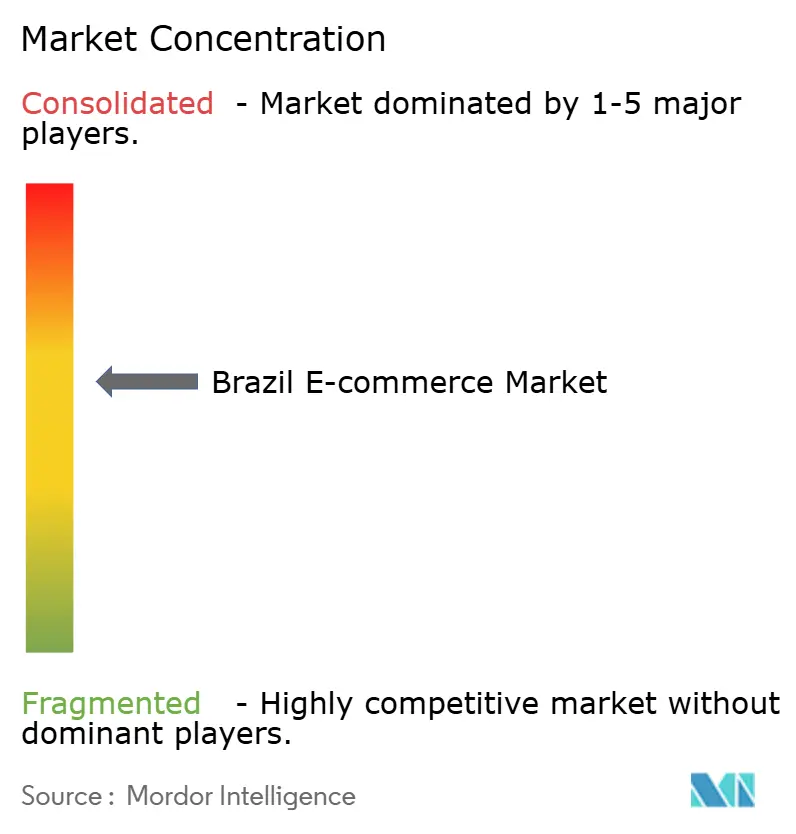
| Market Concentration | Medium |
Major Players *Disclaimer: Major Players sorted in no particular order Image © Mordor Intelligence. Reuse requires attribution under CC BY 4.0. | |
Brazil E-commerce Market Analysis by Mordor Intelligence
The Brazil E-commerce Market size is USD 69.21 billion in 2026 and is projected to climb to USD 150.91 billion by 2031, registering a 16.87% CAGR through the forecast period. Growth is propelled by the rapid uptake of Pix instant payments, accelerating smartphone penetration, and heavy logistics investments that trim delivery lead times below 24 hours in core metros. Mobile-first shopping, social-commerce formats, and open-banking-enabled credit expansion are broadening the shopper base well beyond Brazil’s affluent urban middle class. Competitive intensity is heightening as MercadoLibre, Amazon, and Shopee funnel billions of USD into fulfillment networks, fintech services, and influencer ecosystems, while domestic retailers shutter underperforming stores to redeploy capital online. At the same time, high road freight costs, elevated mobile-data prices, and fraud risks on real-time rails continue to clip margins for platforms that lack scale in payments or delivery.
Key Report Takeaways
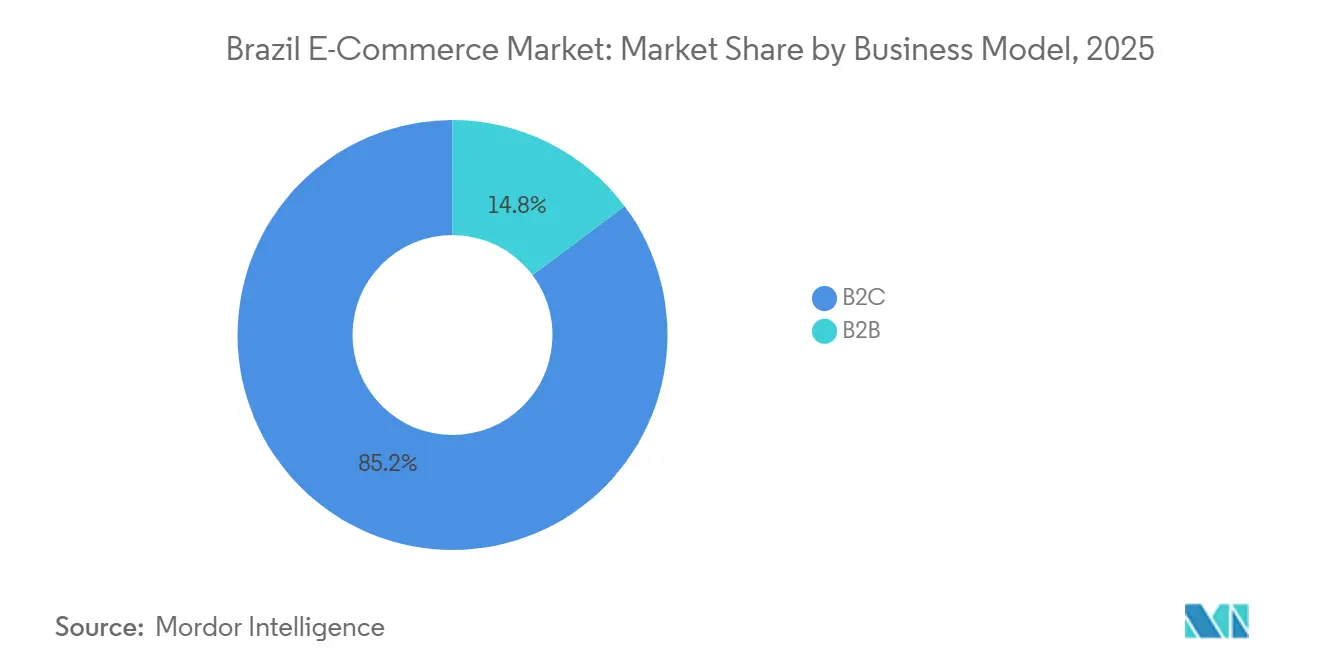
- By business model, B2C commanded 85.23% of the Brazil E-commerce Market share in 2025, while B2B is advancing at an 18.42% CAGR through 2031.
- By device, smartphones captured 53.67% of transaction value in 2025 and are expanding at a 17.48% CAGR.
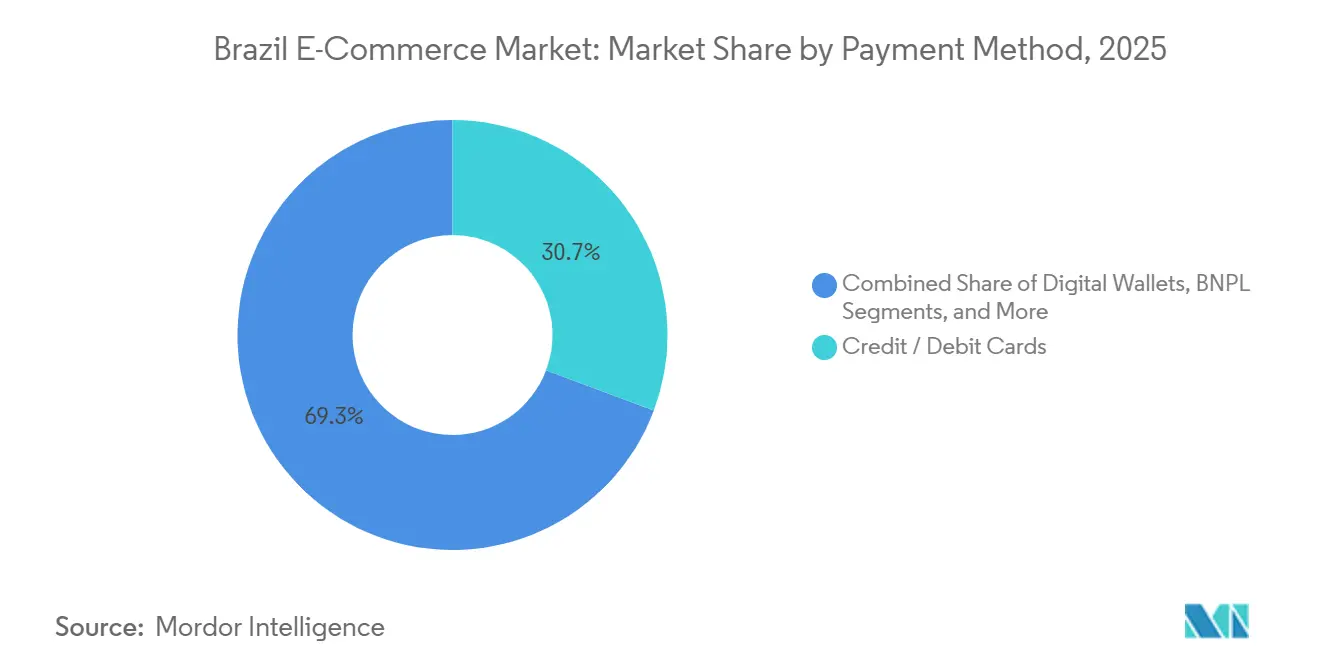
- By payment method, credit and debit cards held 30.72% of 2025 volume, yet Buy Now Pay Later solutions are scaling at an 18.67% CAGR to 2031.
- By B2C product category, fashion and apparel led with 24.73% revenue share in 2025, whereas food and beverages is projected to rise at a 16.72% CAGR.
Note: Market size and forecast figures in this report are generated using Mordor Intelligence’s proprietary estimation framework, updated with the latest available data and insights as of January 2026.
Brazil E-commerce Market Trends and Insights
Drivers Impact Analysis*
| Driver | (~) % Impact on CAGR Forecast | Geographic Relevance | Impact Timeline |
|---|---|---|---|
| Rapid Adoption of Instant Payments (Pix) | +3.8% | National, highest in Southeast and South | Short term (≤ 2 years) |
| Rising Smartphone and Broadband Penetration | +3.2% | National, strongest in North and Northeast | Medium term (2-4 years) |
| Expansion of Last-Mile and Same-Day Logistics | +2.9% | Major metros | Medium term (2-4 years) |
| Open-Banking-Driven Credit Innovations | +2.6% | Urban centers nationwide | Medium term (2-4 years) |
| Social-Commerce and Live-Streaming Boom | +2.1% | Youth cohorts nationwide | Short term (≤ 2 years) |
| Growth of Dark Stores in Secondary Cities | +1.7% | Curitiba, Porto Alegre, Recife, Fortaleza | Long term (≥ 4 years) |
| Source: Mordor Intelligence | |||
Rapid Adoption of Instant Payments (Pix)
Pix eliminates multi-day settlement lags and slashes merchant discount rates close to zero, freeing liquidity for small sellers who once waited weeks for card settlements.[1]Central Bank of Brazil, “Pix in Numbers,” bcb.gov.br The September 2025 launch of Pix installments aligned with Brazil’s parcelamento culture, pushing Pix to 44% of Brazil e-commerce transactions by year-end 2025. Card networks are responding with Pix-linked credit products, but the structural cost advantage of real-time rails continues to lure consumers and merchants alike. Faster fund availability strengthens working-capital cycles for SMEs and accelerates listing growth on major marketplaces. Fraud remains a concern, yet the Central Bank’s real-time monitoring and new chargeback rules are tempering consumer hesitation.
Rising Smartphone and Broadband Penetration
Smartphones, priced below BRL 1,000, and mobile broadband bundles are flooding rural and lower-income urban areas, adding tens of millions of first-time digital buyers each year.[2]Cable.co.uk, “Worldwide Mobile Data Pricing 2025,” cable.co.uk Greater 4G and fixed wireless coverage in the North and Northeast reduces the historical urban-rural divide in the Brazil E-commerce Market, while telcos’ zero-rating deals with retailers shrink onboarding friction. App-first interfaces, biometric log-ins, and localized recommendations keep engagement high even on entry-level handsets. These habits are sticky, driving a sustained shift away from desktop browsing. As coverage expands, average order values trend upward, reflecting increased trust in paying for high-ticket items via mobile.
Expansion of Last-Mile and Same-Day Logistics
MercadoLibre’s USD 6.4 billion logistics outlay for 2025 doubled its Brazilian distribution-center footprint and introduced 10,000 electric delivery vehicles, unlocking same-day fulfillment for 40% of orders in São Paulo by mid-2025.[3]MercadoLibre Inc., “Fourth Quarter 2024 Earnings Release,” investor.mercadolibre.com Amazon countered with three new automated fulfillment centers that cut pick-and-pack times by 30%. Dark-store operators like iFood and Rappi push two-hour delivery outside tier-one cities, raising consumer expectations nationwide. Improved speed lifts conversion rates, mitigates returns, and increases shopper tolerance for service fees. However, building density in Brazil’s sprawling urban peripheries demands sustained capital, favoring deep-pocketed incumbents over niche entrants.
Open-Banking Credit Innovations
Brazil’s 2024 Open Finance mandate gave fintechs API access to deposit and transaction histories across 750 institutions, enabling them to underwrite Buy Now Pay Later loans for 35 million previously un-scored consumers.[4]Central Bank of Brazil, “Pix Installments Launch,” bcb.gov.br Nubank’s NuPay and Pagaleve kept default rates below 4% in 2025 by analyzing cash-flow signals in real time. Higher credit availability lifts average order values 20-30% and reduces cart abandonment. Merchants gladly pay 3-5% BNPL fees in exchange for immediate payout certainty. Regulatory capital and disclosure rules safeguard borrowers, insulating the Brazil E-commerce Market from the over-leveraging seen in other regions.
Restraints Impact Analysis*
| Restraint | (~) % Impact on CAGR Forecast | Geographic Relevance | Impact Timeline |
|---|---|---|---|
| High Logistics Cost and Road Bottlenecks | -2.4% | National, worst in North and Center-West | Long term (≥ 4 years) |
| High Mobile-Data Cost for Low-Income Users | -1.8% | National, hits North and Northeast hardest | Medium term (2-4 years) |
| New Import-Tax Rules on Cross-Border Buys | -1.5% | Urban consumers nationwide | Short term (≤ 2 years) |
| Fraud Risk and Chargebacks on Pix System | -1.2% | High-volume metros | Short term (≤ 2 years) |
| Source: Mordor Intelligence | |||
High Logistics Cost and Road Bottlenecks
Logistics absorbs 12.6% of Brazil’s GDP, far above the 8% global mean, primarily because only 12% of federal highways are in good condition.[5]World Bank, “Logistics Performance Index 2024,” lpi.worldbank.org Freight averages 40 km per hour on intercity corridors and is slower in the Amazon basin, forcing e-commerce platforms to subsidize shipping or face cart abandonment. Regional fulfillment hubs in Recife and Manaus cut lead times but cannot fix upstream infrastructure deficits. Planned road concessions worth BRL 150 billion over five years promise relief, yet benefits will not meaningfully materialize before 2029. Until then, high transportation spend will keep pressure on gross margins across the Brazil E-commerce Market.
New Import-Tax Rules on Cross-Border Buys
At USD 3.52 per gigabyte, Brazil’s prepaid data costs dwarf those of peer markets, discouraging video-centric shopping behavior among low-income shoppers. Telecom concentration leaves little price competition, and 5G rollouts have yet to translate into cheaper plans. Platforms are countering with lightweight apps, caching, and offline catalogs, but social-commerce engagement remains muted outside higher-income metros. Until mobile data prices decline or Wi-Fi penetration expands, addressable demand in the North and Northeast will grow slower than national averages, tempering the overall Brazil E-commerce Market growth trajectory.
*Our forecasts treat driver/restraint impacts as directional, not additive. The impact forecasts reflect baseline growth, mix effects, and variable interactions.
Segment Analysis
By Business Model: B2B Platforms Unlock SME Procurement Efficiency
B2C transactions captured 85.23% of 2025 revenue, underscoring the historical dominance of consumer marketplaces. Yet the B2B arena is accelerating at an 18.42% CAGR, a pace that positions it as the single fastest-growing layer of the Brazil E-commerce Market by 2031. Small retailers and independent pharmacies are gravitating to digital procurement to access transparent pricing, bulk discounts, and net-30 credit without visiting cash-and-carry wholesalers. Mercado Shops B2B set a USD 2 billion gross merchandise value target for 2026 as 500,000 retailers registered on the platform.
Higher average order values, typically 10-15 times those of B2C baskets, and lower return rates improve contribution margins, encouraging incumbent consumer marketplaces to allocate engineering and marketing budgets toward B2B features. However, building trust with suppliers, automating invoicing, and aligning logistics for pallet-size orders remain non-trivial investments. Agricultural inputs, construction materials, and industrial spare parts stand out as white spaces where offline distribution is fragmented, but they require specialized technical support. Should these verticals migrate online, the Brazil E-commerce Market size for B2B categories could rise sharply after 2028.


By Device Type: Smartphones Cement Omnichannel Supremacy
Smartphones generated 53.67% of transaction value in 2025 and are tracking a 17.48% CAGR, making mobile the undisputed anchor of shopper engagement. MercadoLibre reports 75% of gross merchandise value originates from its apps, with average session length double that on desktop. The Brazil E-commerce Market size tied to desktop browsing is shrinking as younger consumers leapfrog PCs entirely.
Gamified check-in rewards, in-app live streams, and biometric one-tap checkout foster habitual use on entry-level devices. Progressive Web Apps serve customers with limited phone storage, widening the funnel. Voice assistants and smart-TV commerce remain niche given Portuguese language gaps and low connected-home penetration. Platforms that iterate weekly on app speed, navigation, and social integrations capture higher share-of-wallet, reinforcing the mobile flywheel that underpins the broader Brazil E-commerce Market.
By Payment Method: BNPL Digitizes Brazil’s Installment Tradition
Credit and debit cards kept a 30.72% share of 2025 transaction value, yet Buy Now Pay Later volumes are compounding at an 18.67% CAGR as open banking supplies real-time data for risk scoring. Nubank’s NuPay processed USD 3 billion in BNPL loans with default rates below 4%, proving that cash-flow analytics can outperform traditional bureau scores. Immediate merchant payouts, higher average order values, and lower cart abandonment rates spur adoption.
Pix repayment rails remove interchange fees, widening BNPL margins versus card instalments. Marketplaces embedding BNPL at checkout have observed 20-30% uplifts in conversion, and dynamic credit limits based on repayment discipline foster repeat spending. Visa and Mastercard transaction volumes in Brazil slid 12% in the first half of 2025, signaling that legacy card economics are losing relevance in the Brazil E-commerce Market.

By B2C Product Category: Quick Commerce Boosts Food and Beverages
Fashion and apparel led revenue with 24.73% share in 2025, bolstered by influencer-driven trends and fast-fashion imports even after a 20% import tax on purchases under USD 50. Yet food and beverages is the fastest-growing vertical at a 16.72% CAGR as quick-commerce players like iFood expand 15-minute grocery delivery beyond tier-one cities.
Electronics maintains strong turnover driven by smartphone upgrades, though price-comparison apps compress margins. Beauty and personal care brands leverage direct-to-consumer channels to bypass retailer markups, benefiting from Brazil’s position as the world’s fourth-largest cosmetics market. Furniture and home goods depend on augmented-reality tools and lenient return policies to offset fit uncertainty. As dark stores spread to secondary cities, perishable logistics become table stakes for capturing wallet share, and platforms with deep cold-chain capabilities will dictate the future shape of the Brazil E-commerce Market size in grocery.
Geography Analysis
Southeast Brazil, anchored by São Paulo, Rio de Janeiro, and Minas Gerais, generated roughly 55-60% of 2025 online revenue, reflecting affluent consumers, dense carrier networks, and high Pix penetration. The South added 18-20% of the Brazil E-commerce Market size, leveraging Mercosur trade corridors and comparable purchasing power. The Northeast captured only 12-15% despite housing 27% of the population because mobile-data costs suppress video-commerce engagement.
MercadoLibre’s fulfillment hubs in Recife and Fortaleza aim to chop Northeast lead times from 7-10 days to 48 hours, while Amazon’s Goiânia and Brasília centers bet on agribusiness demand in the Center-West. Shopee tailors free-shipping thresholds to price-sensitive consumers in the Northeast, lifting order frequency without eroding margins through bulk seller subsidies. North-region expansion hinges on river-based logistics and informal addressing, which MercadoLibre tackles through partnerships with local couriers versed in Amazon-basin delivery.
Cross-border flows are recalibrating after Brazil tightened import-duty collection in August 2024. International purchases dipped to USD 8 billion in 2025, yet Brazilian sellers exported USD 2.5 billion via Amazon Global Selling and MercadoLibre cross-border programs. Brazil’s regulatory clampdown nudges foreign players toward local warehousing, increasing capital commitments and deepening the competitive moat for domestic operators already embedded in regional supply chains.
Competitive Landscape
MercadoLibre, Amazon, and Magazine Luiza controlled an estimated 45-50% of 2025 gross merchandise value, leaving a long tail of vertical specialists, social-commerce start-ups, and quick-commerce disruptors to fight for the balance. Scale players sink capital into robotics, AI-driven personalization, and integrated fintech stacks that lock in shoppers through loyalty programs and credit bundles. MercadoLibre’s machine-learning fraud engine keeps logistics margins near 60%, while Amazon’s predictive-shipping patents pre-position inventory to shave delivery windows.
Shopee deploys gamified flash-sales and subsidized shipping to woo price-sensitive cohorts, recording 40% of its Latin America orders from Brazil by 2025. Quick-commerce firms Rappi and iFood stretch the competitive field by promising 15-30 minute delivery, a speed advantage incumbents match only in dense metros. Domestic retailers such as Via and Americanas close brick-and-mortar stores to redirect USD 200 million plus toward marketplace tech and last-mile partnerships.
Regulatory scrutiny intensifies around payments and cross-border trade, favoring incumbents with compliance teams and established tax footprints. Meanwhile, B2B and services marketplaces offer new fields where no single winner has emerged, keeping strategic optionality alive for challengers. The sustained capital cycle suggests continued market consolidation as smaller players struggle to fund infrastructure at the cadence demanded by Brazilian shoppers.
Brazil E-commerce Industry Leaders
Mercado Livre (MercadoLibre Inc.)
Amazon.com Inc.
Magazine Luiza S.A.
Americanas S.A.
Shopee (Sea Ltd.)
- *Disclaimer: Major Players sorted in no particular order

Recent Industry Developments
- January 2026: MercadoLibre acquired a minority stake in Loggi to boost same-day delivery capacity across São Paulo and Rio de Janeiro.
- December 2025: Amazon Brazil opened its first automated fulfillment center in Cajamar, cutting order processing time by 40%.
- November 2025: Magazine Luiza and Nubank launched a co-branded credit card with 5% cashback on marketplace purchases.
- October 2025: Shopee Brazil and Banco Inter rolled out working-capital loans up to BRL 500,000 for marketplace sellers.


Research Methodology Framework and Report Scope
Market Definitions and Key Coverage
Our study defines Brazil's e-commerce market as every domestic or cross-border purchase of physical goods or paid services that is initiated, paid for, and fulfilled through an internet-enabled interface, whether a mobile app, web store, or social-commerce feed. All sales arising from business-to-consumer and business-to-business storefronts that settle in Brazilian real and are delivered to end users inside the country are included.
Scope exclusion: purely digital content such as video streaming subscriptions, in-game currencies, and resale of second-hand items are outside this estimate.
Segmentation Overview
- By Business Model
- B2C
- B2B
- By Device Type (B2C)
- Smartphone / Mobile
- Desktop and Laptop
- Other Device Types
- By Payment Method (B2C)
- Credit / Debit Cards
- Digital Wallets
- BNPL
- Other Payment Methods
- By Product Category (B2C)
- Beauty and Personal Care
- Consumer Electronics
- Fashion and Apparel
- Food and Beverages
- Furniture and Home
- Toys, DIY and Media
- Other Product Categories
Detailed Research Methodology and Data Validation
Primary Research
We held structured interviews with executives of leading marketplaces, 3PL operators, and fintechs across Sao Paulo, Recife, and Porto Alegre, followed by shopper pulse surveys in tier-2 cities. Insights on Pix share, return rates, and average selling prices helped us validate secondary ratios and fine-tune regional weights.
Desk Research
Our analysts began with structured pulls from open data issued by bodies such as the Central Bank of Brazil (Pix transaction dashboards), the Brazilian Institute of Geography and Statistics, ABComm, and GSMA Intelligence. Trade filings, investor presentations, and marketplace traffic trackers supplied complementary signals on category splits, basket values, and logistics costs.
To ground company-level inputs, we consulted paid resources, D&B Hoovers for revenue splits and Dow Jones Factiva for historical news on platform launches, together with customs listings and Volza shipment indices to gauge cross-border flows. The sources cited here illustrate the range we used; many additional public and subscription datasets informed our desk research.
Market-Sizing & Forecasting
A top-down build started with total remote-payment volume, filtered by e-commerce share, average take-rate, and fraud reversal adjustments. Supplier roll-ups of sampled GMV and channel checks served as a bottom-up cross-test, and variances above five percent triggered reconciliation. Key model drivers include Pix transaction count, active online shoppers, smartphone connections, average basket value, logistics cost index, and cross-border share. Forecasts employ a multivariate regression linked to GDP per capita, mobile-broadband penetration, and instant-payment adoption, with scenario analysis to test taxation and logistics shocks.
Data Validation & Update Cycle
Outputs move through anomaly screens, peer review, and senior sign-off. Reports refresh annually; material events such as tax rule shifts prompt interim updates. Before delivery, a fresh data sweep ensures clients receive the latest view.
Why Mordor's Brazil E-commerce Baseline Commands Confidence
Published figures often diverge because firms pick different scopes, base years, and transaction filters. We focus on tangible goods plus paid services delivered domestically, apply constant-currency controls, and refresh the model every twelve months, which keeps our baseline tight and transparent.
Benchmark comparison
| Market Size | Anonymized source | Primary gap driver |
|---|---|---|
| USD 59.07 B (2025) | Mordor Intelligence | - |
| USD 346.0 B (2024) | Regional Payment Data Monitor | Includes digital media, ride-hailing, and all card-not-present recurring payments; no product segmentation |
| USD 455.6 B (2024) | Global Consultancy A | Combines B2B and B2C GMV, counts gross transaction value without fraud-return adjustment |
| USD 62.8 B (2023) | Trade Journal B | B2C only, uses local-currency figures converted at spot rates, older base year |
Taken together, the comparison shows that once scope inflation and currency effects are stripped out, Mordor's 2025 estimate offers a balanced, decision-ready baseline grounded in clearly auditable variables and repeatable steps.


Key Questions Answered in the Report
How large is the Brazil E-commerce Market in 2026 and how fast is it growing?
The Brazil E-commerce Market size is USD 69.21 billion in 2026 and is advancing at a 16.87% CAGR toward 2031.
Which business model is expanding fastest online in Brazil?
B2B platforms, serving SMEs and retailers, are scaling at an 18.42% CAGR, making them the fastest-growing slice of online commerce.
What payment trends are reshaping checkout behavior?
Buy Now Pay Later offerings tied to Pix and open-banking data are accelerating, while credit and debit card volumes are declining.
Which product category has the highest growth outlook?
Food and beverages lead on growth, expanding at a 16.72% CAGR as quick-commerce networks spread beyond major metros.
How are logistics investments influencing market leadership?
Billions in fulfillment centers, micro-hubs, and electric fleets let incumbents promise same-day or faster delivery, a key advantage in customer retention.
What are the main barriers to broader e-commerce adoption?
High road freight costs, infrastructure gaps, and elevated mobile-data prices continue to cap margins and limit participation among low-income shoppers.
Page last updated on:


