5G Fronthaul And Backhaul Equipment Market Size and Share
Market Overview
| Study Period | 2020 - 2031 |
|---|---|
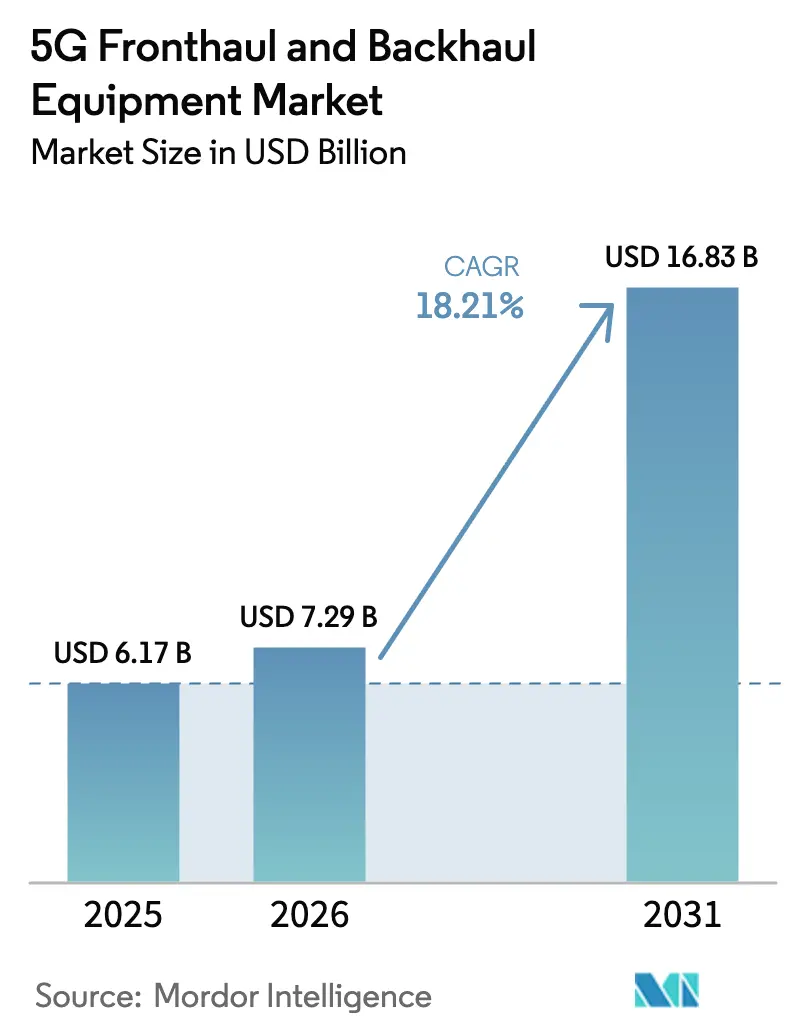
| Market Size (2026) | USD 7.29 Billion |
| Market Size (2031) | USD 16.83 Billion |
| Growth Rate (2026 - 2031) | 18.21% CAGR |
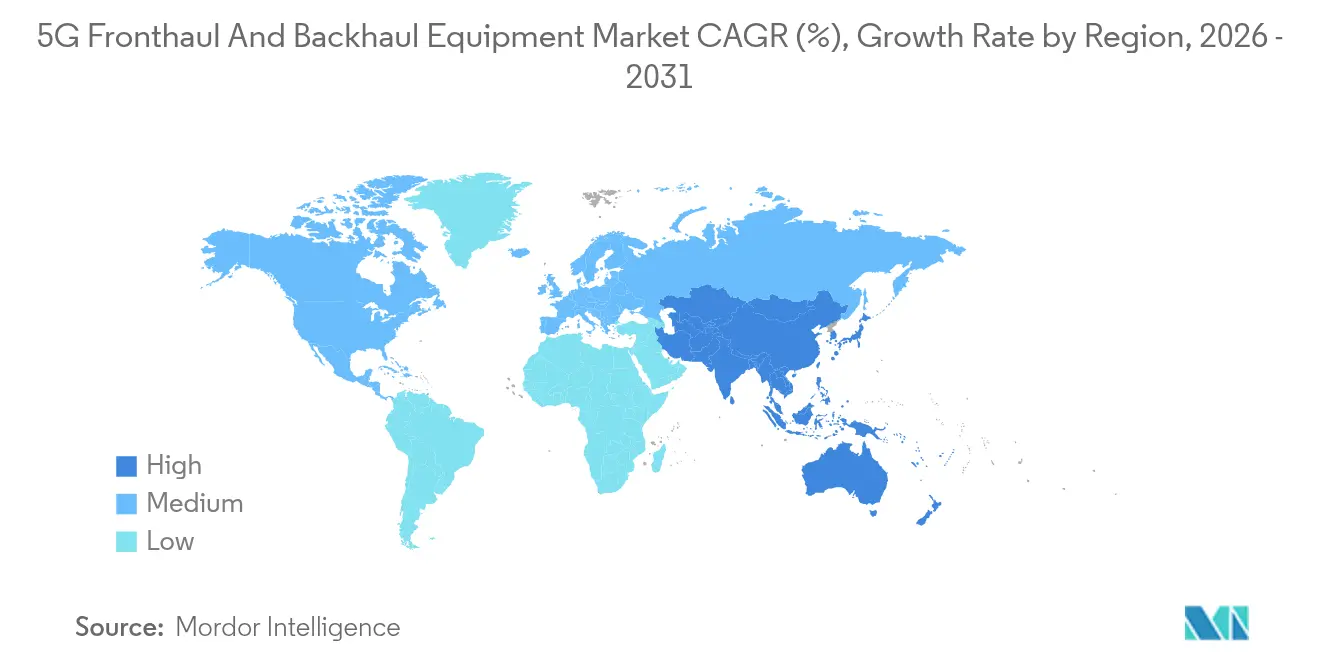
| Fastest Growing Market | Asia Pacific |
| Largest Market | Asia Pacific |
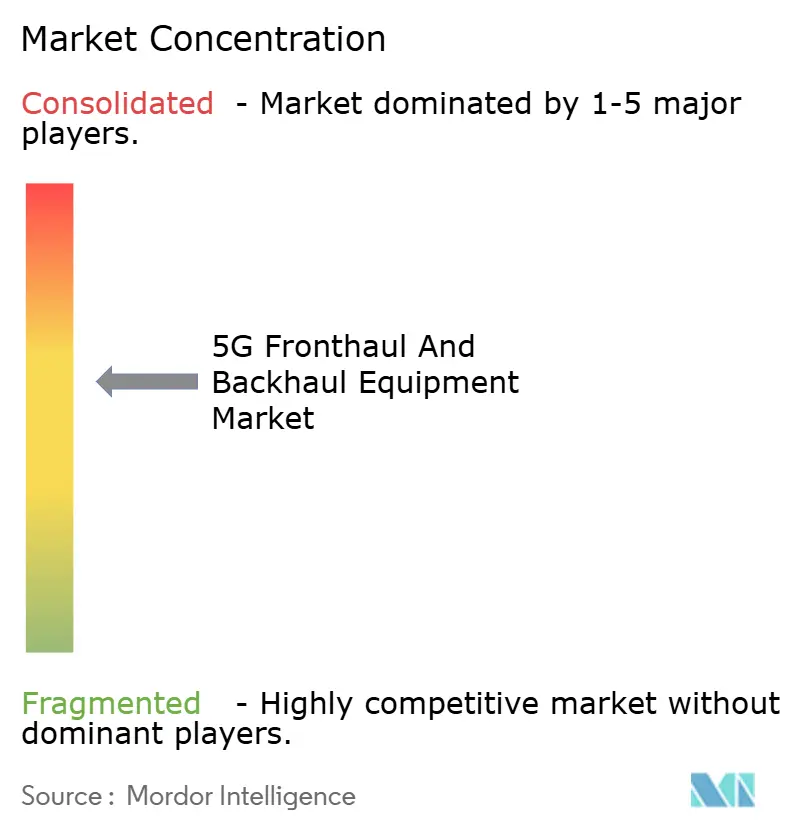
| Market Concentration | Medium |
Major Players *Disclaimer: Major Players sorted in no particular order Image © Mordor Intelligence. Reuse requires attribution under CC BY 4.0. | |
5G Fronthaul And Backhaul Equipment Market Analysis by Mordor Intelligence
The 5G Fronthaul And Backhaul Equipment Market size was valued at USD 6.17 billion in 2025 and estimated to grow from USD 7.29 billion in 2026 to reach USD 16.83 billion by 2031, at a CAGR of 18.21% during the forecast period (2026-2031).
Adoption gains stem from Open RAN architectures that need agile xHaul, enterprise demand for private 5G networks, and a broad shift toward software-defined transport that cuts lifecycle cost. Wireless E-band and V-band links ease fiber congestion in dense cities, while regional investments such as China’s 4.4 million 5G sites keep procurement activity elevated[4]RCR Wireless News, “China Surpasses 4.4 Million 5G Base Stations,” rcrwireless.com. Active spectrum liberalization plus vendor moves to bundle optical and radio assets accelerate addressable spending.
Key Report Takeaways
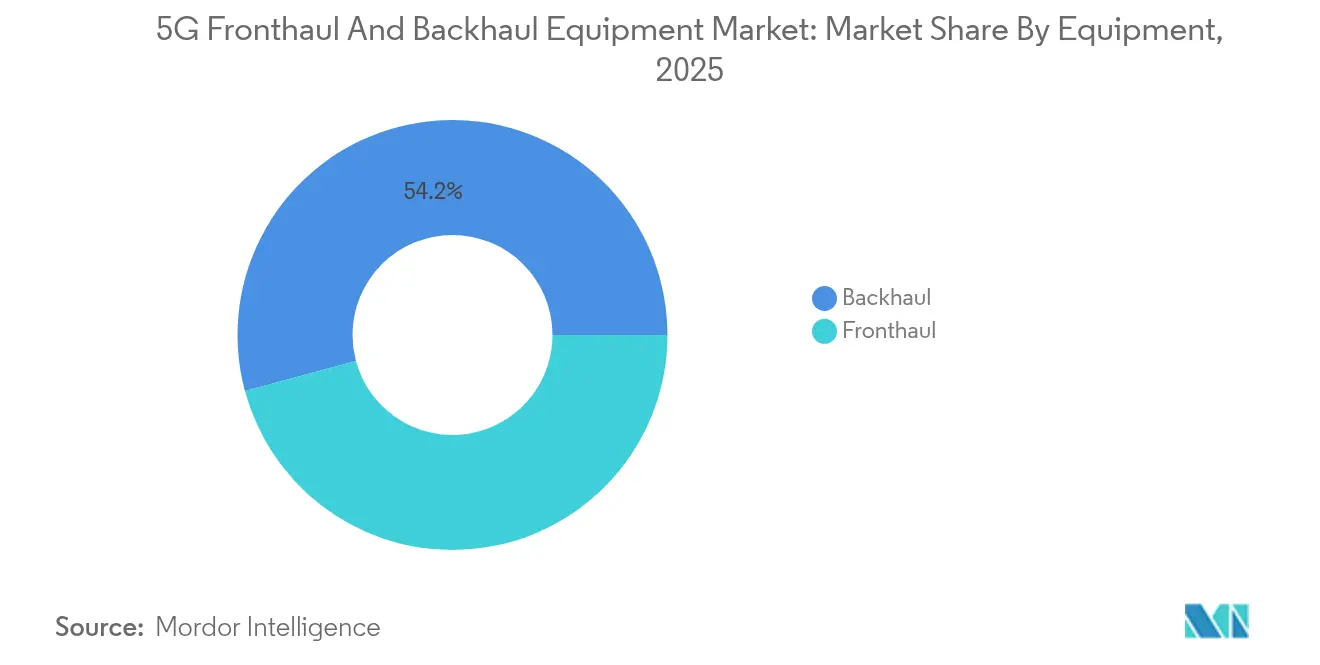
- By equipment, backhaul solutions held 54.20% revenue share of the 5G fronthaul and backhaul equipment market in 2025; they are also the fastest-growing segment at a 19.05% CAGR to 2031.
- By type, wireless systems led with 61.30% of the 5G fronthaul and backhaul equipment market share in 2025 and are expanding at a 19.35% CAGR through 2031.
- By frequency band, Sub-6 GHz captured 47.60% share of the 5G fronthaul and backhaul equipment market size in 2025, whereas E-band 70/80 GHz is projected to rise at a 19.55% CAGR to 2031.
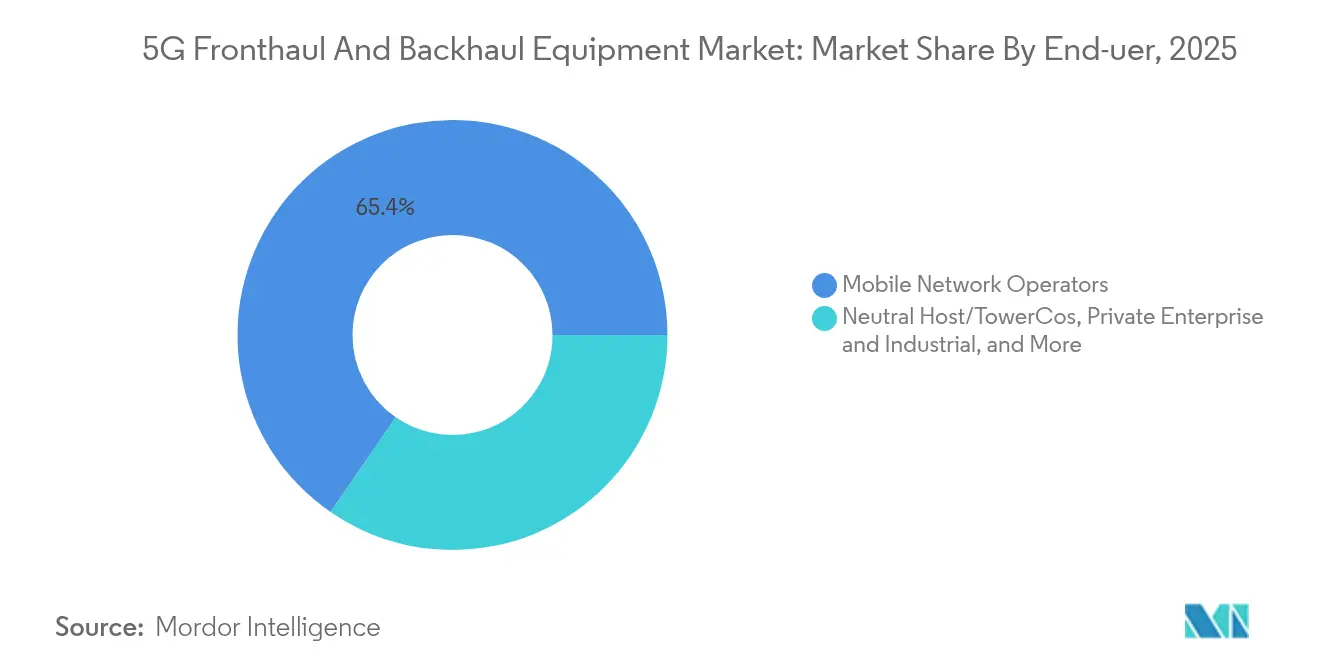
- By end-user, mobile network operators commanded 65.40% of 2025 revenue; private enterprise networks are advancing at an 18.60% CAGR.
- By application, enhanced mobile broadband accounted for 53.20% of the 5G fronthaul and backhaul equipment market in 2025, while fixed wireless access led growth at a 18.75% CAGR.
- By geography, Asia Pacific captured 37.60% regional share in 2025 and is growing quickest at a 19.80% CAGR on the back of multibillion-dollar 5G-A upgrades.
Note: Market size and forecast figures in this report are generated using Mordor Intelligence’s proprietary estimation framework, updated with the latest available data and insights as of 2026.
Global 5G Fronthaul And Backhaul Equipment Market Trends and Insights
Drivers Impact Analysis*
| Driver | % Impact on CAGR Forecast | Geographic Relevance | Impact Timeline |
|---|---|---|---|
| Rapid densification of urban 5G small-cell sites | +3.20% | APAC, North America | Short term (≤ 2 years) |
| Surge in Open RAN deployments demanding flexible xHaul | +2.80% | North America, Europe, APAC | Medium term (2–4 years) |
| Spectrum liberalization for private 5G enterprise networks | +2.10% | Global | Medium term (2–4 years) |
| Telco cap-ex shift toward software-defined transport | +1.90% | Global developed markets | Long term (≥ 4 years) |
| Source: Mordor Intelligence | |||
Rapid densification of urban 5G small-cell sites
Operators are adding high-density sites to satisfy city traffic growth; China alone installed over 4 million 5G cells by early 2025, requiring several new fronthaul links per location. Small cells cost a fraction of macro towers, so carriers reach capacity goals without matching capital outlay. Each node still needs secure fiber or wireless xHaul, which lifts aggregate demand for optical modules, passive WDM, and short-reach millimeter-wave radios. Densification also pushes network topologies from hub-and-spoke to mesh, rewarding vendors that ship compact, temperature-hardened hardware. As APAC cities target gigabit service tiers before 2027, procurement cycles for fronthaul switches and timing solutions remain brisk.
Surge in Open RAN deployments demanding flexible xHaul
Disaggregation lets carriers mix radio, distributed, and centralized units from multiple suppliers, yet it introduces sub-microsecond timing and variable bandwidth needs. Rakuten Symphony’s multivendor Open RAN builds in Japan and upcoming European Spring 6 tenders compel transport gear that supports both legacy CPRI and Ethernet eCPRI in one chassis. Vendors with software-programmable timing, precision sync, and slice-aware QoS thus enjoy an early-mover edge. As Open RAN share of new macro rollouts tops 25% in North America by 2026, aggregate xHaul ports scale sharply.
Spectrum liberalization for private 5G enterprise networks
Regulators from the FCC to Japan’s MIC have cleared mid- and high-band channels to let factories, ports, and logistics hubs run standalone 5G. Enterprises buy radios, fronthaul switches, and edge compute directly from vendors, shaving deployment cycles from years to months. Tesla and BMW plants illustrate the premium placed on deterministic latency, driving uptake of in-building fiber backhaul and compact mmWave repeaters. Vendor roadmaps increasingly include ruggedized, cabinet-free optical gear that fits industrial sites.
Telco cap-ex shift toward software-defined transport
Operators are trimming raw hardware spend and adding programmable control planes that automate provisioning. Verizon’s network-slice services and a Google Cloud-Ericsson 5G Core-as-a-Service show how software layers unlock revenue while lowering operations cost[1]Google Cloud, “Ericsson and Google Cloud Announce Ericsson On-Demand,” cloud.google.com. Transport vendors respond with intent-based orchestration, abstracting fiber, microwave, and switch fabrics behind open APIs that expose on-demand capacity.
Restraints Impact Analysis*
| Restraint | % Impact on CAGR Forecast | Geographic Relevance | Impact Timeline |
|---|---|---|---|
| Soaring fibre-lease rates in Tier-2/3 cities | -2.80% | Emerging markets | Short term (≤ 2 years) |
| Scarcity of skilled O-RAN & time-sync engineers | -1.20% | Developed markets | Medium term (2–4 years) |
| Source: Mordor Intelligence | |||
Soaring fibre-lease rates in Tier-2/3 cities
Limited duct capacity and escalating civil works expenses push lease prices beyond workable thresholds for many rural and peri-urban builds. Competition from national broadband funds concentrates demand on scarce dark fiber, pushing carriers toward point-to-point microwave even where fiber performance would be preferable. Wireless vendors thus win near-term bookings, but elevated opex for frequency licenses can erode savings over time.
Scarcity of skilled O-RAN & time-sync engineers
Open RAN rollouts call for integration, test, and sync experts who are in short supply. Consulting rates climb, delaying site acceptance and stretching payback periods. Smaller operators risk vendor lock-in to service integrators, which works against disaggregation’s cost goal. Training pipelines lag, so the constraint persists into 2028.
*Our forecasts treat driver/restraint impacts as directional, not additive. The impact forecasts reflect baseline growth, mix effects, and variable interactions.
Segment Analysis
By Equipment: Backhaul dominance amid converging architectures
Backhaul assets produced 54.20% of 2025 revenue for the 5G fronthaul and backhaul equipment market and will outpace overall growth at a 19.05% CAGR until 2031. Operators now aggregate several fronthaul streams into single 25 Gb/s and 100 Gb/s backbones, so they buy higher-capacity radios, optical amplifiers, and coherent pluggables. The 5G fronthaul and backhaul equipment market size for backhaul links is set to climb steeply as E-band radios become mainstream in metro rings. Fronthaul demand still rises, yet its wallet share lags because many small cells share hubs that reuse existing fiber. Nokia’s Infinera deal blends packet-optical switching with coherent optics, positioning the firm for a larger slice of both segments.
Backhaul portfolios also include software-defined routers that insert deterministic latency and slice awareness. Vendors emphasize deep quality of service, segment routing, and accurate Precision Time Protocol to service disaggregated RAN. On the fronthaul side, compact WDM and colorless-directionless-contentionless (CDC) architectures simplify adding 25 Gb/s lanes without truck rolls. Free-space optics from players such as Transcelestial offers a 10 Gb/s line rate for quick-win infill, although adoption is still niche.


By Type: Wireless systems speed deployment
Wireless solutions held 61.30% share of the 5G fronthaul and backhaul equipment market in 2025, thanks to their fast roll-out profile. Same-day activation beats months-long trench work for fiber, so urban programs in APAC and the US lean on microwave hops that flex between 4 Gb/s and 20 Gb/s. The 5G fronthaul and backhaul equipment market size for fixed fiber remains huge in absolute terms, particularly for inter-city trunks that require multi-terabit scale. Yet in suburban clusters, telecoms accept smaller capacity if deployment times improve.
Path diversity increases as carriers team fiber rings with 60 GHz V-band links that reroute during outages. Regulations in the 70/80/90 GHz bands now tolerate broader beam widths, trimming RF alignment cost. Free-space optics and hybrid RF/laser units expand the addressable space where fiber permits are stalled. Over the forecast horizon, microwave ASP erosion moderates because higher-frequency gear demands more advanced silicon and integrated antennas.
By Frequency Band: E-band surges while Sub-6 GHz anchors coverage
Sub-6 GHz remains the high-coverage workhorse, providing 47.60% revenue in 2025, largely tied to rural macro backhaul. In contrast, E-band is scaling fastest at a 19.55% CAGR on the strength of metro densification. Relaxed power limits and smaller antennas open new rooftop options, so multi-gigabit E-band replaces many fiber laterals. The 5G fronthaul and backhaul equipment market share for C-band microwave keeps a stable niche where rain fade is lower.
V-band at 60 GHz underpins short-haul outdoor mesh and indoor fixed wireless, while 24–40 GHz mmWave slots between for event venues and stadium zones. Semtech’s 50 Gb/s CDR devices and Ceragon’s planned E-band MIMO radios point to continual capacity leaps that stretch wireless competitiveness.
By End-user: Enterprise demand reshapes order books
Mobile network operators still dominate buying at 65.40%, yet private networks led by manufacturing, logistics, and healthcare are the clear growth engine. Enterprises value deterministic latency and direct SLA control, so they fund indoor small cells, edge compute, and campus backhaul loops. Standalone design lets them right-size capacity, often pairing fiber with short-haul mmWave to dodge campus trenching. The 5G fronthaul and backhaul equipment industry sees integrators offer “network-in-a-box” kits that combine radios, timing, and orchestration software for brownfield plants.
Public-safety agencies also invest, using dedicated spectrum and priority features. FirstNet’s USD 6.3 billion upgrade underscores government appetite for mission-critical 5G backhaul. Neutral-host towers then bridge carriers and enterprises, adding a third pillar of demand.
By Application: Fixed wireless access fills broadband gaps
Enhanced mobile broadband owned 53.20% of 2025 spend, yet FWA is rising fastest at 18.75% CAGR. Operators bundle outdoor CPE with indoor Wi-Fi 7 to hit 100 Mbps downlink, monetizing unused 5G capacity during off-peak hours. India targets 30 million 5G FWA users by 2027, while US regional carriers tap BEAD subsidies for rural installs. uRLLC and mMTC remain smaller today but carry high ASP hardware, particularly for edge-synced fronthaul.
Smart-city and connected-transport projects adopt hybrid LTE/5G slices with redundant backhaul. These sites rely on sub-6 GHz for reach, yet offload peak video to mmWave repeaters. Over time, demand for 1 millisecond latency moves more compute toward cell-site gateways, lifting sales of edge-ready 100 GbE switches.
Geography Analysis
Asia Pacific controlled 37.60% of global revenue in 2025 and posts the highest regional CAGR at 19.80%, driven by China’s multi-billion-dollar 5G-A roadmap and India’s accelerated private-network rollouts. Carriers in the region add 25 Gb/s fronthaul optics at scale, while local gear makers raise production to mitigate supply chain risk. Regulatory green-lights for n79 enterprise spectrum in Japan and expanded E-band allowances in South Korea further support volume.
North America retains a sizable slice through ongoing 5G buildouts and the FirstNet public-safety commitment. The BEAD program delivers USD 42.5 billion for rural broadband, unlocking new FWA backhaul orders. Vendors such as Ericsson now manufacture radios in Texas and antenna systems in Mexico, short-circuiting import delays.
Europe follows with cohesive Open RAN pilots across Germany, Spain, and the UK. Spring 6 procurement explicitly mandates multi-vendor support, so operators require versatile xHaul switching that bridges CPRI, eCPRI, and IP/MPLS. Government policy also prioritizes energy efficiency, pushing coherent pluggables that cut watts per gigabit.
The Middle East and Africa accelerate from a smaller base, fuelled by Vision 2030 programs in Saudi Arabia and fresh 5G licenses in Egypt. High-gain microwave suits the region’s vast rural terrain, while oil and gas verticals install private 5G rings for remote asset monitoring.
Latin America is emerging, with Brazil’s telecommunication fund injecting R$4.8 billion for coverage expansion. Claro’s recent multi-year deal with Nokia exemplifies national operators’ push to swap aging microwave with 10 Gb/s E-band. Currency fluctuation remains a hurdle, so vendors bundle financing packages to sustain order momentum.

Competitive Landscape
The 5G fronthaul and backhaul equipment market is moderately consolidated, with the top five suppliers holding an estimated 55–60% combined share. Nokia’s USD 2.3 billion Infinera takeover creates a packet-optical challenger positioned for roughly 20% optical share[2]Nokia Corporation, “Nokia Completes Acquisition of Infinera,” nokia.com. Zayo’s purchase of Crown Castle’s fiber arm for USD 4.25 billion broadens neutral aggregation capacity across 90,000 route miles.
Technology race centers on coherent optics, multi-band microwave, and slice-aware routers. Ciena’s WaveLogic 6 runs 1.6 Tb/s wavelengths, while Ericsson’s Router 6676 integrates IEEE 1588v2 for Open RAN timing. Start-ups such as Transcelestial scale laser-com backhaul that offers 10 Gb/s links in under two hours, attacking last-meter bottlenecks.
Strategic moves include:
1. Vendor-neutral xHaul partnerships tying radio, optical, and routing domains.
2. Factory localization programs in India, Mexico, and the US to hedge geopolitical risk.
3. Software feature roadmaps that expose network APIs for edge compute and private-network orchestration.
Patent filings grow around low-power amplification, spectrum-sharing algorithms, and AI-driven fault localization. Suppliers with full-stack portfolios and service integration teams are best placed to secure multi-year managed-xHaul contracts.
5G Fronthaul And Backhaul Equipment Industry Leaders
Samsung Electronics
Huawei Technologies
ZTE Corporation
Nokia Corporation
Telefonaktiebolaget LM Ericsson
- *Disclaimer: Major Players sorted in no particular order

Recent Industry Developments
- June 2025: Ericsson and Google Cloud launched “Ericsson On-Demand”, a SaaS 5G core platform that enables pay-per-use scaling.
- June 2025: U Mobile signed a USD 567 million, 10-year deal with Telekom Malaysia for nationwide 5G fiber backhaul.
- April 2025: Ericsson localised all passive antenna production in India in partnership with VVDN Technologies.
- February 2025: Airspan bought Corning’s in-building wireless and Jabil’s Open RAN radios to expand macro and indoor portfolio.


Research Methodology Framework and Report Scope
Market Definitions and Key Coverage
Our study defines the 5G fronthaul and backhaul equipment market as the revenues arising from hardware that transports 5G user and control traffic between radio units and centralized or core network nodes. This includes fiber, passive or active WDM, optical transport, microwave and millimeter-wave radios, and packet routers bundled with timing modules that meet eCPRI and time-sensitive networking specifications.
Scope exclusion: software orchestration tools and managed service fees that may accompany transport roll-outs are not counted.
Segmentation Overview
- By Equipment
- Fronthaul
- Fiber Direct Connection
- Passive WDM (CWDM/DWDM)
- Active WDM/OTN/SPN
- eCPRI/Ethernet Fronthaul
- Free-Space Optics
- Millimeter Wave
- Backhaul
- Microwave (Sub-6 GHz)
- E-band (70/80 GHz)
- V-band (60 GHz)
- Fiber Backhaul (IP-RAN/Ethernet)
- Passive Optical Network (PON)
- Optical Transport Network (OTN)
- WDM Backbone
- Free-Space Optics
- Satellite/HAPS
- Fronthaul
- By Type
- Fixed
- Wireless
- By Frequency Band
- Sub-6 GHz
- C-band (3-6 GHz)
- mmWave 24-40 GHz
- V-band 60 GHz
- E-band 70/80 GHz
- By End-user
- Mobile Network Operators
- Neutral Host/TowerCos
- Private Enterprise and Industrial
- Government and Public Safety
- ISP and Fixed-Wireless Providers
- By Application
- Enhanced Mobile Broadband (eMBB)
- Fixed Wireless Access (FWA)
- Massive Machine-Type Comms (mMTC)
- Ultra-Reliable Low-Latency Comms (uRLLC)
- Smart City Infrastructure
- Transportation and Mobility
- By Geography
- North America
- United States
- Canada
- South America
- Brazil
- Argentina
- Europe
- Germany
- United Kingdom
- France
- Russia
- Rest of Europe
- Asia-Pacific
- China
- Japan
- South Korea
- India
- Rest of Asia-Pacific
- Middle East
- Israel
- Saudi Arabia
- United Arab Emirates
- Turkey
- Rest of Middle East
- Africa
- South Africa
- Egypt
- Rest of Africa
- North America
Detailed Research Methodology and Data Validation
Primary Research
Mordor analysts interviewed mobile network planners across North America, Europe, and Asia Pacific, fiber wholesalers in Tier-2 cities, and microwave OEM product leads. These conversations tested our price curves, shared uptake expectations for Open RAN fronthaul, and highlighted regional variances in lease versus build strategies that secondary sources rarely spell out.
Desk Research
We began with public datasets from bodies such as the ITU, GSMA Intelligence, and national telecom regulators, which reveal spectrum releases, 5G coverage, and site counts. Trade associations like the Fiber Broadband Association and the Small Cell Forum supply annual summaries on route-mile builds and small-cell installs. Financial filings, investor decks, and tender notices helped us benchmark vendor shipments and average selling prices. Select paid resources, for instance, D&B Hoovers for company revenues and Dow Jones Factiva for deal flow, sharpened our understanding of procurement volumes. These sources are illustrative; many additional references were tapped for validation and clarification.
A second sweep of patents, export statistics, and peer-reviewed optical networking journals let us cross-check adoption of E-band links, coherent optics, and passive WDM shelves that dominate urban densification, giving us confidence in technology split assumptions.
Market-Sizing & Forecasting
A top-down build starts with 5G macro and small-cell site inventories, fiber route-mile additions, and microwave hop deployments, which are then valued using blended ASP trends. Supplier roll-ups and channel checks provide a bottom-up sense check before totals are finalized. Key variables include 5G population penetration, average capacity per site, E-band radio ASP erosion, fiber price per kilometer, telco transport capex share, and small-cell growth rates. Multivariate regression aligns these drivers with historic equipment revenues; scenario analysis adjusts for spectrum auction timing or capex pauses, ensuring forecasts remain practical.
Data Validation & Update Cycle
Outputs pass variance screening against import data, vendor earnings, and announced roll-outs. A senior analyst reviews anomalies, and figures are refreshed every twelve months, with interim updates triggered by events such as major spectrum awards or sanctions.
Why Mordor's 5G Fronthaul And Backhaul Equipment Baseline Stands Firm
Published market values often differ because studies apply distinct boundary lines, currency years, and refresh cadences. Our disciplined scope, which limits inclusion to hardware revenue and synchronizes currency at 2025 USD, reduces hidden inflation of totals often seen elsewhere.
Key gap drivers include whether passive fiber leasing is counted, how wireless backhaul ASP declines are modeled, and the cadence at which Open RAN penetration is refreshed. Some publishers fold service revenue into equipment, others assume aggressive price erosion, and a few still use 2023 exchange rates, all of which widen the spread.
Benchmark comparison
| Market Size | Anonymized source | Primary gap driver |
|---|---|---|
| USD 6.17 Bn | Mordor Intelligence | - |
| USD 8.38 Bn | Global Consultancy A | Bundles installation services with hardware revenue |
| USD 6.30 Bn (2024) | Industry Association B | Uses older base year and static ASPs |
| USD 7.44 Bn (2025) | Regional Consultancy C | Counts dark-fiber leases as equipment sales |
The comparison shows that when scope creep and pricing shortcuts are stripped out, Mordor's disciplined, annually refreshed model gives decision-makers a balanced, transparent baseline that traces directly back to verifiable network build indicators.


Key Questions Answered in the Report
What is the current value of the 5G fronthaul and backhaul equipment market?
The market stands at USD 7.29 billion in 2026 and is projected to exceed USD 16.83 billion by 2031.
Which region leads spending on 5G fronthaul and backhaul equipment?
Asia Pacific holds 37.60% of global revenue and shows the highest CAGR at 19.80%.
Why are wireless backhaul systems gaining share?
Wireless E-band and V-band links deploy faster than trenching fiber, suiting dense urban rollouts and cutting lease costs.
How does Open RAN influence transport equipment demand?
Disaggregation mandates multi-protocol, precise-timing xHaul, boosting sales of programmable optical and packet gear.
Which application is growing fastest within the market?
Fixed wireless access registers a 18.75% CAGR as operators target rural broadband with 5G capacity.
What strategic moves are vendors making to stay competitive?
They are acquiring optical specialists, localizing manufacturing, and adding software-defined orchestration to differentiate solutions.
Page last updated on:


