5G From Space Market Size and Share
Market Overview
| Study Period | 2019 - 2030 |
|---|---|
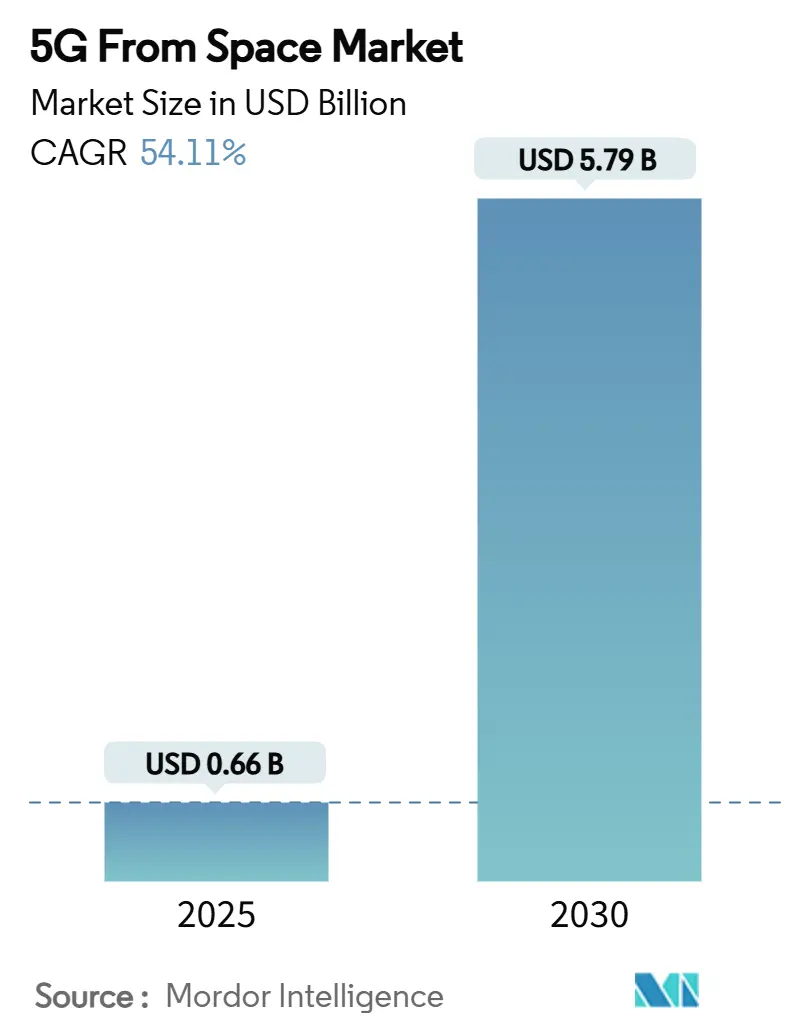
| Market Size (2025) | USD 0.66 Billion |
| Market Size (2030) | USD 5.79 Billion |
| Growth Rate (2025 - 2030) | 54.11% CAGR |
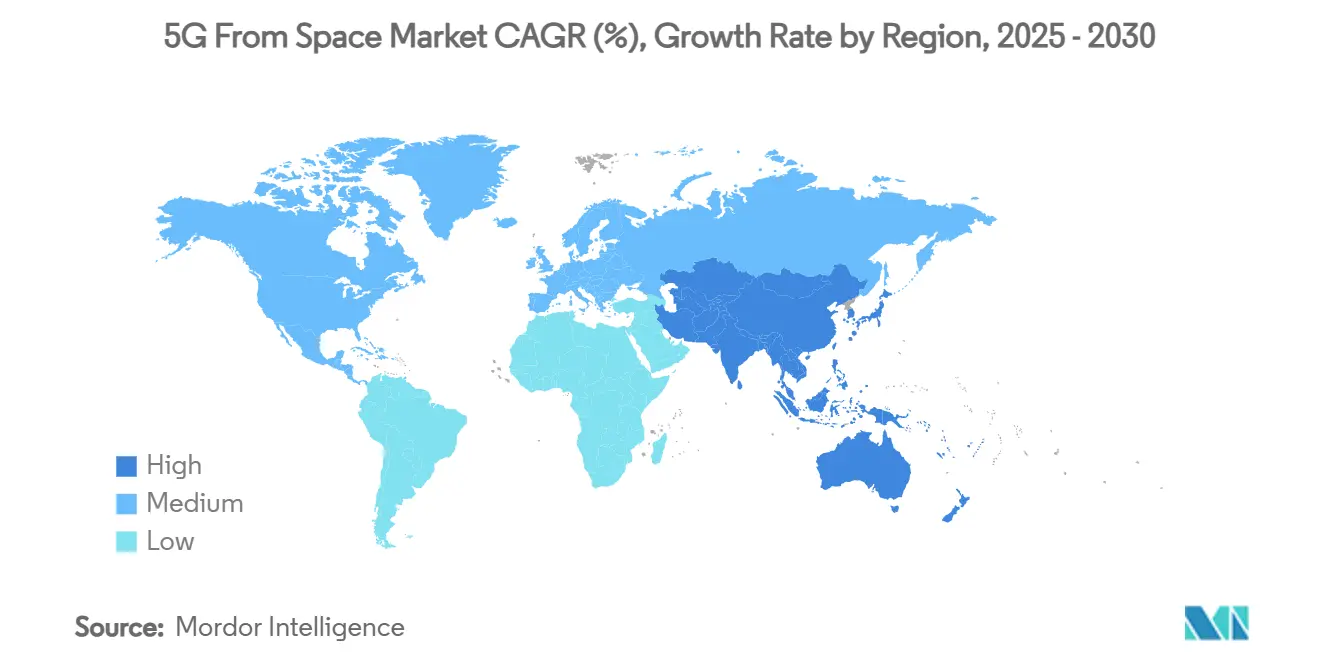
| Fastest Growing Market | Asia Pacific |
| Largest Market | North America |
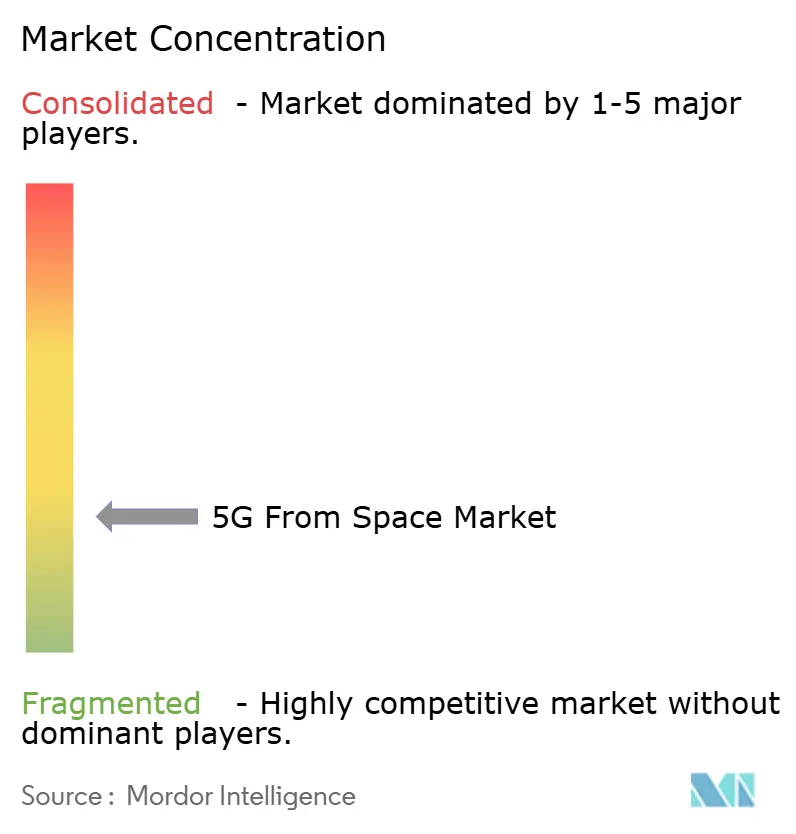
| Market Concentration | Low |
Major Players *Disclaimer: Major Players sorted in no particular order Image © Mordor Intelligence. Reuse requires attribution under CC BY 4.0. | |
5G From Space Market Analysis by Mordor Intelligence
The 5G from space market size stands at USD 0.66 billion in 2025 and is projected to reach USD 5.79 billion by 2030, reflecting a formidable 54.14% CAGR over the forecast period. Sustained momentum comes from satellite-terrestrial integration frameworks that allow mobile network operators to fill coverage gaps without escalating tower roll-outs, a regulatory shift led by the FCC’s “supplemental coverage from space” order. Operators also benefit from falling satellite manufacturing costs, improved rideshare economics, and expanding device ecosystems that now embed non-terrestrial network (NTN) chipsets. Enterprise and government users are adopting multi-orbit links for resilience against terrestrial outages. At the same time, spectrum liberalization in the United States and the United Kingdom accelerates the commercial deployment of multi-gigabit satellite backhaul. Competitive pressure has sharpened as incumbents such as SpaceX, SES-Intelsat, and Amazon race to scale constellations, driving down bandwidth pricing and expanding the addressable 5G from space market.
Key Report Takeaways
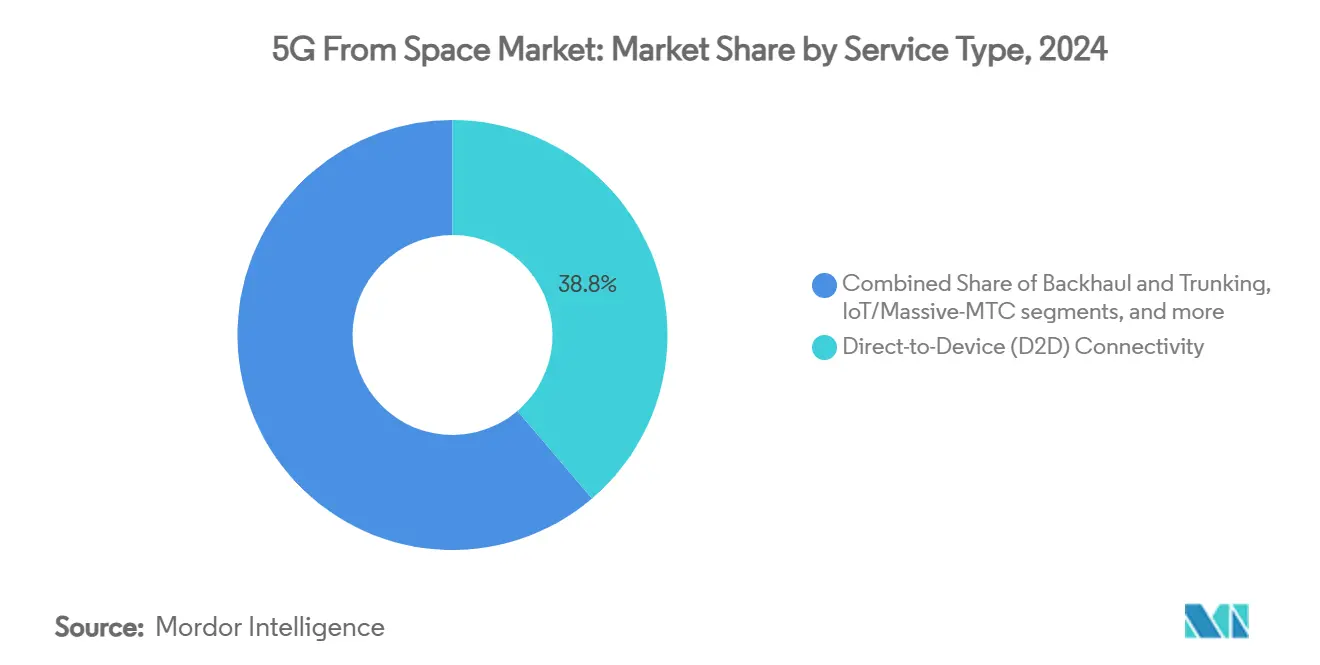
- By service type, direct-to-device (D2D) connectivity accounted for 38.76% of 5G from space market share in 2024, whereas IoT/massive-MTC is growing at a 59.22% CAGR through 2030.
- By orbit, low-earth orbit systems led with a 60.13% share in 2024, while medium-earth orbit solutions delivered the fastest 61.89% CAGR in 2030.
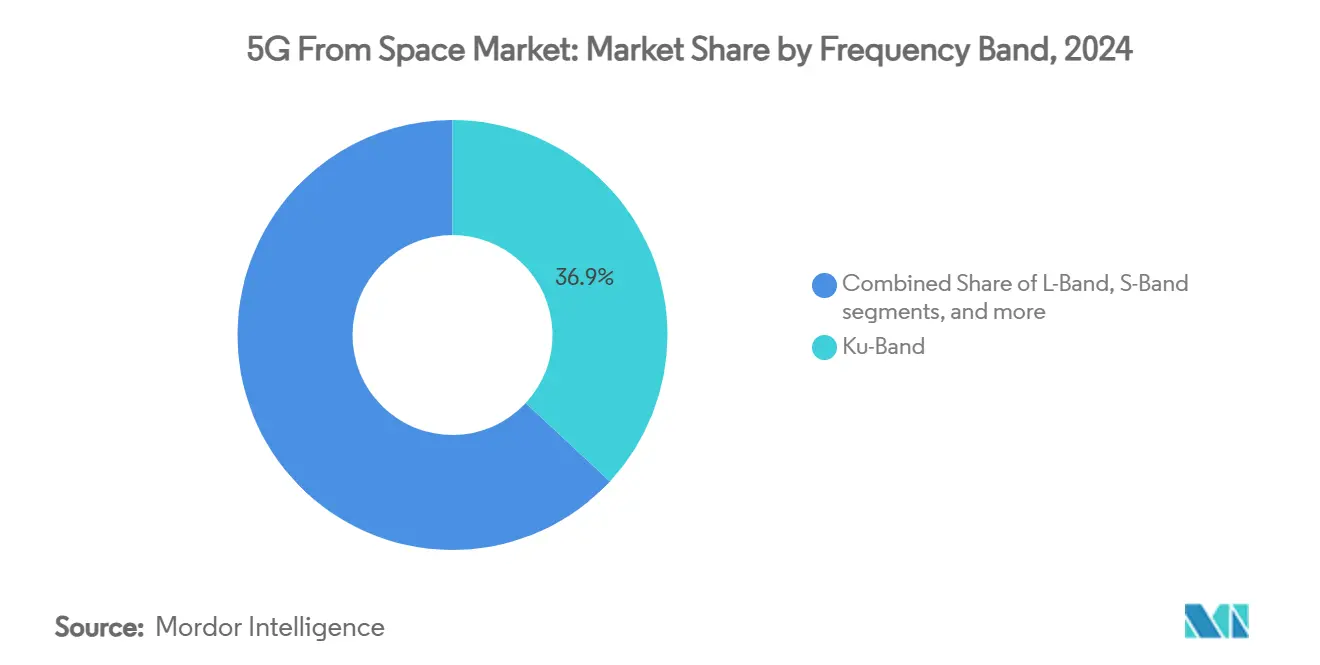
- By frequency band, Ku-Band captured 36.92% revenue share in 2024, while Ka-Band capacity is advancing at a 62.10% CAGR through 2030.
- By end user, consumer handsets made up 39.24% of the 5G from space market size in 2024, yet energy and mining connections are expanding at a 56.55% CAGR.
- By geography, North America held a 33.82% share in 2024, whereas the Asia-Pacific region is reaching a 58.10% CAGR due to pro-satellite policy reforms.
Global 5G From Space Market Trends and Insights
Drivers Impact Analysis*
| Driver | (~) % Impact on CAGR Forecast | Geographic Relevance | Impact Timeline |
|---|---|---|---|
| Integration of satellite and terrestrial networks to achieve seamless global coverage | +12.5% | North America and Europe initially, global later | Medium term (2-4 years) |
| Growing industry collaborations to extend broadband access in underserved regions | +8.7% | Asia-Pacific core; MEA and South America follow | Long term (≥4 years) |
| Increased spectrum access and sharing driving network expansion potential | +6.3% | United States, United Kingdom leadership | Short term (≤2 years) |
| Reduced costs of satellite production and launch improving market accessibility | +11.2% | Manufacturing hubs in US and Europe | Medium term (2-4 years) |
| Emergence of affordable consumer devices supporting satellite-based 5G services | +7.8% | North America and EU first, spreading to Asia-Pacific | Medium term (2-4 years) |
| Rising demand for resilient, redundant communication pathways in national infrastructure | +5.9% | Defense-focused economies | Long term (≥4 years) |
| Source: Mordor Intelligence | |||
Integration of Satellite and Terrestrial Networks to Achieve Seamless Global Coverage
Seamless roaming between space and ground networks has shifted satellite capacity from a niche back-up to an organic extension of terrestrial 5G from space market coverage. The FCC framework allows mobile licensees to lease spectrum to satellite operators, letting a handset hand over automatically from a terrestrial cell to a satellite beam without user intervention.[1]FCC, “Single Network Future: Supplemental Coverage from Space,” fcc.gov 3GPP Release 17 codifies this architecture, and the early partnership between T-Mobile and SpaceX demonstrates voice-capable satellites acting as “towers in orbit” that remove rural dead zones. Operators prefer this hybrid topology because latency-sensitive traffic remains local while delay-tolerant traffic exploits non-terrestrial paths, yielding optimal quality of service. As cross-border spectrum coordination matures, multi-orbit phones will default to the strongest link, effectively globalizing terrestrial 5G from space market reach.
Growing Industry Collaborations to Extend Broadband Access in Underserved Regions
Partnerships between satellite constellations and incumbent carriers shorten time-to-revenue by combining orbital assets with retail distribution and national licenses. Telstra’s agreement with OneWeb for mobile backhaul proved that stranded base stations could be lit economically across Australia’s interior. Omnispace and MTN replicated the model for pan-African IoT connectivity, knitting satellite footprint with MTN’s billing and customer care capabilities. Similar alliances in South America and Southeast Asia show that the 5G from space market often scales fastest when orbit-to-ground partnerships pool spectrum, landing rights, and retail channels. Collaboration also diffuses engineering risk because network slicing, authentication, and roaming procedures are standardized across partners, lowering capex per subscriber.
Increased Spectrum Access and Sharing Driving Network Expansion Potential
Spectrum liberalization, particularly the opening of the 17.3-17.8 GHz block and dynamic sharing rules, removes a historic bottleneck for high-throughput non-geostationary systems. Regulators now mandate “good-faith coordination” rather than exclusive licensing, allowing constellations to coexist through software-defined payloads that shift channels on demand. International Telecommunication Union updates effective in 2025 align national allocations and give operators certainty to plan multibillion-dollar fleets.[2]International Telecommunication Union, “2024 Radio Regulations Update,” itu.int Spectrum markets consequently price risk lower, attracting investors who previously feared bureaucratic delay.
Reduced Costs of Satellite Production and Launch Improving Market Accessibility
Reusable launch vehicles and serial satellite manufacturing have slashed per-kilogram launch costs, making large constellations economically viable. SpaceX’s rideshare program has flown more than 57% of Western smallsats, and its scale exerts downward pressure on competitors’ tariffs. Standardized buses, software-defined radios, and automated test beds let contract manufacturers like Plexus shorten the design-to-dock timeline by 40%. Cheaper access encourages niche entrants—agriculture, logistics, maritime—to commit to dedicated 5G from space market payloads that would have been uneconomic five years ago.
Restraints Impact Analysis*
| Restraint | (~) % Impact on CAGR Forecast | Geographic Relevance | Impact Timeline |
|---|---|---|---|
| High and unpredictable costs associated with launch and space insurance | -8.3% | Global; acute for emerging-market operators | Short term (≤2 years) |
| Delays in regulatory approvals for direct-to-device communication services | -6.7% | Developing regions | Medium term (2-4 years) |
| Risk of signal interference with legacy satellite communication systems | -4.2% | Congested orbital shells | Long term (≥4 years) |
| Growing compliance burden related to orbital debris and space traffic regulations | -5.1% | Space-faring nations enforcing strict disposal rules | Medium term (2-4 years) |
| Source: Mordor Intelligence | |||
High and Unpredictable Costs Associated with Launch and Space Insurance
Despite average price declines, premiums rocket, and bespoke insurance coverage remains volatile. After several high-profile satellite anomalies, underwriters still load 10-15% surcharges onto complex missions. Small operators must escrow larger contingency funds, slowing constellation roll-outs and dampening early-stage investment appetite. Market consolidation among launch providers concentrates schedule risk; a single Falcon 9 bottleneck can ripple across dozens of payload manifests, delaying service revenue and compressing the 5G from space market growth window.
Delays in Regulatory Approvals for Direct-to-Device Communication Services
Although the FCC provides a domestic template, many jurisdictions still lack clear NTN frameworks, forcing satellite operators and carriers into bilateral coordination that extends licence cycles beyond 24 months. Device makers then face dual certification across terrestrial and satellite domains, complicating product roadmaps. These delays create first-mover advantages for operators with deep regulatory teams, yet slow the overall pace at which the 5G from space market reaches its universal coverage promise.
*Our forecasts treat driver/restraint impacts as directional, not additive. The impact forecasts reflect baseline growth, mix effects, and variable interactions.
Segment Analysis
By Service Type: Direct-to-Device Dominates While IoT Accelerates
Direct-to-Device services contributed the largest 38.76% slice of the 5G from space market size in 2024, reflecting consumer demand for emergency messaging and rural voice coverage. The segment captures pent-up demand from operators that struggled to monetize rural towers, and revenue per user often exceeds terrestrial averages because customers value connectivity as a safety feature. Consumer awareness climbed sharply after Apple activated satellite SOS, prompting other OEMs to follow suit. Operator economics benefit from incremental, rather than replacement, revenue: a terrestrial subscription simply appends a satellite surcharge, minimizing churn risk. Marketing campaigns emphasize life-saving scenarios, building brand stickiness that enlarges the addressable 5G from space market volume.
IoT/Massive-MTC represents the fastest-growing slice at a 59.22% CAGR, buoyed by standardized NB-IoT waveforms that roam seamlessly between ground and orbit. Logistics companies retrofit asset trackers to low-cost satellite modules that require only quarterly burst data, driving ultra-low-ARPU but high-margin traffic due to minimal payload demands. Agriculture uses yield sensors and autonomous tractors, tapping non-terrestrial links once fields extend beyond cellular fringe. Governments deploy NTN-IoT for wildfire detection and border monitoring, locking in long-term contracts. Together, these patterns ensure the service mix of the 5G from space market widens beyond direct-to-consumer towards diversified machine connectivity.


By Orbit: LEO Scale Meets MEO Efficiency
Low-Earth Orbit (LEO) fleets secured 60.13% of the 5G from space market share in 2024 as first movers like Starlink lofted thousands of satellites to achieve global blanket coverage. The architecture offers low latency under 50 ms, accommodating real-time gaming and cloud applications that cannot tolerate geostationary orbit (GEO) delay. Operators can also de-orbit failed spacecraft quickly, limiting debris obligations. Yet LEO capital intensity remains high because extensive fleets invite replenishment cycles every five years, and gateway proliferation increases land-use costs.
Medium-Earth Orbit (MEO) is racing at a 61.89% CAGR, capturing operators weighing cost per gigabit rather than absolute latency. SES’s O3b mPOWER serves enterprise VPNs with just 11 satellites, lowering fleet-wide opex dramatically.[3]Advanced Television, “SES Expects 30% Growth from O3b mPOWER Fleet,” advanced-television.com MEO footprints cover regional seas and deserts with fewer handovers, easing the complexity of terminal-tracking. Hybrid LEO-MEO handsets will appear inside the evaluation window, letting users prioritize low-latency sessions on LEO while defaulting bulk downloads to high-capacity MEO lanes. This orbit diversification safeguards uptime and brings stable cash flows, reinforcing the resilience narrative within the 5G from space market.
By Frequency Band: Ku Holds Ground, Ka Propels Growth
Ku-Band retained 36.92% revenue share in 2024, including legacy TV, maritime, and government networks that continue to value mature ground-segment ecosystems. The band’s rain-fade resilience suits equatorial nodes, and antenna designs are well understood, lowering installation friction for first-time users. Many upcoming direct-to-device payloads still reserve Ku for control beacons, ensuring backward compatibility throughout the 5G from space industry.
Ka-Band is scaling fastest at a 62.10% CAGR because it supports multi-gigabit throughput essential for dense urban backhaul.[4]World Teleport Association, “Propagation Impacts on Ka-Band Terminals,” worldteleport.org Software-defined payloads carve Ka channels dynamically, adapting link budgets in heavy rain through adaptive coding. Regulatory windows are more expansive, enabling agile deployments unencumbered by congested Ku filings. Antenna innovators now ship electronically steered arrays that auto-switch between Ku and Ka, letting operators optimize spectrum utilization hour-by-hour. This frequency agility underpins capacity planning as the 5G from space market transitions from experimental pilots to mass-market roll-outs.
By End User: Consumer Handsets Lead, Industrial Sectors Surge
Consumer handsets controlled 39.24% of the 5G from space market size in 2024 as smartphone vendors bundled emergency SOS, messaging, and map update services into premium models. Early adopters in rural North America and Australia generated compelling testimonials that spurred wider uptake. Carriers cross-sell satellite bundles to urban subscribers who travel into wilderness areas for recreation, broadening penetration beyond fixed-remote communities.
As operators modernize remote asset monitoring with direct satellite sensor links, energy and mining customers will post the highest 56.55% CAGR through 2030. Predictive maintenance platforms ingest continuous vibration and temperature feeds from offshore rigs, reducing unplanned downtime and saving millions of USD annually. The ability to embed small terminal chips inside valves, pumps, and haul trucks extends digital twins across sprawling operations. Sector-specific throughput guarantees and service-level agreements monetize premium uptime, intensifying revenue diversity within the 5G from space market.
Geography Analysis
North America produced one-third of 2024 revenue and continues outspending other regions on direct-to-device pilots, rural broadband subsidies, and military turnkey contracts. Cross-border spectrum coordination across Canada, Mexico, and the United States accelerates roaming use cases, giving the 5G from space market an integrated continental footprint.
Despite a smaller 2024 revenue, Asia-Pacific is poised to eclipse North America in the mid-term because population density and terrain complexity make universal fiber unviable. Governments see satellite 5G as a lever for financial inclusion; consequently, subsidy programs target school connectivity and agricultural IoT, creating multi-year commitments that underpin predictable cash flows for operators.
Europe employs a risk-balanced model: universal-service mandates fund non-terrestrial backhaul where fiber builds face environmental objections. Early 6G testbeds explore integrated sensing and communications, setting the stage for multi-orbit integration by 2028. Africa and South America rely on satellite to bypass last-mile bottlenecks; partnerships with MTN and Claro bundle satellite IoT in prepaid plans, evidence that the 5G from space market can penetrate low-ARPU demographics when capacity supply meets price tolerance.

Competitive Landscape
The 5G from space market is fragmented. SpaceX anchors the market with more than 6,000 active Starlink craft and vertical control of launch and manufacturing. Its scale drives marginal-cost pricing that competitors must match, reinforcing high entry barriers. SES’s USD 3.1 billion acquisition of Intelsat creates a GEO-MEO powerhouse capable of bundling universal coverage with guaranteed throughput, challenging LEO-only players. Amazon’s Project Kuiper leverages AWS cloud integration for enterprise workloads, promising frictionless orchestration of orbital and terrestrial compute.
Challenger fleets such as AST SpaceMobile and Lynk Global focus narrowly on direct-to-smartphone traffic, claiming early patents around high-gain unfoldable antennas. Their open-RAN strategy appeals to carriers seeking vendor diversity. Vertical partnership models also proliferate: Viasat collaborates with handset vendors to demonstrate direct-to-handset links at national telecom shows, reinforcing brand relevance amid rising LEO hype.
Regulatory compliance forms the next battleground. The FCC mandates five-year post-mission disposal and imposes reporting on collision-avoidance maneuvers. Operators able to leverage in-house propulsion and autonomous navigation can meet these requirements at lower cost, freeing capital for constellation expansion. Investors, therefore, screen prospective entrants for technical differentiation and regulatory maturity before funding, concentrating resources within the established 5G from space market leaders.
5G From Space Industry Leaders
OneWeb
Lynk Global, Inc.
SES S.A.
AST & Science, LLC
Space Exploration Technologies Corp.
- *Disclaimer: Major Players sorted in no particular order

Recent Industry Developments
- July 2025: ALL.SPACE received a EUR 3.42 million (USD 4 million) contract from the European Space Agency (ESA) for its multi-orbit, multi-link SATCOM platforms under ESA's Advanced Research in Telecommunications Systems (ARTES) program. The contract, part of the '5G/6G and Sustainable Connectivity' strategic initiative within ESA's Connectivity and Secure Communications directorate, supports the development of advanced satellite communication products and services.
- November 2024: Forsway secured a EUR 2.3 million (USD 2.69 million) funding contract from the European Space Agency (ESA), with support from the Swedish National Space Agency (SNSA). The project, Xtend 5G, aims to develop a 5G NTN (Non-Terrestrial Network) hybrid satellite connectivity system that integrates satellite and terrestrial networks to provide continuous connectivity across network environments.


Global 5G From Space Market Report Scope
| Direct-to-Device (D2D) Connectivity |
| Backhaul and Trunking |
| IoT / Massive-MTC |
| Government and Defense Secure Links |
| Low-Earth Orbit (LEO) |
| Medium-Earth Orbit (MEO) |
| Geostationary Orbit (GEO) |
| L-Band |
| S-Band |
| C-Band |
| Ku-Band |
| Ka-Band |
| Q/V-Band |
| Consumer Handset |
| Maritime |
| Aviation |
| Energy and Mining |
| Government and Public Safety |
| North America | United States | |
| Canada | ||
| Mexico | ||
| Europe | United Kingdom | |
| France | ||
| Germany | ||
| Italy | ||
| Rest of Europe | ||
| Asia-Pacific | China | |
| India | ||
| Japan | ||
| South Korea | ||
| Australia | ||
| Rest of Asia-Pacific | ||
| South America | Brazil | |
| Rest of South America | ||
| Middle East and Africa | Middle East | United Arab Emirates |
| Saudi Arabia | ||
| Rest of Middle East | ||
| Africa | South Africa | |
| Rest of Africa | ||
| By Service Type | Direct-to-Device (D2D) Connectivity | ||
| Backhaul and Trunking | |||
| IoT / Massive-MTC | |||
| Government and Defense Secure Links | |||
| By Orbit | Low-Earth Orbit (LEO) | ||
| Medium-Earth Orbit (MEO) | |||
| Geostationary Orbit (GEO) | |||
| By Frequency Band | L-Band | ||
| S-Band | |||
| C-Band | |||
| Ku-Band | |||
| Ka-Band | |||
| Q/V-Band | |||
| By End User | Consumer Handset | ||
| Maritime | |||
| Aviation | |||
| Energy and Mining | |||
| Government and Public Safety | |||
| By Geography | North America | United States | |
| Canada | |||
| Mexico | |||
| Europe | United Kingdom | ||
| France | |||
| Germany | |||
| Italy | |||
| Rest of Europe | |||
| Asia-Pacific | China | ||
| India | |||
| Japan | |||
| South Korea | |||
| Australia | |||
| Rest of Asia-Pacific | |||
| South America | Brazil | ||
| Rest of South America | |||
| Middle East and Africa | Middle East | United Arab Emirates | |
| Saudi Arabia | |||
| Rest of Middle East | |||
| Africa | South Africa | ||
| Rest of Africa | |||


Key Questions Answered in the Report
What is the projected size of the 5G From Space market by 2030?
The 5G from space market size is forecasted to reach USD 5.79 billion in 2030 at a 54.14% CAGR.
Which service segment will grow fastest through 2030?
IoT/Massive-MTC leads with a 59.22% CAGR as industrial sectors adopt standards-based satellite IoT links.
Why is Asia-Pacific expected to post the highest regional growth?
Regulatory approvals in India and South Korea combined with challenging geography drive a 58.10% CAGR in the region.
How do LEO and MEO architectures differ in commercial appeal?
LEO offers low latency ideal for consumer apps, while MEO provides wider footprints and lower fleet opex, attracting enterprise backhaul clients.
What factors most constrain rapid deployment of satellite-to-device services?
High launch-insurance costs and protracted national licensing processes remain the chief barriers, shaving up to 8.3% off the global CAGR forecast.
Which frequency band is poised for the strongest expansion?
Ka-Band is projected to lead capacity growth with a 62.10% CAGR as operators exploit its wider channels for multi-gigabit throughput.
Page last updated on:


