3D Printing For Prototyping Market Size and Share
Market Overview
| Study Period | 2020 - 2031 |
|---|---|
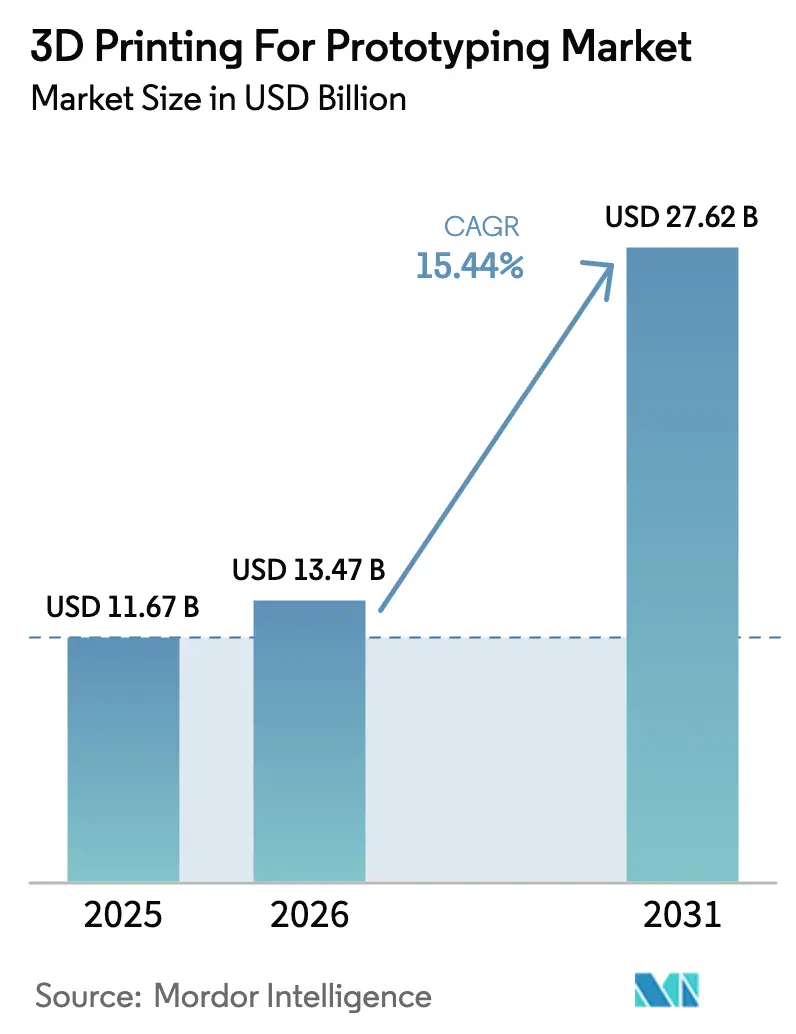
| Market Size (2026) | USD 13.47 Billion |
| Market Size (2031) | USD 27.62 Billion |
| Growth Rate (2026 - 2031) | 15.44% CAGR |
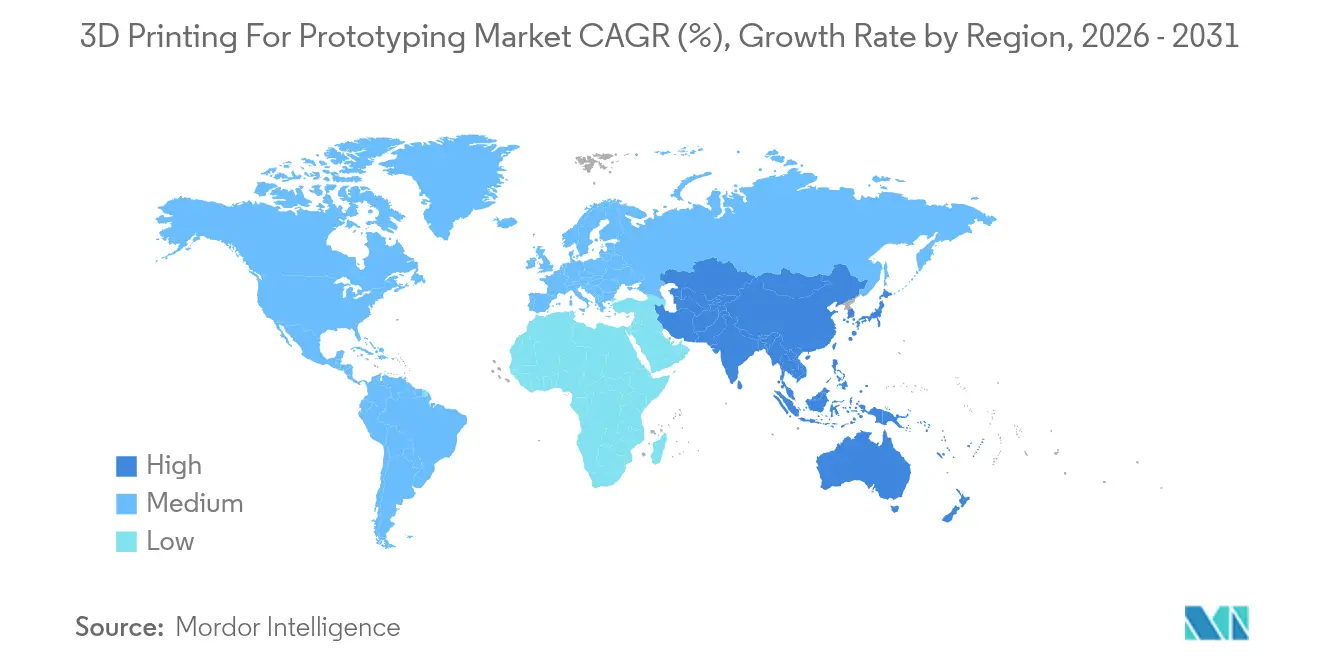
| Fastest Growing Market | Asia Pacific |
| Largest Market | North America |
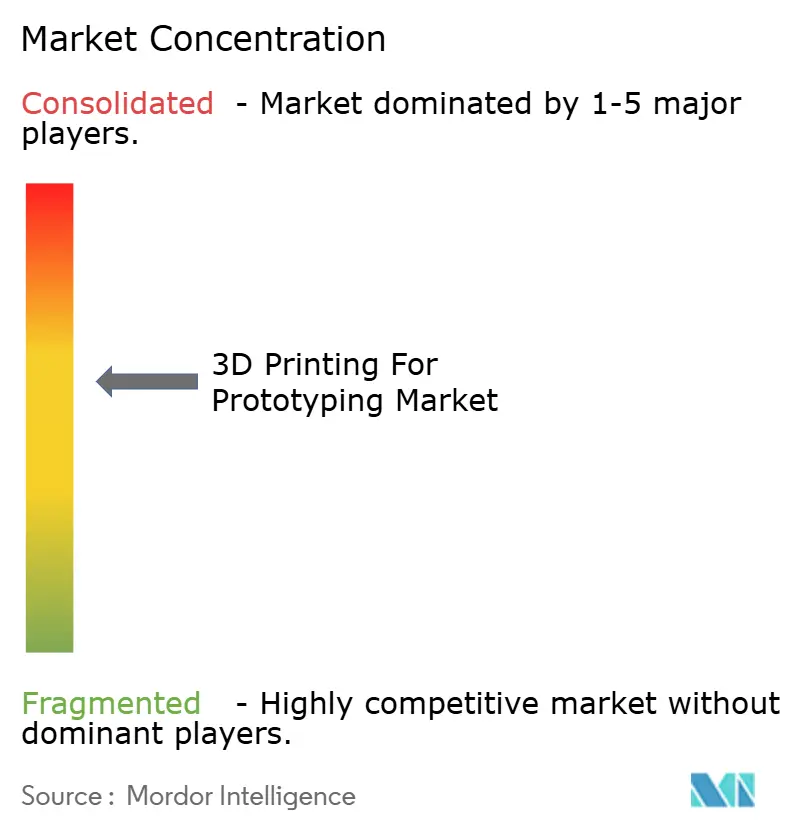
| Market Concentration | Medium |
Major Players *Disclaimer: Major Players sorted in no particular order Image © Mordor Intelligence. Reuse requires attribution under CC BY 4.0. | |
3D Printing For Prototyping Market Analysis by Mordor Intelligence
3D printing for prototyping market size in 2026 is estimated at USD 13.47 billion, growing from 2025 value of USD 11.67 billion with 2031 projections showing USD 27.62 billion, growing at 15.44% CAGR over 2026-2031. Momentum came from advances in generative-AI-driven design, falling per-part polymer costs, and pay-per-print platforms that lowered entry barriers for small design teams. Established aerospace, automotive, and healthcare users intensified demand for high-precision functional prototypes, while corporate sustainability targets steered material selection toward bio-based resins. Industry consolidation accelerated as hardware vendors paired with software specialists to deliver workflow-centric solutions that compress design-validation loops. Regional growth patterns showed North America retaining leadership through upstream software strengths and defense programs, whereas Asia-Pacific led incremental volume growth due to resurgent industrialization and targeted government incentives.
Key Report Takeaways
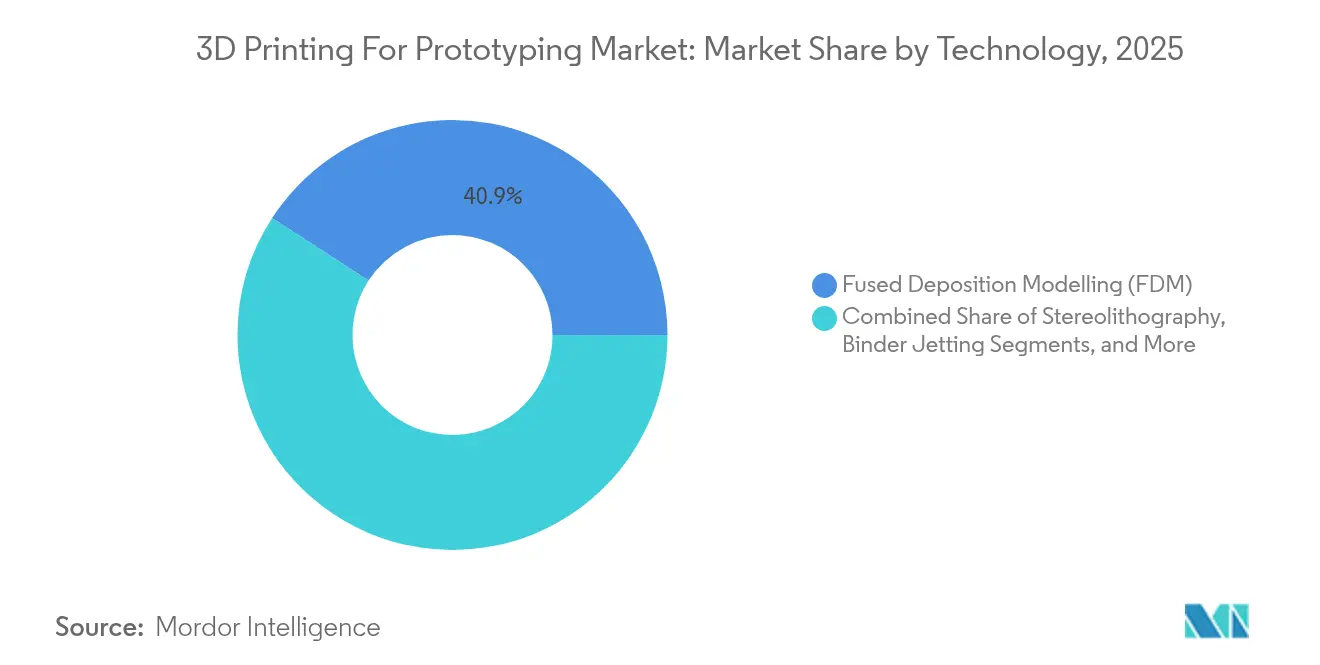
- By technology, fused deposition modelling led with 40.85% of 3D printing for prototyping market share in 2025; binder jetting is forecast to grow at an 17.74% CAGR to 2031.
- By material type, polymer accounted for 63.05% of the 3D printing for prototyping market size in 2025, while metal materials are projected to advance at 16.78% CAGR between 2026-2031.
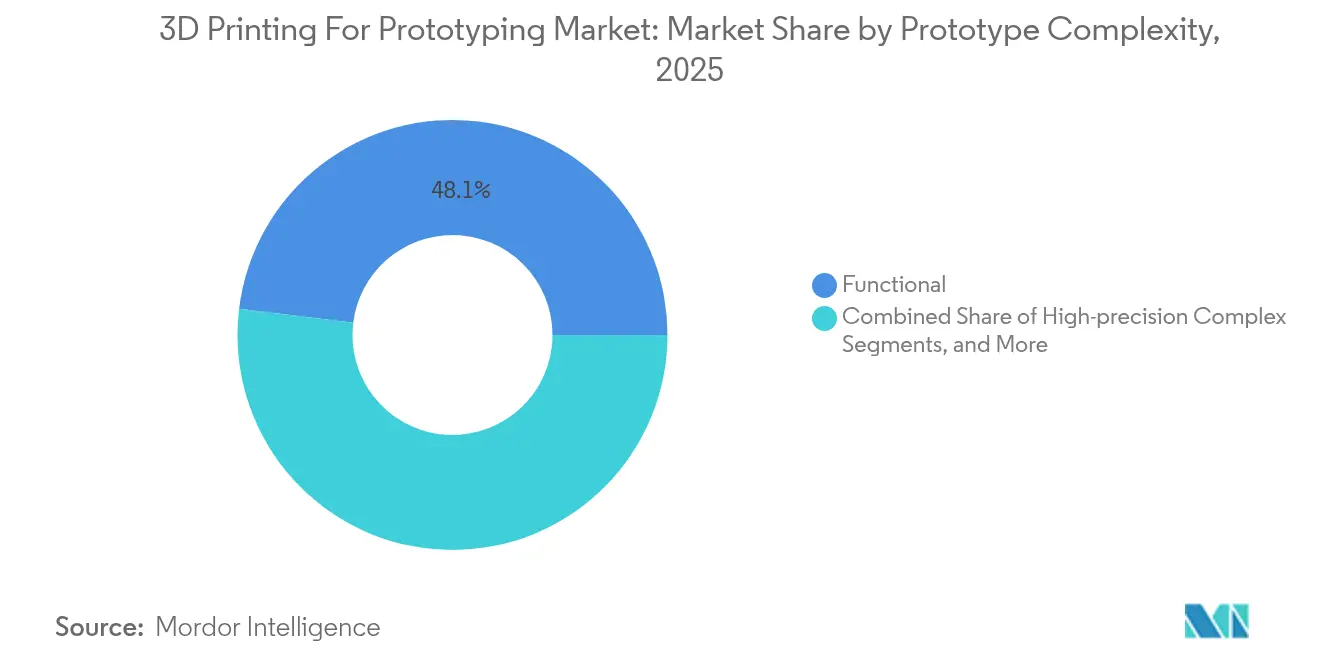
- By prototype complexity, functional prototypes captured 48.05% share of the 3D printing for prototyping market size in 2025; high-precision complex prototypes are rising at 24.73% CAGR through 2031.
- By end-user industry, automotive held 30.92% share of the 3D printing for prototyping market size in 2025, while healthcare records the highest projected CAGR at 19.76% to 2031.
- By geography, North America controlled 35.05% revenue share in 2025, whereas Asia-Pacific is set to record 17.32% CAGR between 2026-2031.
Note: Market size and forecast figures in this report are generated using Mordor Intelligence’s proprietary estimation framework, updated with the latest available data and insights as of 2026.
Global 3D Printing For Prototyping Market Trends and Insights
Drivers Impact Analysis*
| Driver | (~) % Impact on CAGR Forecast | Geographic Relevance | Impact Timeline |
|---|---|---|---|
| Rise in on-demand manufacturing services | +2.8% | Global, strongest in North America and APAC | Medium term (2-4 years) |
| Declining per-part cost for polymer prototyping | +2.1% | Global, concentrated in high-volume markets | Short term (≤ 2 years) |
| Corporate sustainability commitments (bio-based resins) | +1.4% | Europe and North America leading, APAC following | Long term (≥ 4 years) |
| Emerging pay-per-print platforms (micro-factories) | +1.9% | Urban centres globally, early adoption in developed markets | Medium term (2-4 years) |
| Government incentives for resilient supply chains | +2.2% | North America, Europe, Japan, India | Medium term (2-4 years) |
| Generative-AI-driven design optimisation | +3.1% | Global, concentrated in tech-advanced regions | Long term (≥ 4 years) |
| Source: Mordor Intelligence | |||
Rise in on-demand manufacturing services
On-demand networks transformed prototype economics by removing minimum order constraints and shrinking logistics lead times. Haddy opened micro-factories in Florida in 2025, enabling same-day part delivery for nearby automotive suppliers. Distributed production allowed small firms to trial complex designs without capital risks, while large OEMs leveraged digital inventories to shore up supply-chain resilience amid geopolitical disruptions. This driver proved pivotal for urban electronics hubs and regional aerospace clusters eager to iterate quickly yet keep IP under local control.
Declining per-part cost for polymer prototyping
Material advances pushed bio-based Nylon PA11 toward cost parity with petroleum equivalents in 2024, cutting carbon footprints by 49% in Weerg’s optimized powder operations. Simultaneously, powder reuse rates above 90% trimmed scrap and trimmed energy bills, making large-batch prototype runs financially viable for consumer goods. Lower unit costs blurred the boundary between prototyping and short-run production, particularly for customized packaging, footwear midsoles, and smart-device housings.
Corporate sustainability commitments (bio-based resins)
Environmental scorecards shaped material roadmaps as Arkema’s bio-based photopolymers debuted at Formnext 2024 for aerospace cabin parts and interior trims. Companies used prototyping phases to validate recyclability and life cycle impacts before scaling production. Project Nexus demonstrated bioreactor components printed with algae-derived resins, showing how sustainability credentials unlocked investor interest in early-stage biotech ventures.
Generative-AI-driven design optimization
AI reduced trial-and-error loops as Desktop Metal’s Live Parts slashed aerospace fuel-nozzle weight by 25% through automated lattice generation. 1000 Kelvin’s AMAIZE software predicted distortion and corrected toolpaths on the fly, achieving first-attempt-right metal prints and saving expensive titanium powder. AI’s convergence with in-situ monitoring advanced reliability for mission-critical prototypes in aviation and implantable medical devices.
Restraints Impact Analysis*
| Restraint | (~) % Impact on CAGR Forecast | Geographic Relevance | Impact Timeline |
|---|---|---|---|
| Capital-intensive metal systems | -1.8% | Global, most acute in emerging markets | Short term (≤ 2 years) |
| Qualification and certification bottlenecks | -2.1% | Aerospace and healthcare sectors globally | Medium term (2-4 years) |
| IP leakage concerns on cloud printing networks | -0.9% | Global, heightened in technology-sensitive industries | Long term (≥ 4 years) |
| Volatility in industrial metal powder supply | -1.4% | Global, concentrated in metal AM applications | Short term (≤ 2 years) |
| Source: Mordor Intelligence | |||
Capital-intensive metal systems
Acquisition costs for industrial metal printers ranged from USD 500,000 to USD 2 million, excluding inert-gas handling and post-processing cells AFS. Emerging-market SMEs struggled to secure financing, delaying adoption even where aerospace demand existed. Venture-backed capital pivoted toward software-driven service models in 2024, leaving hardware start-ups with funding gaps.
Qualification and certification bottlenecks
Regulatory test cycles under ASTM F3001 and FDA device pathways extended prototype-to-production handoffs by months. 3D Systems spent multiple years validating PEEK cranial implants before winning clearance in January 2025. Varied standards across technologies forced manufacturers to budget parallel test plans, slowing aerospace cabin component programs and cardiology stent rollouts.
*Our forecasts treat driver/restraint impacts as directional, not additive. The impact forecasts reflect baseline growth, mix effects, and variable interactions.
Segment Analysis
By Technology: FDM Dominance Faces Binder Jetting Disruption
FDM held 40.85% 3D printing for prototyping market share in 2025, favoured for affordable desktop units and a wide polymer palette. Binder jetting, though smaller, posted an 17.74% CAGR as EASYMFG’s M200Eco and M400Plus systems broadened access to support-free metal part creation. SLA and DLP preserved strongholds in jewellery and dental prototypes requiring sub-50 micron surface finishes. SLS sustained demand for functional nylon housings that withstand under-hood temperatures. Niche processes such as electrochemical additive manufacturing surfaced in semiconductor cooling prototypes, indicating continuing diversification rather than convergence on a single platform. Technology choice increasingly hinged on required mechanical fidelity and downstream certification, not merely on print speed or part cost. Consequently, equipment vendors competed on closed-loop process control, automated depowdering, and software-defined parameter libraries that guarantee reproducibility across global service bureaus.


By Material Type: Metal Surge Challenges Polymer Hegemony
Polymer dominated 63.05% of the 3D printing for prototyping market size in 2025, yet metal volumes expanded at 16.78% CAGR as aerospace primes standardized titanium alloy test articles. IperionX’s HAMR route lowered titanium powder oxygen levels and carbon footprints, alleviating supply-chain worries for defense customers. Ceramics attracted turbine makers seeking lightweight, heat-resistant core molds. Composite blends introduced carbon-fibre-reinforced polymers for motorsport brackets that require stiffness without metal weight. Material developers emphasized cradle-to-grave traceability, employing blockchain tagging and spectroscopy-based powder recycling to satisfy ESG auditors.
By Prototype Complexity: High-Precision Complex Prototypes Lead Growth
Functional prototypes retained the largest slice with 48.05% share, yet high-precision complex builds grew 24.73% annually, driven by EV battery tray validation and orthopaedic implant fit models. AI-assisted warpage prediction enabled near-net-shape accuracy for thin-walled aerospace ducts, reducing costly re-machining. Visual form-fit mock-ups, once synonymous with 3D printing, witnessed slower uptake as VR visualization displaced some needs. Nevertheless, consumer electronics firms continued to exploit colour-accurate PLA prints for focus-group feedback ahead of injection-mold builds. The demand shift underscored a willingness to pay premiums for prototypes that replicate production behaviour, shortening overall design sprints.
By End-User Industry: Healthcare Acceleration Outpaces Automotive Stability
Automotive maintained 30.92% 3D printing for prototyping market share in 2025, owing to jigs, fixtures, and engine-bay fluid routing test parts for platforms transitioning to EV drivetrains. Healthcare surged at 19.76% CAGR as personalized implants and surgical guides became mainstream following 3D Systems’ FDA-cleared PEEK cranial plates. Aerospace leveraged state-funded qualification programs to localize turbine blade trials, while consumer goods brands accelerated wearable tech design loops with multi-material elastomer prototypes. Education and research institutes remained fertile testbeds for novel algorithms and bio-inks, supported by ecosystem collaborations such as Make48’s 2025 school outreach.
Geography Analysis
North America commanded 35.05% 3D printing for prototyping market size in 2025, sustained by deep aerospace supply chains and defense-backed grants like the USD 33 million Department of Energy smart manufacturing program. Software prowess around Boston and Silicon Valley catalysed AI-driven design ecosystems, while Canada’s automotive corridor in Ontario integrated polymer printing lines into die-casting tool rooms. Mexico’s maquiladora clusters adopted FDM to cut fixture lead times but grew more slowly due to limited local material suppliers.
Asia-Pacific posted the fastest 17.32% CAGR, propelled by China’s industrial policies and rising domestic metal-printer installations forecast by JLC3DP. Japan’s USD 2.3 billion reshoring incentives under the “China Plus One” agenda stimulated local aerospace bracket pilots. India advanced through the iCET technology partnership that unlocked co-development funding in defense avionics prototypes. Southeast Asian electronics hubs in Malaysia and Singapore invested in micro-factory fleets to service wearables brands.
Europe demonstrated steady demand, buoyed by circular-economy directives that valued additive manufacturing’s waste efficiency. Germany’s automotive giants scaled binder-jetting pilot lines, and France’s space agencies validated photopolymer antennas for cubesats. South America and the Middle East witnessed nascent adoption; Brazilian oil-&-gas operators experimented with metal corrosion coupons, while UAE aerospace parks attracted service bureaus using binder jetting for turbine casing mock-ups. Africa’s rollout remained sporadic, hindered by logistics costs for import powders, yet research centres in South Africa trialled recycled-metal filament.

Competitive Landscape
The market stayed moderately fragmented in 2025, with Stratasys, 3D Systems, and Formlabs anchoring polymer and resin equipment while newcomers captured niche metal and software layers. Nano Dimension’s takeover of Desktop Metal illustrated a pivot toward vertically integrated stacks combining electronics printing and binder-jetting know-how. Stratasys invested in GrabCAD Print updates to auto-generate build reports that satisfy aerospace documentation.[3]Stratasys Investor Relations, “2025 SEC Filing,” stratasys.com voxeljet’s acquisition by Anzu Partners in March 2025 targeted scale-up capital to commercialize large-format sand-binder systems for foundry cores. EASYMFG, ADDIMETAL, and 6K Additive gained visibility through product launches and funding that addressed powder recycling and process automation. Customer preference tilted toward vendors able to supply printers, materials, monitoring software, and regulatory data packs under a single contract, driving joint ventures between automotive OEMs and printer makers to co-locate lines inside assembly plants.
White-space activity centered on AI-enabled monitoring start-ups like Amsight, which integrated thermal cameras and machine-learning defect prediction into third-party printers. Service bureaus are differentiated by offering end-to-end workflow certifications for the ISO 13485 and AS9100 sectors. Competitive intensity thus revolved around compliance speed, digital thread depth, and supply-chain sustainability metrics rather than headline print speed or build-volume specifications.
3D Printing For Prototyping Industry Leaders
Stratasys, Ltd.
3D Systems Corporation
Protolabs Inc.
Materialise NV
EOS GmbH
- *Disclaimer: Major Players sorted in no particular order

Recent Industry Developments
- March 2025: Anzu Partners completed the acquisition of voxeljet AG, investing EUR 20 million to scale industrial-size printers and closed-loop sand recycling.
- February 2025: EASYMFG unveiled M200Eco and M400Plus binder-jetting systems with automated depowdering for aerospace brackets.
- February 2025: Make48 partnered with UltiMaker, MakerBot, and Dynamism, bringing 3D printing curricula to 10,000 schools worldwide.
- January 2025: 3D Systems secured FDA clearance for patient-specific PEEK cranial implants after 60 successful surgeries.


Research Methodology Framework and Report Scope
Market Definitions and Key Coverage
Our study defines the 3D printing-for-prototyping market as all revenue earned worldwide from printers, purpose-built materials, and outsourced printing services that are used mainly to create visual, functional, or high-precision prototype parts before mass production. We track value at first point of sale in USD, capturing industrial and desktop systems across aerospace, automotive, healthcare, consumer goods, industrial machinery, and education settings.
Scope exclusion: In-house engineering labor costs, one-off hobbyist printers, and revenues linked purely to end-use production parts lie outside this definition.
Segmentation Overview
- By Technology
- Stereolithography (SLA)
- Selective Laser Sintering (SLS)
- Fused Deposition Modelling (FDM)
- Digital Light Processing (DLP)
- Binder Jetting
- Other Technologies
- By Material Type
- Polymer
- Metal
- Ceramic
- Composite and Hybrid
- Other Materials
- By Prototype Complexity
- Visual / Form-fit
- Functional
- High-precision Complex
- By End-user Industry
- Aerospace and Defense
- Automotive
- Healthcare
- Consumer Goods and Electronics
- Industrial Machinery
- Education and Research
- By Geography
- North America
- United States
- Canada
- Mexico
- South America
- Brazil
- Argentina
- Rest of South America
- Europe
- Germany
- United Kingdom
- France
- Italy
- Russia
- Rest of Europe
- Asia-Pacific
- China
- Japan
- India
- South Korea
- Rest of Asia-Pacific
- Middle East and Africa
- Middle East
- UAE
- Saudi Arabia
- Turkey
- Rest of Middle East
- Africa
- South Africa
- Nigeria
- Rest of Africa
- Middle East
- North America
Detailed Research Methodology and Data Validation
Primary Research
Mordor analysts interviewed printer OEM product managers, on-demand service bureaus in North America, Europe, and Asia-Pacific, as well as design-engineering leads at automotive and medical-device firms. These discussions confirmed typical print-volume ranges, average selling prices, and emerging needs such as AI-driven lattice infill, which secondary data alone could not quantify.
Desk Research
We began with public datasets from bodies such as the World Bank, UN Comtrade, and OECD to size manufacturing output and trade flows that signal prototype demand. Industry-specific sources, for example, ASTM International standards, Wohlers annual additive-manufacturing census, and statistics from the American Society of Mechanical Engineers, offered adoption ratios by sector. Company 10-Ks, investor decks, and patent filings enriched our view of installed base shifts. Select licensed datasets, including D&B Hoovers for firm-level revenue splits and Dow Jones Factiva for deal tracking, helped us benchmark supplier performance. This list is illustrative; many other sources were reviewed to cross-check facts and fill gaps.
Government procurement portals, academic journals on design iteration, and trade-show proceedings were also scanned, letting us spot early signals around material mixes and printer price movements that influence prototype budgets.
Market-Sizing & Forecasting
A top-down model converts manufacturing GDP, R&D spend, and new-product launch counts into a prototype demand pool, which is then validated through selective bottom-up checks of printer shipments and bureau billings. Key variables include average prototypes per launch, printer utilization rates, blended material-to-hardware spend ratios, regulatory push for lighter medical trials, seasonality around auto model years, and regional currency swings. Multivariate regression with lagged R&D indicators underpins our 2025-2030 forecasts, while scenario analysis tests high-innovation and slowdown cases. Where supplier roll-ups were patchy, gap-filling relied on peer averages agreed during expert calls.
Data Validation & Update Cycle
Outputs pass a two-level analyst review, variance screens against historical series, and peer comparison. Reports refresh each year; interim updates trigger when major funding rounds, technology breakthroughs, or trade-policy shifts move the market materially.
Why Mordor's 3D Printing for Prototyping Baseline Stands Firm
Published estimates often differ because firms select unlike scopes, geographies, and refresh cadences.
Key gap drivers include whether services revenue is counted, how prototype complexity is weighted, and if desktop units sold through distributors are fully captured.
Benchmark comparison
| Market Size | Anonymized source | Primary gap driver |
|---|---|---|
| USD 11.67 B | Mordor Intelligence | - |
| USD 16.11 B | Global Consultancy A | Includes concept-testing spend and counts captive labs, inflating base |
| USD 23.07 B | Market Publisher B | Rolls hardware, software, and design services together; limited primary validation |
| USD 5.10 B | Regional Consultancy C | Covers only U S service revenue, omits hardware sales, hence smaller |
The comparison shows values climb or shrink once scope widens or narrows. Mordor's disciplined definition, blended top-down plus bottom-up checks, and annual refresh give decision-makers a balanced, traceable baseline they can rely on.


Key Questions Answered in the Report
What is the current size and growth outlook for 3D printing in prototyping?
The market was valued at USD 13.47 billion in 2026 and is forecast to reach USD 27.62 billion by 2031, reflecting a 15.44% CAGR.
Which region is growing the fastest?
Asia-Pacific is projected to record a 17.32% CAGR through 2031, fuelled by China’s industrial policy support and Japan’s reshoring incentives.
Why are healthcare players accelerating adoption?
Patient-specific implants and surgical guides are expanding quickly after January 2025 FDA clearance for PEEK cranial implants, driving a 19.76% CAGR in the healthcare segment.
How are AI tools changing prototyping workflows?
Generative-AI and real-time recipe correction platforms now optimize geometries and cut first-attempt failures, reducing material waste and development cycles.
What is the biggest barrier to wider metal 3D printing uptake?
Industrial metal printers often cost USD 500,000–2 million before post-processing investment, posing financing hurdles for small and midsize manufacturers.
Which technology segment is gaining share fastest?
Binder jetting is advancing at an 17.74% CAGR, driven by support-free metal part production and growing aerospace and automotive use cases.
Page last updated on:


