3D Projector Market Size and Share
Market Overview
| Study Period | 2020 - 2031 |
|---|---|
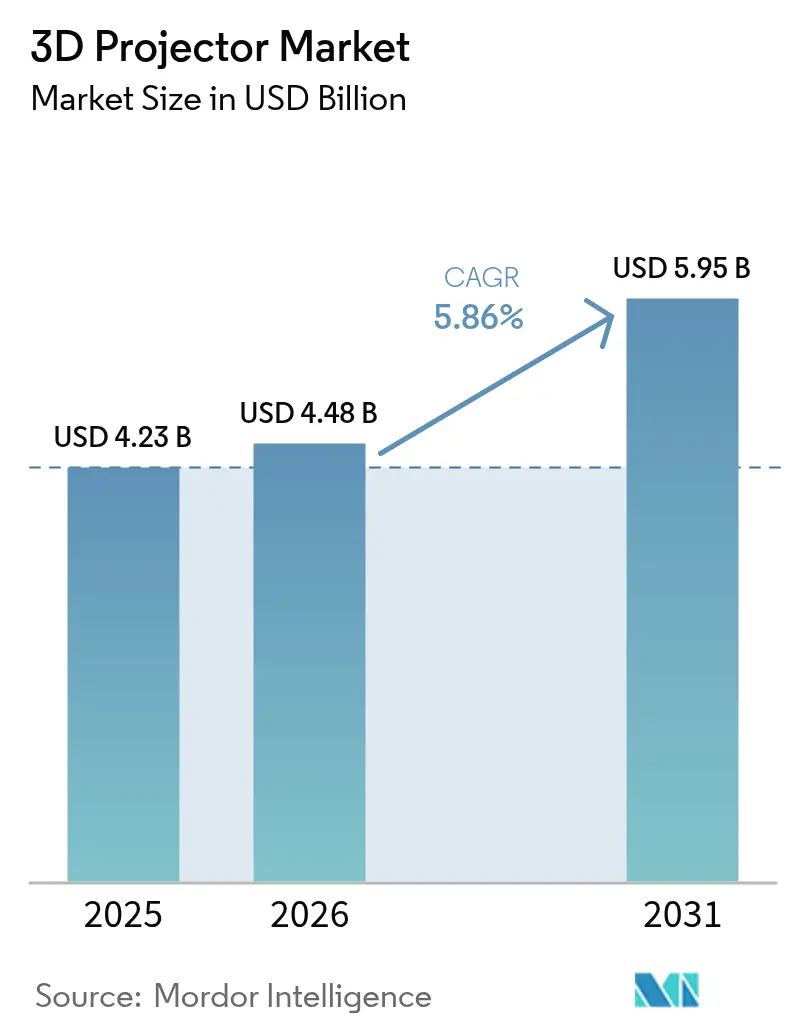
| Market Size (2026) | USD 4.48 Billion |
| Market Size (2031) | USD 5.95 Billion |
| Growth Rate (2026 - 2031) | 5.86% CAGR |
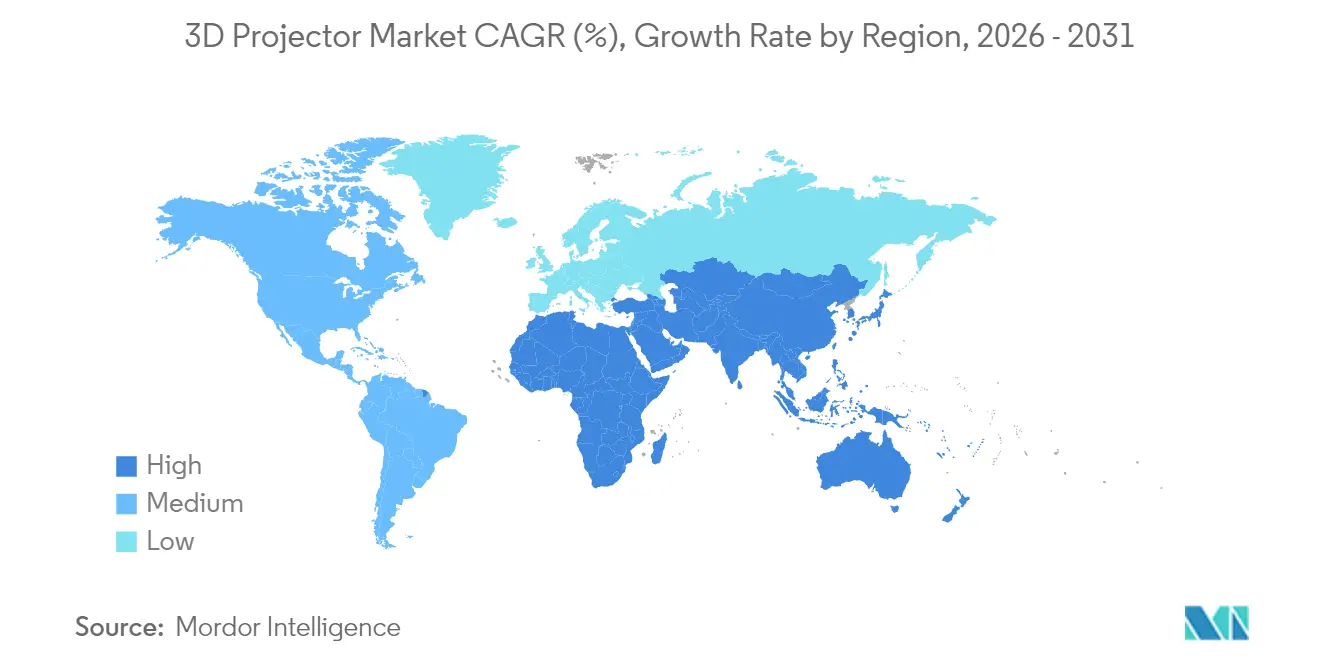
| Fastest Growing Market | Middle East and Africa |
| Largest Market | Asia Pacific |
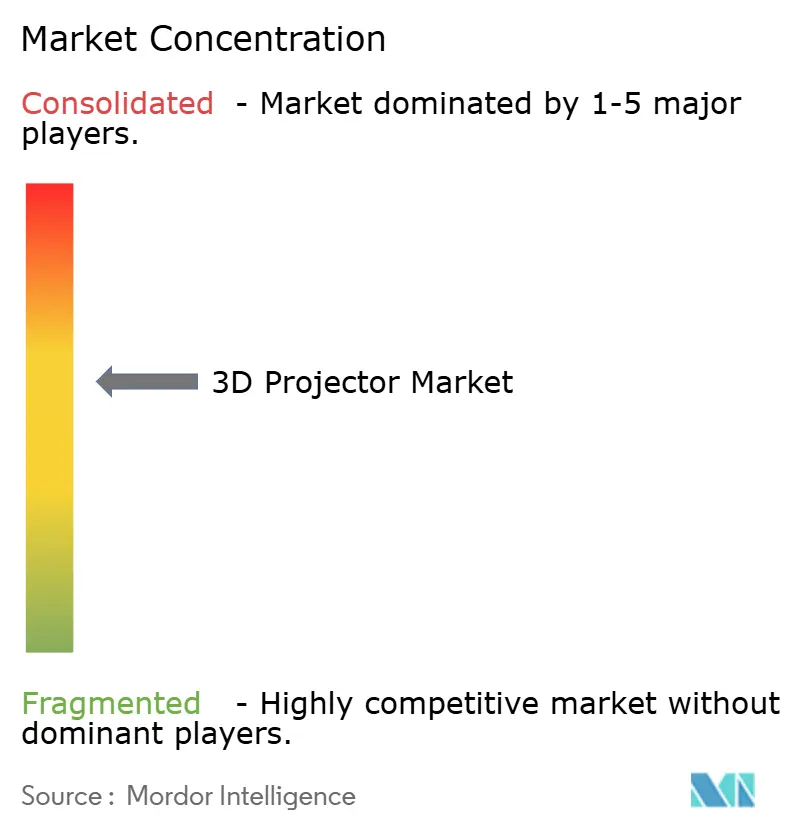
| Market Concentration | Medium |
Major Players *Disclaimer: Major Players sorted in no particular order Image © Mordor Intelligence. Reuse requires attribution under CC BY 4.0. | |
3D Projector Market Analysis by Mordor Intelligence
The 3D projector market size was valued at USD 4.23 billion in 2025 and estimated to grow from USD 4.48 billion in 2026 to reach USD 5.95 billion by 2031, at a CAGR of 5.86% during the forecast period (2026-2031). Progress continues despite growing interest in direct-view LED because laser illumination, advanced image processors and falling cost-per-lumen keep projection competitive for both fixed and portable uses. High-brightness laser platforms dominate professional venues, while battery-powered pico models gain traction in home entertainment and pop-up retail. Demand for 4K resolution and ≥10,000-lumen systems is expanding fastest as venues seek brighter, sharper images that stand up to ambient light. At the same time, e-commerce is changing how buyers research and procure equipment, pushing manufacturers to simplify installation and offer richer online product data.
Key Report Takeaways
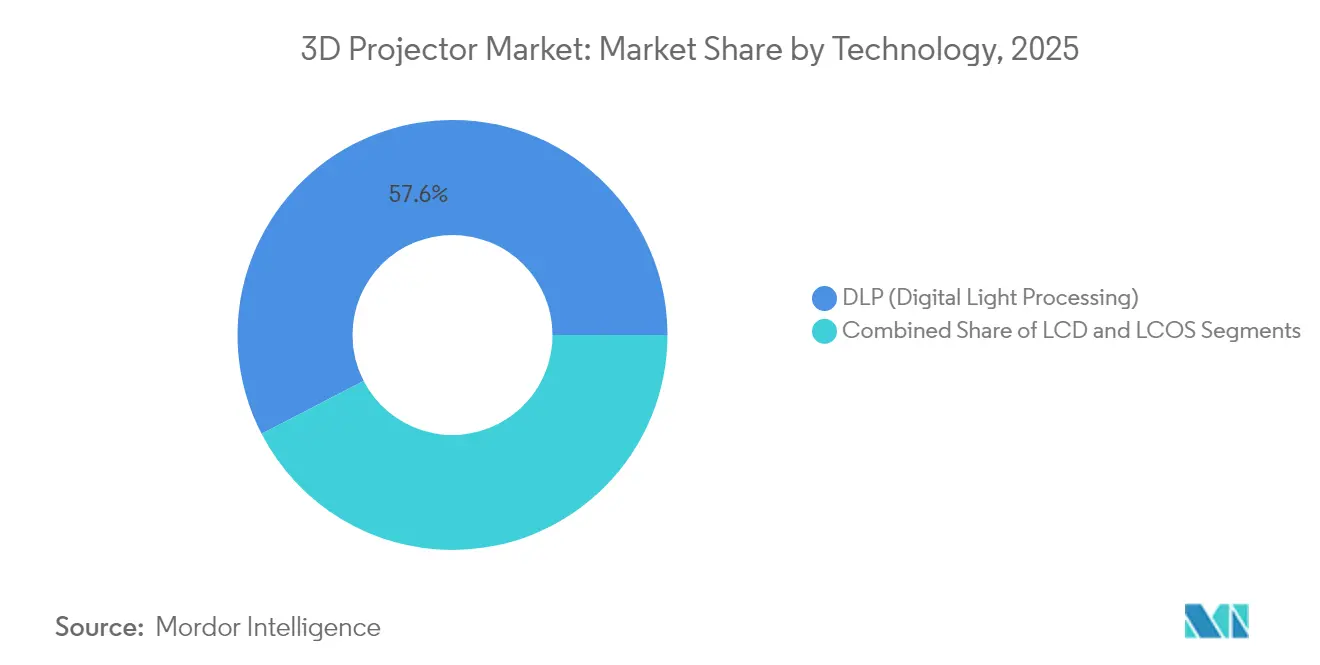
- By technology, DLP systems held 57.60% of the 3D projector market share in 2025; LCOS is projected to grow at a 5.95% CAGR through 2031.
- By light source, laser projectors commanded 46.10% of the 3D projector market size in 2025, while LED models recorded the fastest 8.05% CAGR to 2031.
- By brightness, 4,000-9,999-lumen units captured 35.50% of the 3D projector market size in 2025; ≥10,000-lumen models are rising at a 7.25% CAGR.
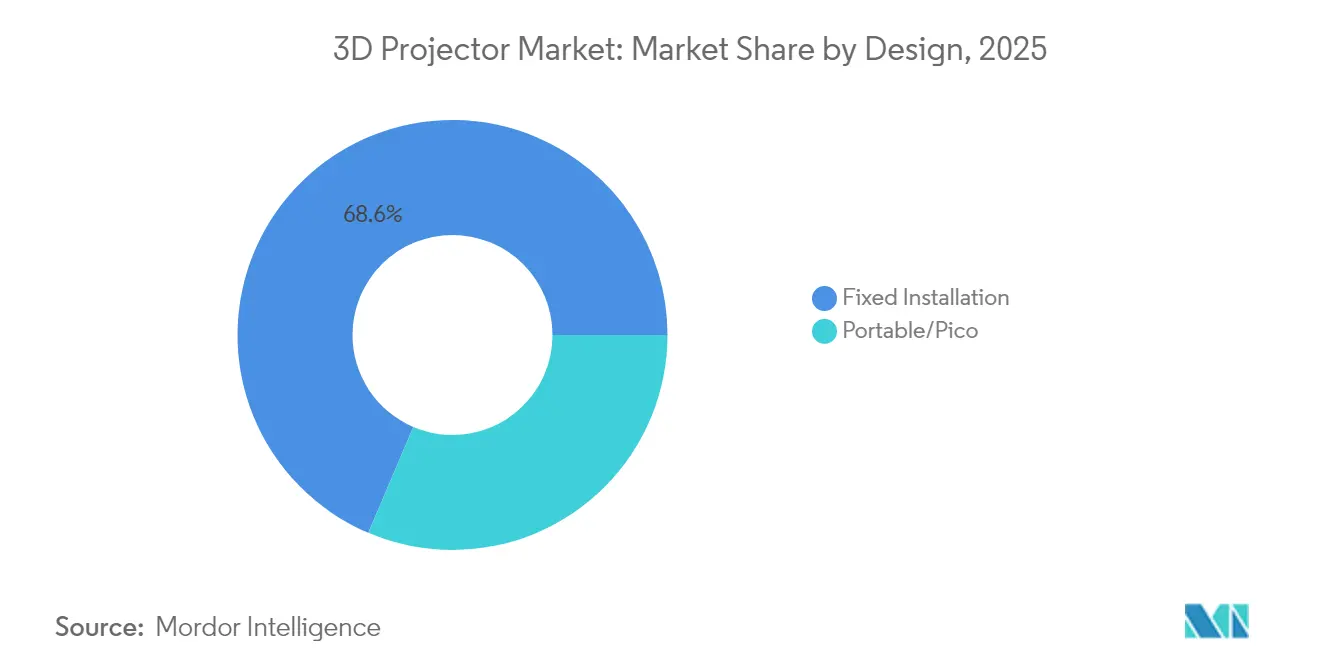
- By design, fixed-installation products led with 68.60% revenue share in 2025; portable and pico units are expanding at a 8.75% CAGR.
- By end-user, cinema accounted for 32.00% of the 3D projector market size in 2025; events and large venues post the highest 6.45% CAGR.
- By geography, Asia Pacific held 41.70% of revenue in 2025, while the Middle East and Africa is the fastest-growing region at 6.90% CAGR.
Note: Market size and forecast figures in this report are generated using Mordor Intelligence’s proprietary estimation framework, updated with the latest available data and insights as of 2026.
Global 3D Projector Market Trends and Insights
Drivers Impact Analysis*
| Driver | (~) % Impact on CAGR Forecast | Geographic Relevance | Impact Timeline |
|---|---|---|---|
| Laser-phosphor light sources cut TCO | +1.2% | North America and Europe | Medium term (2–4 years) |
| Immersive theme parks and attractions | +1.0% | Asia Pacific and Middle East | Medium term (2–4 years) |
| Smart-classroom rollouts | +0.8% | Asia Pacific | Short term (≤2 years) |
| Revival of 4K-HDR 3D movies | +0.6% | Global | Medium term (2–4 years) |
| Enterprise metaverse rooms | +0.7% | North America and Europe | Long term (≥4 years) |
| Urban home-theatre adoption | +0.5% | Asia Pacific | Short term (≤2 years) |
| Source: Mordor Intelligence | |||
Proliferation of Laser-Phosphor Light Sources Enhancing TCO in Pro-AV Installations
Laser-phosphor illumination extends operating life to roughly 20,000 hours, slashes lamp-replacement downtime, and can trim total cost of ownership by 40% compared with legacy lamps.[1]Christie Digital, “Laser Illumination for Cinema,” christiedigital.com Professional venues leverage this stability to negotiate longer fixed-price service contracts and reduce mid-show failures. Consistent brightness and color over the projector’s life also improves brand standards for franchise cinema chains and touring productions. As laser pricing falls, channel partners bundle longer warranties that further de-risk capital outlays. These economics will keep laser platforms at the center of premium venue upgrades through the medium term, reinforcing a quality gap over lamp-based rivals in corporate, education, and entertainment settings.
Rapid Expansion of Immersive Theme Parks and Attractions in China and GCC
Large-format attractions in Shanghai, Dubai, and Riyadh increasingly specify multi-projector arrays exceeding 10,000 lumens per unit to deliver floor-to-ceiling visuals. Such projects fuel a 7.5% CAGR for the high-brightness tier, with suppliers like BenQ offering 4K simulation models fitted with proprietary dust-proofing to handle desert climates. Premium installs set new visual benchmarks that ripple into corporate innovation centers and higher-education labs. Content creators likewise shift pipelines toward higher resolutions and frame rates to match these brighter canvases, reinforcing hardware demand.
Government-Backed Smart Classroom 3D Deployments across India and ASEAN
National procurement programs standardize interactive 3D specifications across thousands of classrooms, accelerating volume adoption. India’s projector market alone is forecast to surpass USD 2.1 billion by 2029, with STEM curricula driving the requirement for stereoscopic visualization.[2]Vijay Sharma, “Rapid Growth of the Indian Projector Market,” dqindia.com Large tenders emphasise robust connectivity, low maintenance, and content-agnostic platforms, steering vendors toward laser-phosphor engines and open software ecosystems. Positive learning-outcome studies spur private schools to mirror state specifications, expanding addressable demand without further public funding.
Revival of 4K-HDR 3D Movie Releases by Hollywood and Chinese Studios
Studio slates show renewed interest in premium 3D titles as they court theatrical revenues that outperform 2D equivalents in average ticket price. With HDR finishing workflows now mature, content arrives brighter, with deeper contrast that pushes exhibitors to adopt projectors capable of higher peak lumens. This pull-through effect stabilizes cinema demand even as some premium auditoriums migrate to LED. Ancillary markets such as themed entertainment and home cinema also benefit from the richer content pipeline, keeping the 3D projector market vibrant across tiers.
Restraints Impact Analysis*
| Restraint | (~) % Impact on CAGR Forecast | Geographic Relevance | Impact Timeline |
|---|---|---|---|
| Direct-view LED cannibalization of premium cinema | –0.9% | North America and Europe | Medium term (2–4 years) |
| Motion sickness and eye fatigue in education | –0.5% | Global | Short term (≤2 years) |
| Weak 3D content infrastructure in emerging markets | –0.7% | Asia Pacific and Latin America | Medium term (2–4 years) |
| High Capex for small EU cinemas | –0.6% | Europe | Short term (≤2 years) |
| Source: Mordor Intelligence | |||
Direct-View LED Walls Cannibalizing Premium Cinema Screens
LED cinema displays deliver uniform brightness, high contrast, and no projection booth requirements, making them attractive for new construction. They circumvent issues such as polarization-related dimming in 3D presentation, reducing the functional advantage of projection. Capital costs remain higher, yet some multiplex operators justify the spend by repurposing freed-up booth space for additional seats or retail concessions. As LED pixel pitch tightens and price curves descend, projector vendors must sharpen differentiation in TCO and color accuracy to defend marquee auditoriums.
Motion Sickness and Eye-Fatigue Concerns in Education Use-Cases
Prolonged viewing of stereoscopic material can induce discomfort in younger students, prompting some school districts to restrict usage to short modules. Manufacturers respond with adjustable depth cues and lower frame-interleaving frequencies, but evidence-based guidelines are still evolving. The uncertainty deters smaller institutions from investing heavily in 3D-specific hardware, marginally slowing expansion in the education vertical until best practices are standardized.
*Our forecasts treat driver/restraint impacts as directional, not additive. The impact forecasts reflect baseline growth, mix effects, and variable interactions.
Segment Analysis
By Technology: DLP’s Dominance Meets LCOS Momentum
Digital Light Processing maintained 57.60% of the 3D projector market share in 2025, reflecting its strong contrast and compact optical engine. The segment benefits from a mature component supply chain that keeps costs predictable for integrators. LCOS, however, is posting a 5.95% CAGR as design studios and premium home cinemas value its reduced screen-door effect and smoother images. Competitive positioning is becoming application-specific; DLP often prevails in portable and rental fleets, whereas LCOS secures high-fidelity simulators.
LCOS shipments will keep eroding DLP’s lead in scenarios where pixel density and color uniformity outweigh absolute brightness. Yet, the total 3D projector market size tied to DLP platforms is expected to stay significant through 2031 because deep channel inventories, firmware familiarity, and accessory ecosystems favor continuity. LCD remains relevant in cost-sensitive education tenders, though price gaps versus entry-level DLP are narrowing as laser engines head down-market.


By Light Source: Laser Leads, LED Accelerates
Laser units captured 46.10% of revenue in 2025, a clear signal that professional venues now prioritise maintenance-free operation over lower first cost. Vendor roadmaps increasingly differentiate between pure RGB systems for flagship auditoriums and laser-phosphor hybrids that balance cost and color gamut. The 3D projector market size for laser models is forecast to expand alongside falling diode prices and wider acceptance of 120-volt compatibility, which eases electrical planning.
LED’s 8.05% CAGR owes much to the portable and pico boom. Battery operation, near-instant on/off, and low thermals create user experiences that rival smart TVs, especially when paired with integrated streaming. Lamp-based products now cater almost exclusively to budget buyers who prioritise low acquisition cost over lifetime economics, and their share will continue declining as emerging markets leapfrog straight to solid-state illumination.
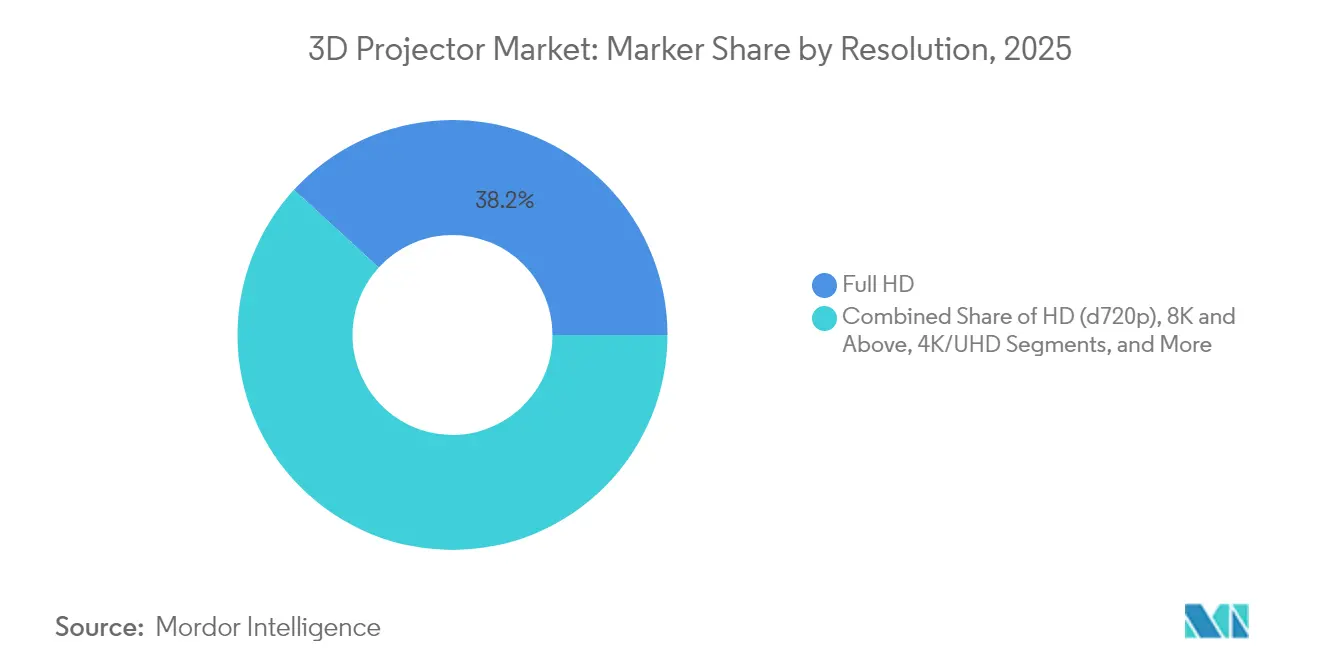
By Resolution: 4K Uptake Spreads Beyond Cinema
Full-HD kept 38.20% revenue share in 2025 because it balances clarity with bandwidth and content availability. Nevertheless, 4K/UHD shipments are climbing at 6.95% CAGR as enterprises and universities invest in higher-resolution collaboration spaces. Native-4K chips remain pricey, so brands deploy pixel-shift technologies such as JVC’s e-shiftX to deliver near-4K acuity at lower bit-rate overheads.
Above-4K, early 8K models serve as halo products, sustaining R&D in optics and image processing. While the 3D projector market share above 4K is small today, these flagships shape buyer expectations and provide technology trickle-down benefits to mid-tier lines over time.
By Brightness: High-Lumen Tier Broadens
Projectors rated 4,000-9,999 lumens held 35.50% market share in 2025, underpinning corporate auditoriums and mid-sized lecture halls. Their sweet-spot pricing wins against wall-mounted flat panels above 100 inches. Yet ≥10,000-lumen devices are advancing at 7.25% CAGR as immersive art exhibits, esports arenas, and worship venues demand ever-brighter canvases. Epson’s 20,000-lumen EB-PQ models run on standard mains power, removing a chief barrier to adoption.
Vendors also push brightness in portable form factors; 3-chip 3LCD engines now squeeze over 5,000 lumens into chassis suited for rolling racks. As buyers perceive brightness as the simplest spec for comparing value, lumen-led marketing will continue shaping product roadmaps.
By Design: Portables Disrupt Install Base
Fixed installations commanded 68.60% of revenue in 2025, supported by entrenched pro-AV channels and venue-specific rigging hardware. Long laser lifespans now stretch replacement cycles, tempering unit volumes but raising average selling price. Meanwhile, portable and pico units record 8.75% CAGR as remote work, micro-events, and pop-up retail intensify demand for displays that can travel. Users value compact chassis, auto-keystone, and smartphone mirroring—features migrating rapidly from consumer electronics into enterprise SKUs.
Manufacturers court this growth by shipping suitcase-ready lasers with integrated soundbars and Netflix certification, such as Formovie’s Google TV model. Fixed-rig vendors respond with modular lens kits and tool-free servicing to keep their platform economics compelling.
By End-User Application: Venues Diversify
Cinema kept a 32.00% share in 2025, anchored by emerging-market multiplex builds even as upper-tier screens test LED alternatives. Conversion to 4K laser maintains projection relevance by delivering HDR imagery that sustains premium ticket pricing. Education buying remains steady, but pedagogical trends toward blended learning favor interactive flat panels for front-of-class and projectors for immersive labs.
Events and large venues post a 6.45% CAGR on the back of touring concerts, esports tournaments, and experiential marketing. BenQ’s 10,000-lumen LU9800, rated for 360° operation, highlights how edge-blending and portrait orientation create new revenue models for rental houses. Home theatre and gaming continue to grow as streaming platforms release more HDR 3D titles.
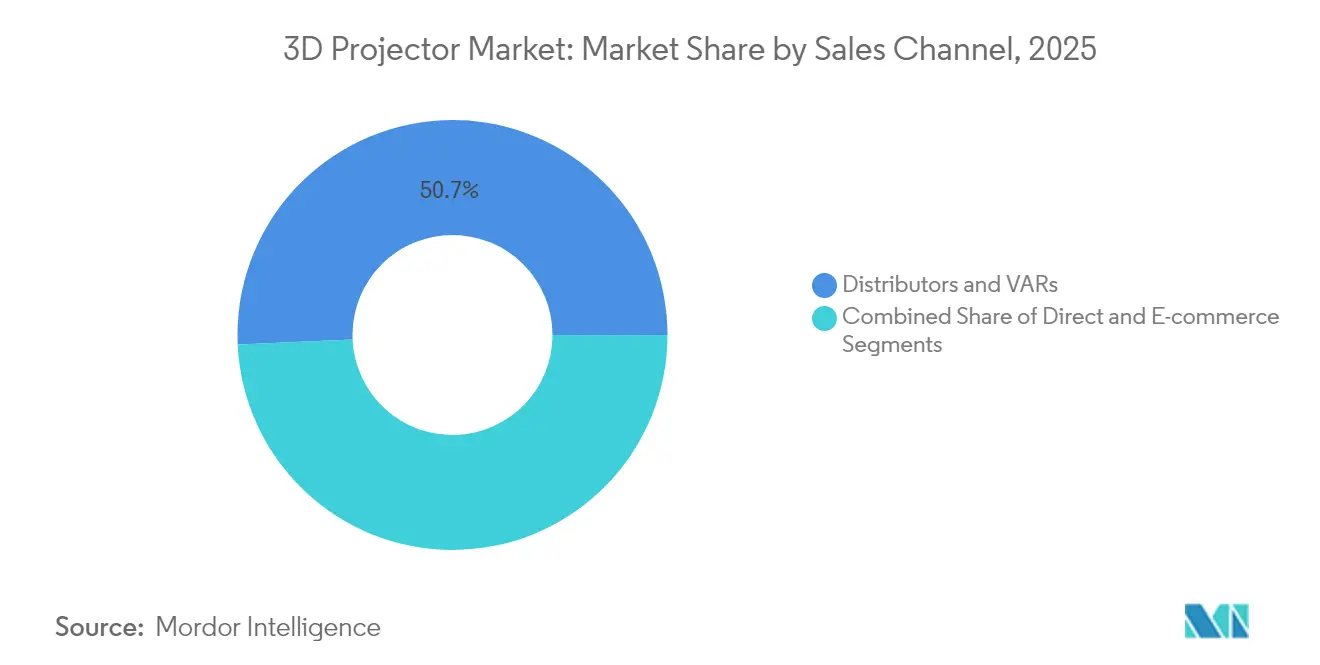
By Sales Channel: E-Commerce Rethinks Procurement
Distributors and VARs own 50.70% of 2025 revenue, leveraging deep integration know-how and bundled service agreements. Their share remains resilient in complex installs where site surveys and after-sales support are critical. E-commerce, however, is rising 9.25% CAGR, propelled by buyers in education and SMB segments who rely on granular online spec filters and peer reviews before checkout. Brands now deliver self-diagnostic firmware updates to cut support calls, aligning product design with the DIY ethos of online purchasing.
Direct OEM deals persist among top cinema chains and auto makers that negotiate bespoke optics or warranty terms. Overall, multichannel strategies become essential as buyers toggle between online research and in-person demos depending on project scope.
Geography Analysis
Asia Pacific led with 41.70% revenue in 2025, driven by China’s premium theme-park pipeline and India’s public-sector education programs. Chinese integrators source >10,000-lumen lasers for immersive rides, while Indian tenders specify mid-range interactive models for STEM labs, lifting regional shipments across price bands. Japan’s dense urban housing supports strong home-theatre uptake, reinforcing portable growth.
The Middle East and Africa post the highest 6.90% CAGR to 2031. GCC governments embed projection into cultural mega-projects and digital classrooms, often mandating RGB laser for marquee attractions. Saudi Arabia’s entertainment build-out accelerates demand for ≥20,000-lumen rigs able to withstand desert dust without external chillers. Content localization lags hardware rollouts, yet fiber upgrades and local studios are narrowing the gap.
North America and Europe see steady replacement demand as operators swap lamps for lasers to reduce service costs. Corporate users outfit metaverse visualization rooms that synergize with broader digital-twin strategies. Latin America remains challenged by currency swings, though Brazil’s cinema chains still prioritize projector upgrades over LED due to lower site-fit costs.

Competitive Landscape
The top five suppliers - Epson, Sony, Barco, Christie Digital, and BenQ - controlled roughly 60% of global revenue in 2024, indicating moderate concentration. Technology roadmaps split between premium RGB laser aimed at large venues and cost-optimised LED for portables. Sony re-entered Europe with its BRAVIA Projector 7, signalling renewed regional emphasis after portfolio consolidation. Epson continues to stretch laser brightness while simplifying power requirements to defend rental-staging share.[6]Epson, “Epson Boosts the Accessibility of Large Venue Projectors,” news.epson.com
Chinese upstarts Xiaomi and Hisense leverage domestic economies of scale to undercut incumbents abroad, especially in sub-USD 1,000 smart projectors. Hisense’s Light Steering demo with Barco at CES 2025 illustrated collaboration across value-chain boundaries to address HDR limitations in projection. Niche players specialise in simulation, faith venues, or architectural mapping, often bundling software and calibration services to shield margins.
Component ecosystems also evolve: laser diode vendors push blue-pump phosphor efficiency past 5 W output per emitter, while Texas Instruments scales DMD wafer sizes to lower per-mirror cost. These upstream dynamics influence downstream pricing strategies and open space for ODM partnerships targeting white-label consumer brands.
3D Projector Industry Leaders
Seiko Epson Corp.
Sony Corp.
Barco NV
BenQ Corp. (Qisda)
Optoma Corp. (Coretronic)
- *Disclaimer: Major Players sorted in no particular order

Recent Industry Developments
- May 2025: Sony announced its BRAVIA Projector 7 for Europe, marking a return to the region’s residential and commercial markets.
- May 2025: Epson introduced the EH-QS100 4K PRO-UHD super-short-throw laser projector to strengthen its position in premium home cinema.
- February 2025: Epson enabled 120-volt power for up to 19,000-lumen EB-PU projectors, cutting installation costs for large venues.
- February 2025: BenQ launched GP520 and W2720i smart cinema projectors with integrated streaming to simplify home setup.


Research Methodology Framework and Report Scope
Market Definitions and Key Coverage
Our study treats the global 3D projector market as all factory-built projection devices that transform stereoscopic video signals into depth-perceived images on a two-dimensional surface when viewed with compatible eyewear. Revenue values reflect new-unit sales plus associated embedded software and light engines, expressed in USD.
Scope exclusion: aftermarket 3D lens kits, rental revenues, and pure 2D projectors upgraded via firmware are not counted.
Segmentation Overview
- By Technology
- DLP (Digital Light Processing)
- LCD
- LCOS
- By Light Source
- Laser (Solid-State and Laser-Phosphor)
- LED
- Lamp-Based
- Hybrid/Phosphor-LED
- By Resolution
- HD (≤720p)
- Full-HD (1080p)
- 4K/UHD
- 8K and Above
- By Brightness (ANSI Lumens)
- Less than 2,000
- 2,000-3,999
- 4,000-9,999
- ≥10,000
- By Design
- Fixed Installation
- Portable/Pico
- By End-user Application
- Cinema
- Education
- Home Theatre and Gaming
- Business and Corporate
- Events and Large Venues
- Other Applications
- By Sales Channel
- Direct (B2B/OEM)
- Distributors and VARs
- E-Commerce
- By Geography
- North America
- United States
- Canada
- Mexico
- Europe
- Germany
- United Kingdom
- France
- Italy
- Spain
- Russia
- Rest of Europe
- Asia-Pacific
- China
- Japan
- South Korea
- India
- ASEAN
- Rest of Asia-Pacific
- South America
- Brazil
- Argentina
- Rest of South America
- Middle East and Africa
- Saudi Arabia
- United Arab Emirates
- Turkey
- South Africa
- Rest of Middle East and Africa
- North America
Detailed Research Methodology and Data Validation
Primary Research
We then interviewed regional cinema integrators, campus AV managers, component suppliers, and channel distributors across Asia-Pacific, North America, and Europe. These conversations validated real-world penetration rates for laser light engines, clarified average selling prices by brightness band, and surfaced utilization patterns in hybrid classrooms that are rarely documented publicly.
Desk Research
Mordor analysts began by mapping supply chains and demand pools through open datasets from UNESCO's Institute for Statistics, the Motion Picture Association, UN Comtrade shipment codes 852869 and 900850, and education hardware spend published by OECD. Trade-body white papers from the Laser Illuminated Projector Association, academic journals covering stereoscopic display physics, and recent 10-K filings of leading optics manufacturers enriched our cost and price benchmarks. Paid repositories, D&B Hoovers for company revenue splits and Dow Jones Factiva for installation counts, supported trend triangulation. The sources listed illustrate, not exhaust, the references we reviewed during desk work.
Market-Sizing & Forecasting
A top-down install-base reconstruction was built from annual projector shipments and replacement cycles, followed by selective bottom-up cross-checks using sampled ASP by lumens roll-ups from distributor invoices. Core variables driving the model include: (i) new cinema screen additions, (ii) tertiary education classroom counts, (iii) corporate meeting room refresh intervals, (iv) laser light source price erosion, and (v) regional disposable income growth influencing home theater uptake. Multivariate regression, informed by those indicators and tempered with scenario analysis for LED video wall substitution, yielded the baseline value. Forecasts apply exponential smoothing on each driver after policy and technology assumptions are peer reviewed with our primary respondents.
Data Validation & Update Cycle
Outputs undergo variance checks against historical ratios, independent cinema box office trends, and customs shipment tallies. A second analyst audits formulas, and material deviations trigger re-contacts. Full refreshes occur annually; interim updates run when quarterly shipment spikes or regulatory shifts exceed preset thresholds.
Why Mordor's 3D Projector Baseline Commands Reliability
Published values often diverge because firms pick differing device classes, price points, or refresh cadences. Mordor's disciplined scope and dual-layer modeling keep those choices transparent.
Key gap drivers versus other publishers include: some fold rental turnover into sales, a few apply uniform ASP growth ignoring laser deflation, and several extend forecasts without checking emerging LED wall cannibalization. Our annual refresh and validated light engine cost curves curb such drift.
Benchmark comparison
| Market Size | Anonymized source | Primary gap driver |
|---|---|---|
| USD 4.23 bn (2025) | Mordor Intelligence | - |
| USD 3.99 bn (2024) | Global Consultancy A | excludes home theater channel, uses 2019 currency base |
| USD 4.41 bn (2024) | Industry Association B | counts refurbished units, no primary price validation |
| USD 4.40 bn (2024) | Regional Consultancy C | projects straight line growth, omits LED substitution factor |
Taken together, the comparison shows that Mordor's figures sit within the observed range yet rest on clearly articulated scope rules, validated variables, and a refresh cadence that decision makers can trust.


Key Questions Answered in the Report
What is the current size and forecast growth of the 3D projector market?
The 3D projector market stands at USD 4.48 billion in 2026 and is projected to reach USD 5.95 billion by 2031, advancing at a 5.86% CAGR during the forecast period (2026-2031).
Which region holds the largest share of the 3D projector market?
Asia Pacific leads with 41.70% revenue in 2025, supported by China’s premium attractions and India’s large-scale smart-classroom rollouts.
Which projection technology is growing fastest?
LCOS is the fastest-growing technology segment, expanding at a 5.95% CAGR from 2026 to 2031 due to its high pixel density and smooth images.
How do laser light sources affect total cost of ownership?
Laser-phosphor engines offer up to 20,000 hours of maintenance-free use, cutting TCO by as much as 40% versus lamp systems while keeping brightness stable.
Why is e-commerce becoming a key channel for 3D projector sales?
Online platforms enable quick price and spec comparisons, driving a 9.25% CAGR in e-commerce sales as home-entertainment and SMB buyers prefer direct purchase.
What is the main restraint on premium-cinema 3D projectors?
Direct-view LED walls are displacing projectors in top-tier auditoriums by delivering higher brightness and contrast without a dedicated projection booth.
Page last updated on:


