
Market Overview
| Study Period | 2020 - 2031 |
|---|---|
| Forecast Data Period | 2026 - 2031 |
| Historical Data Period | 2020 - 2024 |
| Growth Rate | 17.35 % |
| Market Concentration | Medium |
Major Players *Disclaimer: Major Players sorted in no particular order Image © Mordor Intelligence. Reuse requires attribution under CC BY 4.0. | |
Asia-Pacific Healthcare 3D Printing Market Analysis by Mordor Intelligence
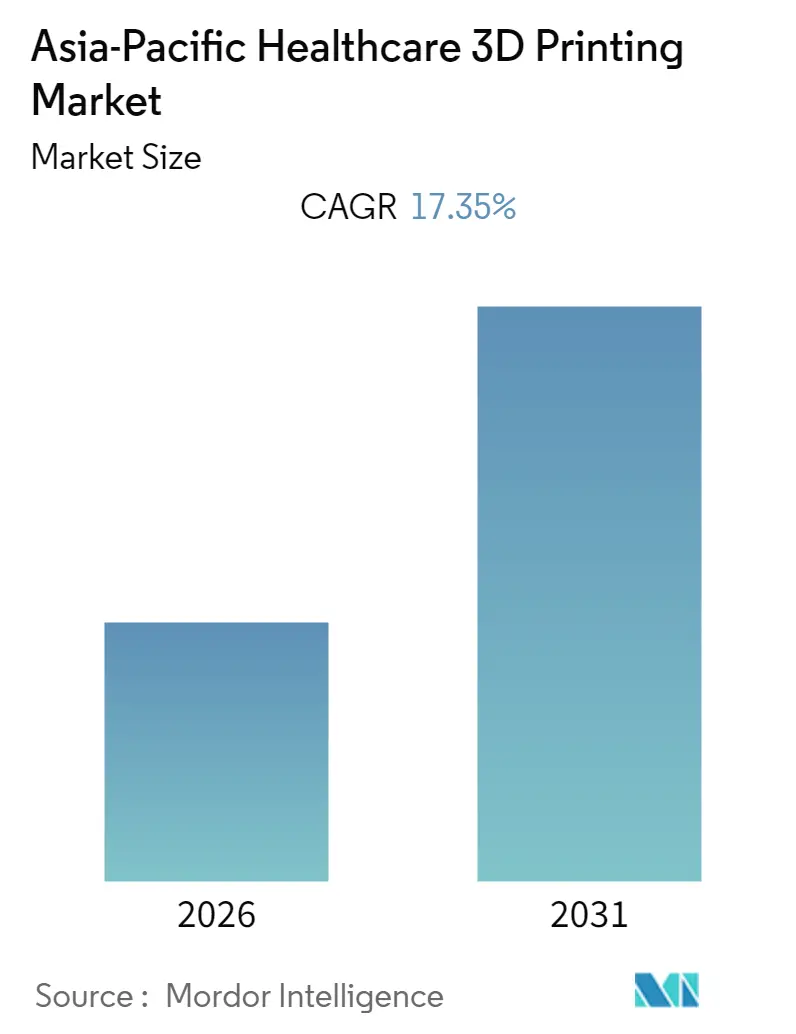
The Asia-Pacific Healthcare 3D Printing Market size is expected to register a CAGR of 17.35% during the forecast period (2026-2031).
The COVID-19 pandemic had a significant impact on the market studied. According to the National Institute of Health study published in 2020, 3D printing was used extensively during the pandemic and was being utilized to produce vital medical supplies during the crisis. Some vital goods, including ventilator valves, face shields, swabs, oxygen valves, hand sanitizer holders, 3-D lung models, etc., were manufactured via 3D printing during the pandemic. The capacity of 3D printing to print locally using digital designs and reduce supply chain factors has been the key reason for its success. Furthermore, PubMed data published in November 2021 stated that the ability of 3D printing to manufacture/print complicated geometrical patterns locally was the primary reason for its widespread adoption during COVID-19. Therefore, it was observed that the pandemic positively impacted the market studied. However, the market has reached its pre-pandemic nature regarding demand for 3D printing and is expected to witness strong growth in the coming years.
Key factors responsible for the market growth include increasing demand for customized 3D printed parts and instruments and patent expiration. There has been an increase in the demand for customized additive manufacturing as customized structures are more comfortable for patients. For instance, in November 2021, the Australian Government expanded a world-class 3D medical manufacturing facility in Port Melbourne. Minister for Innovation, Medical Research, and the Digital Economy stated that the new investment will enable Melbourne-based 3DMEDiTech to transform its existing facility, supercharging Victoria's advanced medical manufacturing sector and reducing wait times for Victorians needing implants. Hence, with such demand for 3D printing, the market studied is expected to grow strongly in the coming years.
Additionally, data from the Journal of Controlled Release published in February 2021 stated that precision medicine has rapidly overtaken conventional medicine over the past few years. 3D printing, particularly Fused Deposition Modeling (FDM), has been proven to be a potential method for customizing oral medicine administration. The data further stated that additive manufacturing, often known as 3D printing technology, is expected to change how drugs are produced in the coming years. Hence, with the increasing use of 3D printing technology, the market studied is expected to grow significantly over the forecast period.
When patents on 3D printing technologies or specific medical devices expire, other companies can enter the market and manufacture similar products. This increased competition often leads to lower prices for 3D printers, materials, and medical devices, making them more accessible to healthcare providers and driving cost reduction in the industry.
However, additive manufacturing costs are still high, leading to affordability issues, especially in developing and underdeveloped countries. Also, there is a lack of skilled professionals to operate these machinery. These factors have impeded market growth.
Note: Market size and forecast figures in this report are generated using Mordor Intelligence’s proprietary estimation framework, updated with the latest available data and insights as of 2026.
Asia-Pacific Healthcare 3D Printing Market Trends and Insights
Wearable Devices Segment in Applications is Expected to Witness a Significant Growth in Coming Years
The next-generation tools for numerous healthcare applications are now considered wearable devices powered by developing 3D printing technology. In addition, a variety of 3D printed (bio)sensing platforms is available, including wearable oximeters, smart bandages, artificial skin, tattoo sensors, glucose sensors, lactate sensors, sweat sensors, strain sensors, tactile sensors, electroencephalography (EEG), electrocardiography (ECG), and others.
New launches of wearable devices in Asian countries are due to the increasing demand for the same. To provide innovative technologies, 3D printing is on the rise. For instance, in March 2022, Amrita University, a private university in India, launched a wearable health monitoring device. Amrita Spandanam is a wearable device that uses a finger clip to measure six body parameters: blood glucose, blood pressure, heart rate, blood oxygen, respiratory rate, and 6-lead ECG. Moreover, the wearable device integrates multiple learning models to predict the potential deterioration of a user's health.
Furthermore, in August 2022, SmartCardia launched the 7L patch, their 7-lead cardiac monitoring patch in India. This state-of-the-art patch monitor combines medical wearable technology with artificial intelligence (AI) to provide predictive and personalized patient insights through remote monitoring. Such product launches provide portable patient monitoring with the help of sensors embedded into them. Such product launches in the market are expected to boost the wearable devices segment in the coming future.


Japan is Expected to Witness a Strong Growth in Coming Years
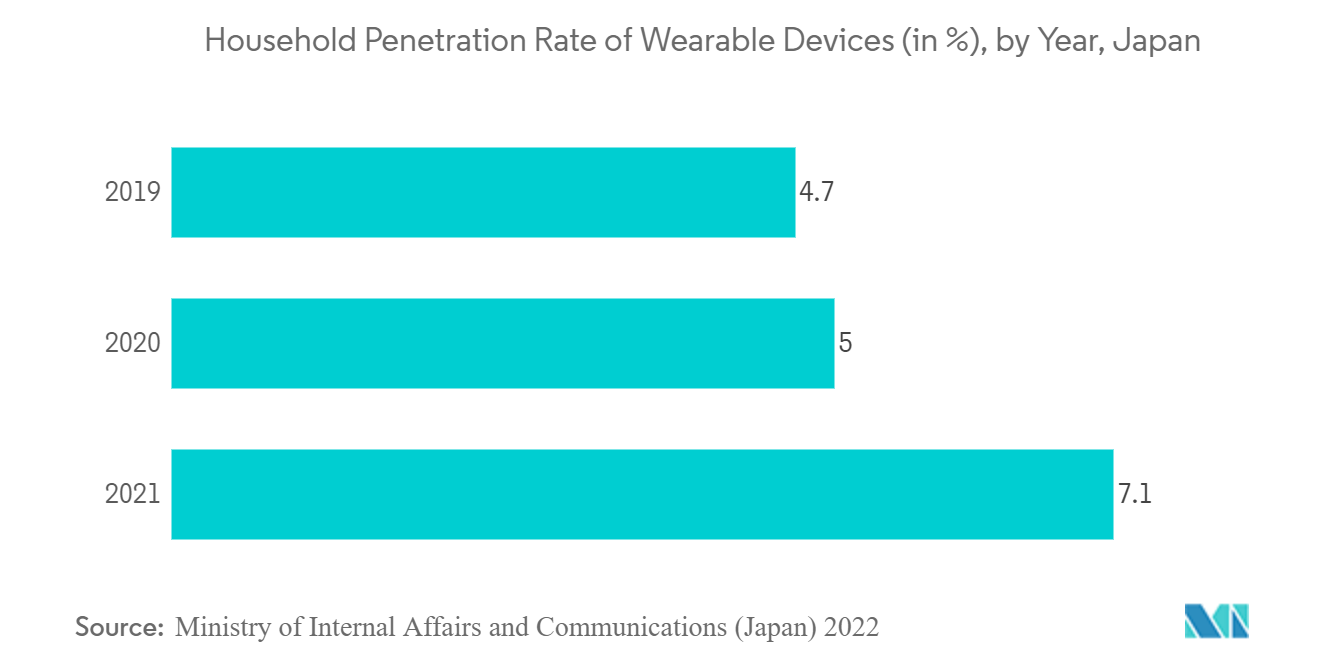
Japan is one of the most advanced countries in terms of technological innovations. Regarding the 3D printing market, Japanese tissue engineering specialists believe that 3-D printing technology will help regenerative medicine advance because it can economically produce human tissue.
Wearable sensor technology is largely growing in Japan, fueling the market growth. For instance, in October 2022, Biocorp, a French company specializing in designing, developing, and manufacturing innovative medical devices, announced a partnership agreement with Novo Nordisk to commercialize Mallya, initially in Japan. Mallya is a smart sensor that directly attaches to the Novo Nordisk FlexTouch insulin pens and can monitor blood glucose. With such key developments from the companies, it is believed that 3D printing technology will be increasing in the coming years across Japan.
Furthermore, in July 2021, Terumo Corporation launched Japan's Dexcom G6 continuous glucose monitoring system. Dexcom, Inc., based in the United States, manufactures the product, and Terumo holds the exclusive distribution agreement in Japan. The device includes a wearable monitoring sensor. Such developments are likely to bolster the market's growth studied in the forecast period.
TCT Japan (Formerly 3D Printing Japan) is a significant additive manufacturing and 3D printing event that attracts specialists from the industry to Tokyo to discuss the difficulties of implementing new technologies into the Japanese manufacturing business. Hence, with such events, people across the country are becoming more educated about 3D printing technology, which is surging the market growth.
Competitive Landscape
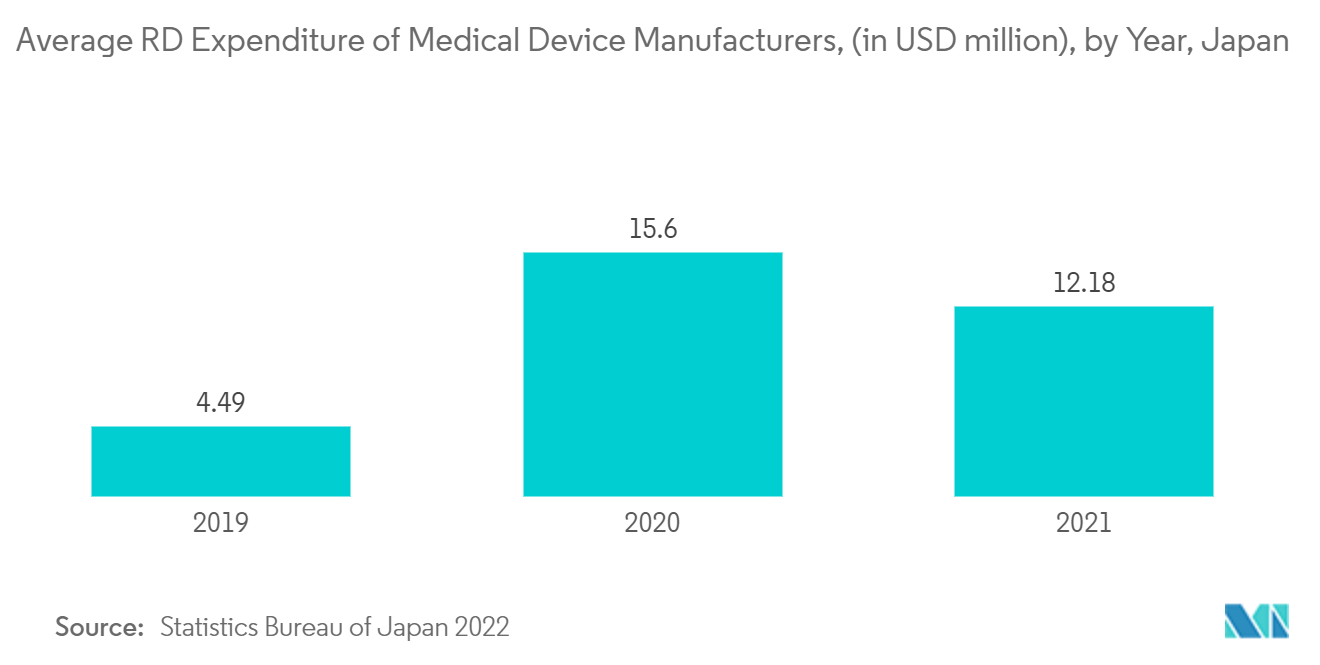
Most of the countries in Asia-Pacific are developing countries. These developing economies have a high number of people with unattended physical disabilities, which 3D printed instruments could improve. As a result, these countries are highly lucrative for global players to enter the market. Hence, this region enjoys the presence of most of the global players in the Healthcare 3D Printing market. Moreover, some regional players have also established their presence in the region.
Asia-Pacific Healthcare 3D Printing Industry Leaders
3D Systems Inc
EnvisionTEC GMBH
General Electric
Imaginarium
Materialise N.V.
- *Disclaimer: Major Players sorted in no particular order


Market Opportunities and Future Outlook
Hospital-led, point-of-care manufacturing and localized clinical workflows are creating openings for healthcare 3D printing across Asia-Pacific, particularly where providers can shorten surgical planning cycles and reduce dependence on imported parts. In 2026, Siriraj Hospital announced in-house production of patient-specific titanium hip sockets, and Vinmec Healthcare System launched a nationwide robotic surgery network in Vietnam that integrates preoperative 3D reconstruction and patient-specific manufacturing workflows across five cities. These examples expand demand beyond standalone printer installations toward end-to-end clinical services (pre-surgical models, cutting guides, and patient-matched implants), which in turn supports recurring requirements for qualified materials, software, and validation services.
Scaling cross-border deployments is also being shaped by more visible regulatory approvals and region-specific clinical validation pathways, especially for custom orthopaedic and surgical applications where hospital adoption depends on local authorization and documented performance. In China, Osteopore reported Hainan Medical Products Administration approval for custom orthopaedic device use at Shanghai Ruijin Hospital's Hainan branch, followed by a first clinical delivery of a 3D-printed bioresorbable orthopaedic implant at the same site (July 2026). Capacity investments such as Align Technology's USD 200 million investment in Hyderabad for digital dentistry and clear aligner capacity reinforce that momentum, supporting opportunities for players that combine regulatory-ready device pathways, local manufacturing nodes, and partnerships with hospital networks to support standardized, repeatable clinical production.
Recent Industry Developments
- June 2026: 3D Systems formalized a strategic partnership with 3D Smart Solutions in Vietnam to expand access to its 3D printing technologies and strengthen local implementation capability. The collaboration supports build-out across industrial users, with spillover into healthcare-related applications as local service, training, and deployment capacity grows.
- December 2025: GE HealthCare received a contract to supply more than 300 advanced CT scanners to public hospitals across 38 provinces in Indonesia under the Strengthening Indonesia Health Referral Network (SIHREN) program. This scale of deployment expands advanced imaging availability and supports upstream demand for patient-specific planning workflows, where 3D printing is used for anatomical modeling and procedure preparation.
- March 2024: GE HealthCare and Wipro GE HealthCare announced an investment plan of over INR 8,000 crores over the next five years to expand manufacturing output and local R&D in India. The plan advances localization of medtech supply chains and engineering capability, supporting broader adoption of digital manufacturing approaches that include healthcare 3D printing in clinical and device-development workflows.


Research Methodology Framework and Report Scope
Market Definition and Coverage
For this study, the market is defined as revenue earned in Asia Pacific from 3D printing used for healthcare purposes, covering printers, printable materials, and healthcare-focused printing services that support patient care and clinical workflows.
Scope exclusions: General-purpose industrial 3D printing used outside healthcare settings and basic 3D CAD software revenue are excluded from this market sizing.
Segmentation Overview
- By Technology
- Stereolithography
- Deposition Modeling
- Electron Beam Melting
- Laser Sintering
- Jetting Technology
- Laminated Object Manufacturing
- Other Technologies
- By Application
- Medical Implants
- Prosthetics
- Wearable Devices
- Other Applications
- By Material
- Metals and Alloys
- Polymers
- Other Materials
- Geography
- China
- Japan
- India
- Australia
- South Korea
- Rest of Asia-Pacific
Data Sources, Market Sizing, and Validation
Desk Research
Desk work starts with building a clean fact base on healthcare activity and additive manufacturing readiness across Asia Pacific, and then mapping where demand is most likely to convert into spend. We rely on public sources such as national health ministries and national statistics offices, the World Health Organization, the World Bank, UN Comtrade trade data, and the World Intellectual Property Organization for patent direction, which helps anchor country-level adoption signals.
From there, we use company filings, investor decks, and credible press coverage to understand product availability, channel approaches, and the pace of hospital and lab adoption. A paid subscription for company financials and intelligence is used to cross-check disclosed revenue hints, and a patent database subscription is used to sanity-check technology momentum by material and process. These examples are illustrative, and they are not exhaustive because many other public documents were also reviewed to collect, validate, and clarify the final assumptions.
Primary Interviews and Surveys
Primary work is used to turn the desk assumptions into numbers that reflect how purchasing actually happens in hospitals, dental labs, and medical device production across Asia Pacific. We speak with manufacturers, distributors, service bureaus, and clinical end users to verify adoption timing, typical order sizes, and how much of the spending is recurring (materials and services) versus one-time (systems).
Respondent input is also used to confirm practical price ranges, utilization levels, and which applications are scaling fastest, and then we fold these views back into the model to correct for any over-counting or missing demand pockets.
Distribution of primary research fieldwork respondents
| Company type | Respondent position |
|---|---|
| Top tier: 30% | CXOs: 12% |
| Mid tier: 54% | Functional/Unit leaders: 34% |
| Smaller Players: 16% | Managers: 54% |
Market-Sizing & Forecasting
Sizing is built using a top-down and bottom-up approach, but it is led by a demand pool build that starts from country healthcare activity and converts it into 3D printing spend through penetration and usage assumptions. In practice, we estimate the addressable clinical and lab volumes, apply adoption rates by major application areas, and then translate output into value using typical price bands for printers, materials, and services.
To keep the model grounded, we track inputs such as procedure volumes that drive implants and surgical planning, dental lab throughput for aligners and prosthetics, installed base and utilization patterns for printers in healthcare settings, material mix shifts between polymers and metals, and average selling price movement by technology type. Once the initial totals are produced, selective bottom-up checks are run using supplier roll-ups, sampled ASP times volume calculations, and channel checks to ensure the result does not drift away from what market participants see.
For forecasting, scenario analysis is applied because adoption can shift with regulation, reimbursement, and hospital capex cycles, and then the scenario weights are tuned using expert views gathered in interviews. Where bottom-up information is thin for smaller markets, we handle gaps by using comparable country ratios, then re-validating those ratios with regional distributors and service providers.
Data Validation & Update Cycle
Before finalizing results, we compare the model outputs against independent signals, such as trade flows of relevant materials and equipment, patent direction, and public indicators of hospital and lab investment across Asia Pacific. Any sharp jumps are reviewed, and the assumptions that caused them are re-checked with follow-up questions so the final series looks realistic year to year.
A multi-step review is followed so that calculation logic, unit consistency, and currency conversions are checked before sign-off. Reports are refreshed annually, and interim updates are made when a material event changes demand or pricing. Right before delivery, a final pass is done so clients receive the latest updated view.
Mordor Intelligence's Asia Pacific Healthcare 3d Printing Market Market Size Compared Against Other Published Estimates
It is common to see different market size numbers for healthcare 3D printing in Asia Pacific because publishers do not count the same revenue items, and they also apply different timing for currency conversion and inflation treatment. Differences can also come from how much of the value chain is counted, especially when services, materials, and adjacent medical device revenue get blended.
Some external estimates appear to include a broader pool of medtech production and general additive manufacturing activity, which can inflate totals when industrial use is mixed into healthcare. For Mordor Intelligence, the count is limited to healthcare-directed 3D printing spend in the region, and the totals are cross-checked with utilization, application adoption, and realistic ASP steps by technology so the final value stays tied to an explainable demand pool.
Benchmark comparison
| Source | Market Size | Gaps in Research Methodology |
|---|---|---|
| Mordor Intelligence | USD 0.56 B (2024) | |
| Trade Publisher A | USD 0.24 B (2024) | This estimate looks narrower because it emphasizes selected healthcare use cases and tends to undercount recurring revenue from materials and printing services, which lowers the total even if system shipments are captured. |
| Global Consultancy B | USD 0.56 B (2024) | This figure aligns on the year but can diverge across forecast years because the growth path is often set using a single CAGR assumption and broader component definitions, with less visible adjustment for utilization and ASP movement by technology type. |
The comparison shows that the main spread usually comes from what gets counted as healthcare 3D printing revenue, and whether recurring materials and service spend is fully captured. By keeping the model tied to adoption and usage indicators, and then confirming those inputs through interviews, the resulting number stays traceable and repeatable for decision making.


Key Questions Answered in the Report
What is the current Asia-Pacific Healthcare 3D Printing Market size?
The Asia-Pacific Healthcare 3D Printing Market is projected to register a CAGR of 17.35% during the forecast period (2026-2031)
Who are the key players in Asia-Pacific Healthcare 3D Printing Market?
3D Systems Inc, EnvisionTEC GMBH, General Electric, Imaginarium and Materialise N.V. are the major companies operating in the Asia-Pacific Healthcare 3D Printing Market.
What years does this Asia-Pacific Healthcare 3D Printing Market cover?
The report covers the Asia-Pacific Healthcare 3D Printing Market historical market size for years: 2020, 2021, 2022, 2023, 2024 and 2025. The report also forecasts the Asia-Pacific Healthcare 3D Printing Market size for years: 2026, 2027, 2028, 2029, 2030 and 2031.
Page last updated on:





