1,4 Butanediol Market Size and Share
Market Overview
| Study Period | 2021 - 2031 |
|---|---|
| Market Volume (2026) | 2.66 Million tons |
| Market Volume (2031) | 3.18 Million tons |
| Growth Rate (2026 - 2031) | 3.64% CAGR |
| Fastest Growing Market | Asia Pacific |
| Largest Market | Asia Pacific |
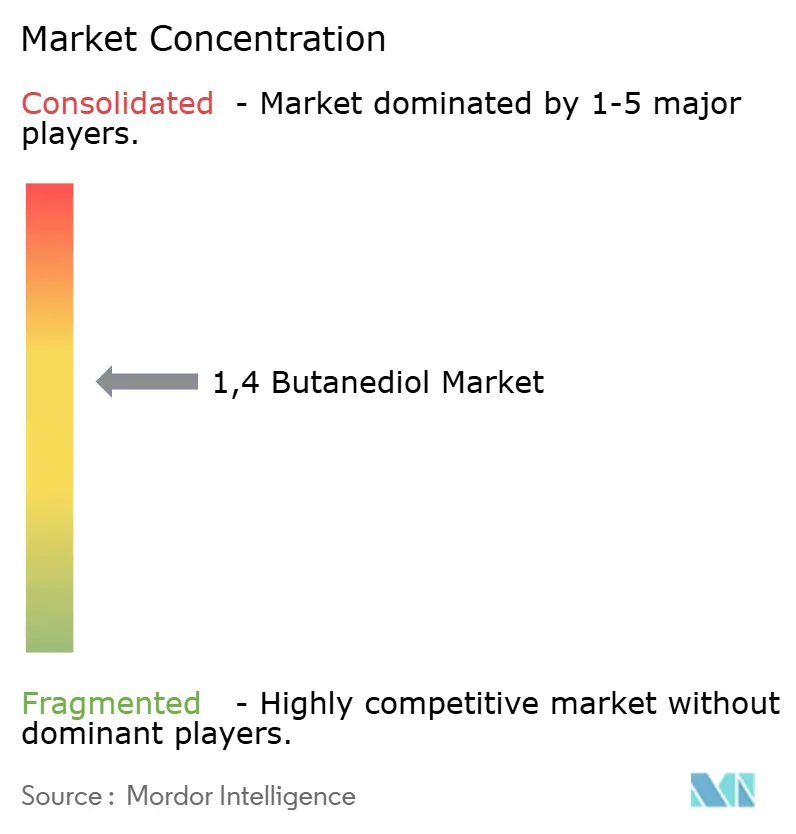
| Market Concentration | Medium |
Major Players *Disclaimer: Major Players sorted in no particular order Image © Mordor Intelligence. Reuse requires attribution under CC BY 4.0. | |

1,4 Butanediol Market Analysis by Mordor Intelligence
The 1,4 Butanediol Market size is estimated at 2.66 million tons in 2026, and is expected to reach 3.18 million tons by 2031, at a CAGR of 3.64% during the forecast period (2026-2031). This overall pace masks a structural pivot toward lower-carbon production routes, notably bio-fermentation, which is scaling at 7.52% per year as European and North American carbon-pricing regimes add USD 50 to USD 100 per ton to the delivered cost of coal-derived volumes. The shift is already reshaping supplier hierarchies: Hyosung brought its first 50,000-ton bio-BDO train online in Vietnam during 2026, while BASF commissioned commercial bio-BDO in Germany a year earlier. Tetrahydrofuran (THF) kept a 52.65% derivative share in 2025, anchored by spandex feedstock demand, yet polybutylene terephthalate (PBT) is expanding faster at 3.79% CAGR as electric vehicles and 5 G infrastructure require flame-retardant, high-voltage insulation. Asia-Pacific remains the production epicenter with 76.12% of volume, but the European Union’s Carbon Border Adjustment Mechanism (CBAM) penalizes carbon-intensive Chinese exports, tilting trade flows toward bio-routes.
Key Report Takeaways
- By production process, the Reppe process held 50.18% of global output in 2025; bio-fermentation is forecast to grow at a 7.52% CAGR to 2031.
- By derivative, Tetrahydrofuran (THF) led with a 52.65% share in 2025; Polybutylene Terephthalate (PBT) is advancing at a 3.79% CAGR through 2031.
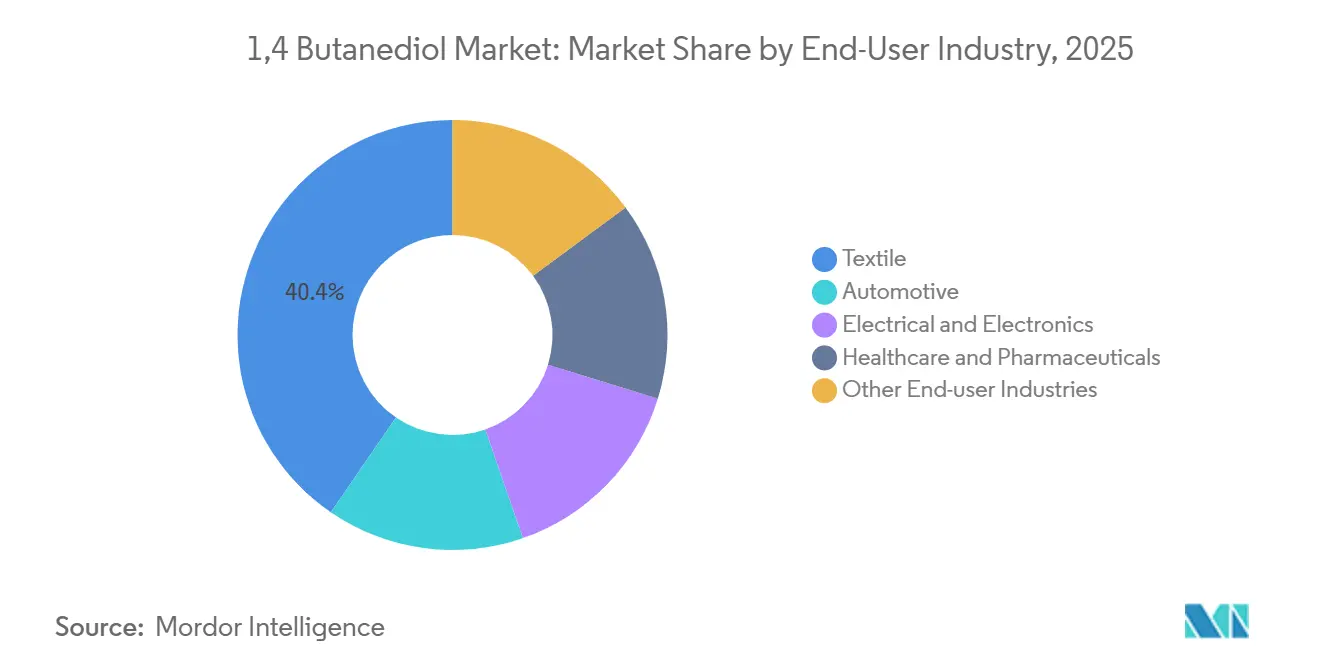
- By end-user industry, textiles accounted for 40.41% share of the 1,4 butanediol market size in 2025, while electrical and electronics is the fastest-growing segment at 4.19% CAGR.
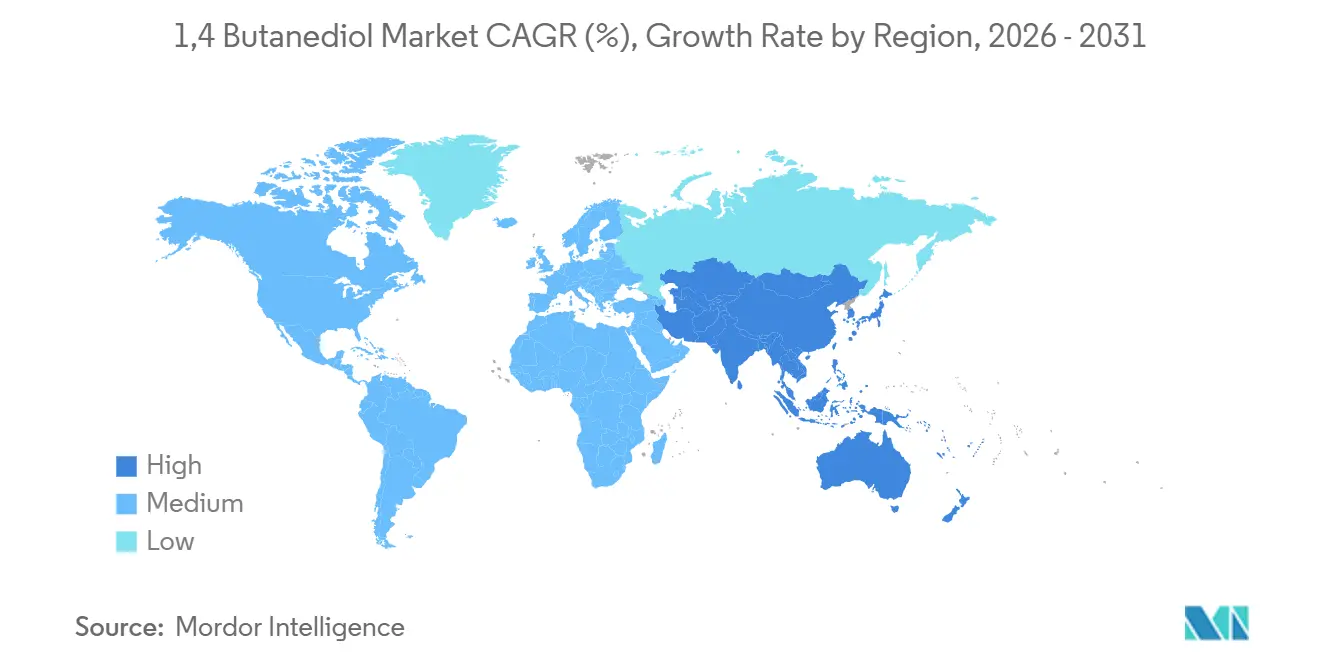
- By geography, Asia-Pacific commanded 76.12% of the 1,4 butanediol market share in 2025, and is projected to expand at a 3.94% CAGR through 2031.
Note: Market size and forecast figures in this report are generated using Mordor Intelligence’s proprietary estimation framework, updated with the latest available data and insights as of January 2026.
Global 1,4 Butanediol Market Trends and Insights
Drivers Impact Analysis*
| Driver | (~) % Impact on CAGR Forecast | Geographic Relevance | Impact Timeline |
|---|---|---|---|
| Rising demand for THF and spandex fibers | +0.9% | Global, concentrated in Asia-Pacific textile hubs | Medium term (2–4 years) |
| Light-weighting of EV connectors spurring PBT uptake | +0.7% | North America, Europe, China EV corridors | Short term (≤ 2 years) |
| Expansion of polyurethane applications | +0.6% | Global, led by automotive and construction sectors | Medium term (2–4 years) |
| Government subsidies for bio-BDO capacity | +0.5% | North America, Europe | Long term (≥ 4 years) |
| Cost-advantaged coal-to-acetylene integrations in inland China | +0.4% | China (Xinjiang, Shanxi, Inner Mongolia) | Short term (≤ 2 years) |
| Source: Mordor Intelligence | |||


Rising Demand for THF and Spandex Fibers
Tetrahydrofuran remains the gateway molecule to polytetramethylene ether glycol, the soft segment in spandex. BASF operates five PolyTHF plants worldwide and reported double-digit volume growth in Asia-Pacific technical-textile grades during 2025[1]BASF SE, “PolyTHF Market Update 2025,” basf.com. Hyosung integrated bio-BDO into its regen BIO spandex, launched in 2025, and is realizing 10-15% price premiums in European and North American apparel markets. Apparel restocking cycles normalize faster than durable-goods demand, giving THF a buffer against macro shocks. Beyond textiles, PTMEG grades flow into thermoplastic polyurethane (TPU) used in medical tubing and automotive interior films, broadening the demand base.
Light-Weighting of EV Connectors Spurring PBT Uptake
High-voltage electric-vehicle platforms require connector housings with flame-retardant, hydrolysis-resistant, and dimensional stability. PBT synthesized from BDO meets these criteria and is displacing PA 6,6 in 400-800 V architectures. BASF’s Ultradur grades passed UL 94 V-0 testing and secured design wins at several European and Chinese OEMs in 2025. Rising 5 G base-station installations and data-center construction intensify PBT demand for high-temperature circuit-breaker housings, reinforcing its 3.79% CAGR outlook.
Expansion of Polyurethane Applications
BDO-based TPU delivers superior hydrolysis resistance compared with alternative diols, making it the preferred chain extender for fuel lines, hydraulic hoses, and EV wiring insulation. Medical-device manufacturers increasingly specify BDO-TPU for catheter tubing and wound-care films due to its biocompatibility profile. Application diversification reduces reliance on a single end-market and supports steady volumetric growth.
Government Subsidies for Bio-BDO Capacity
The US Inflation Reduction Act provides a USD 1.00 per kg production tax credit for bio-based chemicals that deliver at least 25% lower life-cycle emissions[2]U.S. Department of Energy, “Bioenergy Technologies Office 2025 Funding Awards,” energy.gov. The Department of Energy allotted USD 12 million in 2025 to de-risk fermentation scale-ups. Europe’s Bioeconomy Strategic Framework, updated in 2025, coupled with European Investment Bank soft loans, channels EUR 500 million into bio-chemical projects. Qore leveraged these incentives to lock in long-term offtake with BASF, allowing bio-routes to undercut Asian imports on a delivered-cost basis.
Restraints Impact Analysis*
| Restraint | (~) % Impact on CAGR Forecast | Geographic Relevance | Impact Timeline |
|---|---|---|---|
| Occupational health and safety concerns | -0.3% | Global, stringent in EU and North America | Medium term (2–4 years) |
| Volatile feedstock prices | -0.5% | Global, acute in Asia-Pacific and Middle East | Short term (≤ 2 years) |
| Carbon-border taxes raising cost of coal-based BDO exports | -0.4% | China exports to EU, potential U.S. extension | Medium term (2–4 years) |
| Source: Mordor Intelligence | |||
Occupational Health and Safety Concerns
1,4 Butanediol is an eye, skin, and respiratory irritant, and prolonged exposure depresses the central nervous system. The European Chemicals Agency and ACGIH enforce exposure thresholds, prompting investments in closed-loop transfer systems and vapor recovery. Compliance can add USD 50 to USD 100 per ton to operating costs, favoring well-capitalized producers. Several Xinjiang and Shanxi plants halted operations in 2024-2025 for ventilation retrofits, temporarily tightening regional supply.
Volatile Feedstock Prices
Acetylene tracks coal and electricity costs in inland China, fluctuating widely with seasonal supply constraints. Butadiene spot prices varied from USD 800 to USD 1,400 per ton during 2024 as crackers optimized ethylene margins. Propylene oxide used in the Davy route mirrors refinery turnaround cycles. Such volatility compresses BDO margins because derivative contracts often reset on a quarterly lag.
*Our forecasts treat driver/restraint impacts as directional, not additive. The impact forecasts reflect baseline growth, mix effects, and variable interactions.
Segment Analysis
By Production Process: Bio-Fermentation Gains Ground on Reppe Dominance
Reppe acetylene chemistry retained 50.18% of total output in 2025, reflecting decades of brownfield infrastructure. The installed base ensures that the 1,4 Butanediol market size tied to Reppe plants remains substantial through 2031. Even so, bio-fermentation grows 7.52% annually, propelled by carbon incentives that tilt project economics away from coal feedstocks. Genomatica’s GENO technology underpins BASF’s Verbund output and Hyosung’s Vietnam complex, proving that fermentation can scale to 50,000-ton trains with 90% lower life-cycle emissions. Propylene-oxide and butadiene routes stay niche because of higher variable costs and limited license holders.
Process economics now hinge on carbon accounting. Europe’s forthcoming Industrial Emissions Directive revision tightens VOC limits on acetylene plants, lifting compliance costs, while bio-routes sidestep acetylene-handling hazards. China’s 2060 carbon-neutrality pledge pressures regional authorities to curb coal-to-acetylene expansions, gradually eroding Reppe's share despite its entrenched footprint.


By Derivative: THF Still Leads, PBT Accelerates
Tetrahydrofuran (THF) commanded 52.65% derivative share in 2025, anchored by its conversion to polytetramethylene ether glycol for spandex and thermoplastic polyurethane elastomers. BASF's five global PolyTHF plants and Hyosung's integrated bio-BDO-to-PTMEG-to-spandex value chain underscore THF's entrenched position in textile supply chains. Yet polybutylene terephthalate is expanding at 3.79% CAGR through 2031, the fastest among all derivatives, as electric-vehicle connector lightweighting and 5G infrastructure rollouts drive demand for flame-retardant, high-voltage insulation materials. PBT's higher selling price, typically USD 2,500 to USD 3,500 per ton versus USD 1,800 to USD 2,200 for THF, translates to superior margins for producers who can secure automotive and electronics design wins.
Commodity THF margins compressed when BDO prices doubled from 2018-2024, whereas PBT suppliers held escalator clauses. As a result, producers increasingly direct new capacity toward PBT and TPU grades to lift overall earnings quality. Gamma-butyrolactone and pharmaceutical intermediates remain niche but offer price stability for high-purity grades.
By End-User Industry: Textiles Remain Largest, Electronics Fastest
Textile applications held 40.41% end-user share in 2025, reflecting spandex's ubiquity in activewear, intimate apparel, and technical fabrics. However, electrical and electronics is the fastest-growing end-user segment at 4.19% CAGR through 2031, driven by PBT adoption in EV connectors, 5G base-station components, and semiconductor packaging. Automotive end-users, while smaller in absolute volume, are expanding rapidly as electric-vehicle architectures demand high-voltage connectors, battery enclosures, and cable insulation that meet stringent flame-retardancy and hydrolysis-resistance standards.
The textile sector's maturity and geographic concentration in Asia-Pacific create cyclical exposure: apparel restocking and inventory adjustments can swing THF demand. In contrast, automotive and electronics applications exhibit longer design-in cycles (18 to 24 months) and multi-year supply contracts, smoothing demand volatility but requiring upfront qualification investments.
Geography Analysis
Asia-Pacific accounted for 76.12% of global volume in 2025 and is set to grow at a 3.94% CAGR through 2031. China’s coal-to-acetylene clusters in Xinjiang, Shanxi, and Inner Mongolia supply most regional needs but face tightening energy-intensity and safety audits, creating intermittent outages. Hyosung’s USD 1 billion Vietnam complex marks Southeast Asia’s entry into premium low-carbon supply and will eventually relieve Chinese export dominance. India’s demand is climbing at double digits on the back of textile and automotive expansions, but lacks domestic capacity, relying on Korean and Middle-East imports.
North America and Europe, both regions, advance bio-BDO capacity to hedge CBAM penalties and Scope 3 targets. BASF, Qore, and Novamont collectively added more than 100,000 tpa of fermentation output between 2024 and 2026. Local demand tilts toward high-value TPU, PBT, and pharmaceutical intermediates, giving producers a margin buffer against feedstock volatility.
Saudi Arabia’s Sipchem operates a 50,000 tpa unit integrated with low-cost ethane, targeting polyurethane and solvent markets. Brazil drives South American consumption across automotive and textile channels, yet logistical and currency hurdles slow new investment. Africa’s demand is nascent, centered in South African polyurethane coatings, but infrastructure gaps remain a hurdle.

Competitive Landscape
The 1,4 Butanediol market is moderately concentrated. Western players hedge carbon risk through technology licensing. Genomatica licenses its platform to multiple majors, compressing time-to-market but commoditizing bio-routes. White-space opportunities exist in pharmaceutical-grade BDO with sub-ppm impurity specifications, and in circular depolymerization of PBT scrap back to BDO. Ongoing EU anti-dumping cases against Chinese, US, and Saudi volumes spur plans for regional plants, raising the probability of mergers or joint ventures to secure market access.
1,4 Butanediol Industry Leaders
LyondellBasell Industries Holdings B.V.
DCC
Chang Chun Group
BASF
Markor Chemicals
- *Disclaimer: Major Players sorted in no particular order

Recent Industry Developments
- October 2025: Genomatica, Inc. started operations at its newly inaugurated plant in Eddyville, Iowa. This facility, touted as the world's largest, specializes in producing GENO Bio-BDO (1,4-butanediol). Leveraging Geno's proprietary biocatalyst and process technology, the plant converts US-grown, plant-based sugars into 1,4-butanediol (BDO) through a streamlined single-step fermentation process.
- June 2025: The European Commission, acting on a complaint from INEOS Solvents SA, launched an anti-dumping probe into imports of 1,4-butanediol (BDO) from China, Saudi Arabia, and the US.


Research Methodology Framework and Report Scope
Market Definitions and Key Coverage
Our study defines the 1,4-butanediol market as all merchant-grade and captive volumes of 1,4-butanediol (BDO) sold or consumed worldwide, regardless of production route, for use in downstream derivatives such as tetrahydrofuran, polybutylene terephthalate, γ-butyrolactone, and polyurethane.
Scope exclusion: Other butanediol isomers (1,3-BDO, 2,3-BDO) and internal transfer pricing inside fully integrated sites are not counted.
Segmentation Overview
- By Production Process
- Reppe Process
- Davy Process
- Butadiene-Based Process
- Propylene Oxide-Based Process
- Bio-fermentation Route
- By Derivative
- Tetrahydrofuran (THF)
- Polybutylene Terephthalate (PBT)
- Gamma-Butyrolactone (GBL)
- Polyurethane (PU)
- Other Derivatives
- By End-user Industry
- Automotive
- Textile
- Electrical and Electronics
- Healthcare and Pharmaceuticals
- Other End-user Industries
- By Geography
- Asia-Pacific
- China
- India
- Japan
- South Korea
- ASEAN Countries
- Rest of Asia-Pacific
- North America
- United States
- Canada
- Mexico
- Europe
- Germany
- United Kingdom
- France
- Italy
- NORDIC Countries
- Rest of Europe
- South America
- Brazil
- Argentina
- Rest of South America
- Middle East and Africa
- Saudi Arabia
- South Africa
- Rest of Middle East and Africa
- Asia-Pacific
Detailed Research Methodology and Data Validation
Primary Research
Mordor analysts interviewed procurement heads at spandex fiber mills in China, resin compounders in Europe, and distribution partners in North America. These discussions helped us validate average contract prices, derivative split ratios, and regional demand swings that desk sources only hint at.
Desk Research
We began with trade-code filtered customs data from UN Comtrade, China Customs, and USITC, which show cross-border BDO tonnage and average export prices. Those flows were matched with production statistics from organizations such as the American Chemistry Council and the National Bureau of Statistics of China. Cost curves, plant capacities, and shutdown dates were pulled from industry journals like ICIS Chemical Business, while patent trends around bio-fermentation routes were reviewed in Questel. Financial filings, press releases, and investor decks of leading producers were downloaded through D&B Hoovers and Dow Jones Factiva to benchmark derivative uptake in textiles, automotive plastics, and solvents. Many other secondary sources were consulted for clarification and cross-checks, though they are not exhaustively listed here.
Market-Sizing & Forecasting
A top-down reconstruction starts with global BDO output, derived from plant nameplate capacity, typical utilization, and net trade balances. This is then corroborated through selective bottom-up checks on sampled supplier volumes and channel price sheets. Variables such as spandex yarn production, PBT molding-compound output, announced capacity additions, average quarterly BDO contract price, and bio-BDO penetration were fed into a multivariate regression and ARIMA overlay to project demand. Bottom-up gaps, especially for captive consumption, were bridged using respondent-verified conversion ratios.
Data Validation & Update Cycle
Before sign-off, results pass a multi-step peer review where outliers versus historical series or trade statistics trigger re-contacts. The model is refreshed annually, and interim revisions are issued when major capacity, regulatory, or price shocks occur. Clients therefore receive the latest vetted view.
Why Mordor's 1,4 Butanediol Baseline Stands Resilient
Published estimates often diverge because firms choose different functional scopes, price bases, and refresh cadences, which creates confusion for decision-makers.
Key gap drivers include whether captive volumes are counted, if bio-based output is modeled with separate elasticities, and how rapidly analysts escalate average selling prices. Our team reports a balanced base case, while other publishers sometimes apply aggressive price inflation or exclude smaller Asian plants, leading to sizable spread.
Benchmark comparison
| Market Size | Anonymized source | Primary gap driver |
|---|---|---|
| USD 7.68 billion (2024) | Mordor Intelligence | |
| USD 7.68 billion (2024) | Global Consultancy A | counts only merchant sales; assumes uniform 3 % annual price rise |
| USD 7.8 billion (2024) | Global Consultancy B | excludes bio-BDO; uses higher synthetic-to-bio price premium |
| USD 8.1 billion (2024) | Industry Analysis C | aggregates BDO isomers; projects derivative demand with optimistic spandex growth |
In short, Mordor Intelligence anchors its baseline on verified production and trade signals, applies transparent price-volume logic, and revisits every assumption yearly, giving stakeholders a dependable, reproducible starting point for strategy.


Key Questions Answered in the Report
How large is the 1,4 Butanediol market in 2026 and what is its growth rate?
How large is the 1,4 Butanediol market in 2026 and what is its growth rate?
Which derivative currently dominates consumption?
Which derivative currently dominates consumption?
Why is bio-fermentation gaining popularity in BDO production?
Why is bio-fermentation gaining popularity in BDO production?
Which end-user segment is growing fastest?
Which end-user segment is growing fastest?
How will the EU anti-dumping probe affect global trade flows?
How will the EU anti-dumping probe affect global trade flows?
Page last updated on:


