Butane Market Size and Share
Market Overview
| Study Period | 2021 - 2031 |
|---|---|
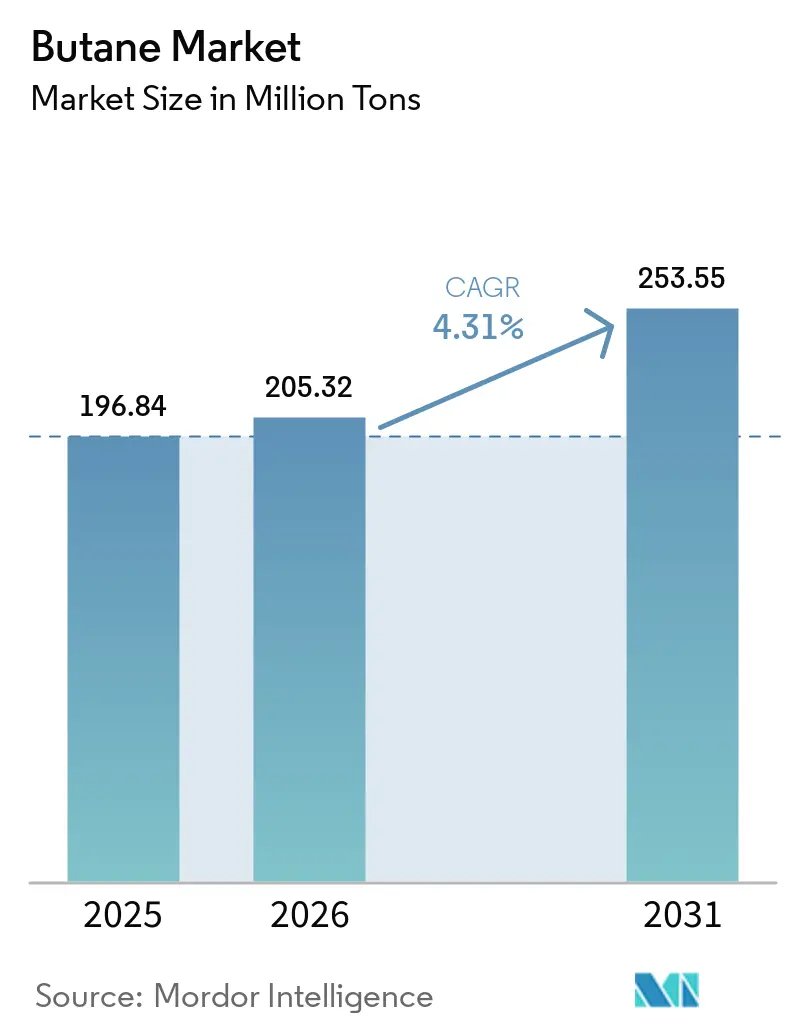
| Market Volume (2026) | 205.32 Million tons |
| Market Volume (2031) | 253.55 Million tons |
| Growth Rate (2026 - 2031) | 4.31% CAGR |
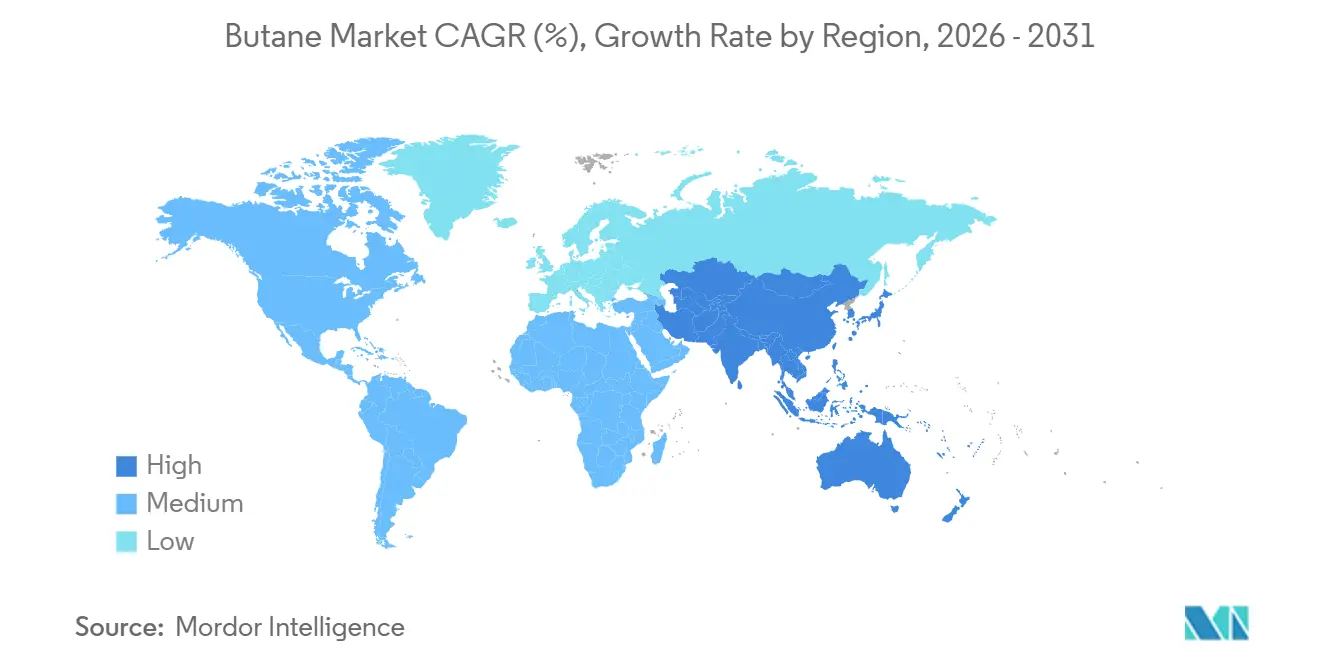
| Fastest Growing Market | Asia Pacific |
| Largest Market | Asia Pacific |
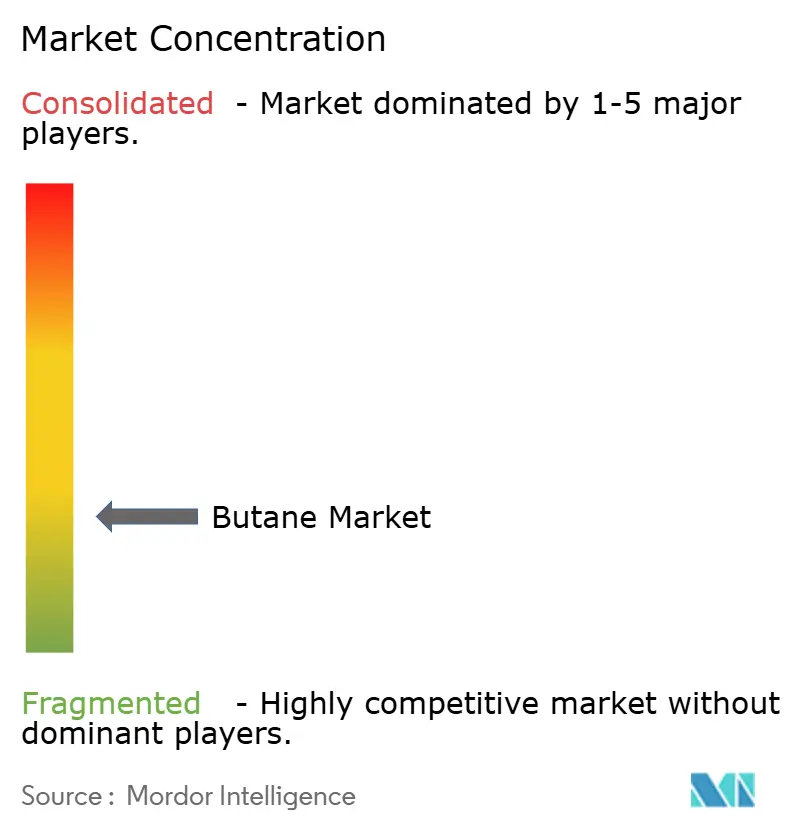
| Market Concentration | Low |
Major Players *Disclaimer: Major Players sorted in no particular order Image © Mordor Intelligence. Reuse requires attribution under CC BY 4.0. | |
Butane Market Analysis by Mordor Intelligence
The Butane Market size is projected to expand from 196.84 Million tons in 2025 and 205.32 Million tons in 2026 to 253.55 Million tons by 2031, registering a CAGR of 4.31% between 2026 to 2031. Growth reflects a decisive shift from routine LPG blending toward feedstock arbitrage in Asia-Pacific steam crackers and rapidly expanding autogas programs in emission-constrained urban fleets. Competitive exports of low-cost shale-derived butane from the United States continue to redefine global price benchmarks, prompting Middle Eastern producers to channel more volumes into captive petrochemical complexes instead of spot sales. Demand also remains split between rising LPG adoption for clean cooking in emerging economies and plateauing residential consumption in electrifying developed markets, creating a nuanced volume outlook that resists simple linear forecasts. At the same time, technology-led efficiencies—including digital-twin optimization of storage and blending—are narrowing logistics costs, reinforcing profitability for scale players that can act on real-time arbitrage signals.
Key Report Takeaways
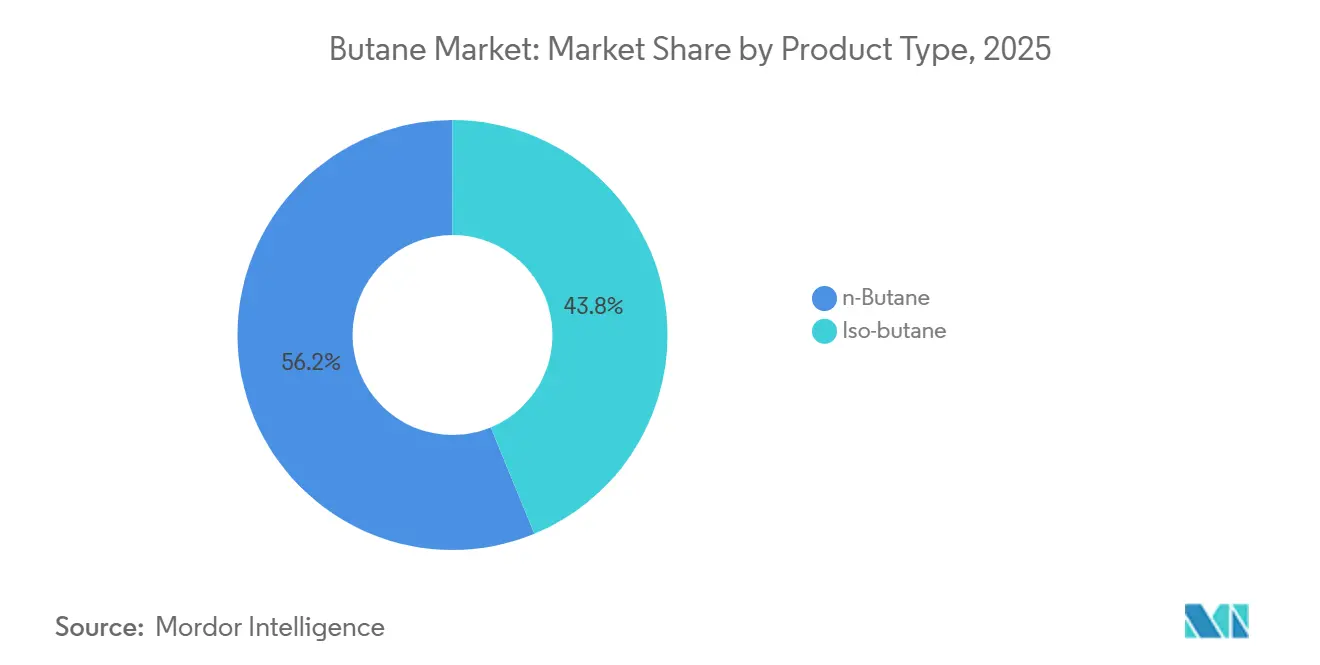
- By product type, n-butane held 56.23% of the butane market share in 2025 and is forecast to post the fastest 4.97% CAGR through 2031, while iso-butane expands more slowly.
- By source, natural-gas processing accounted for 61.22% of the butane market size in 2025 and is projected to grow at a 5.22% CAGR, outpacing refinery-derived supply.
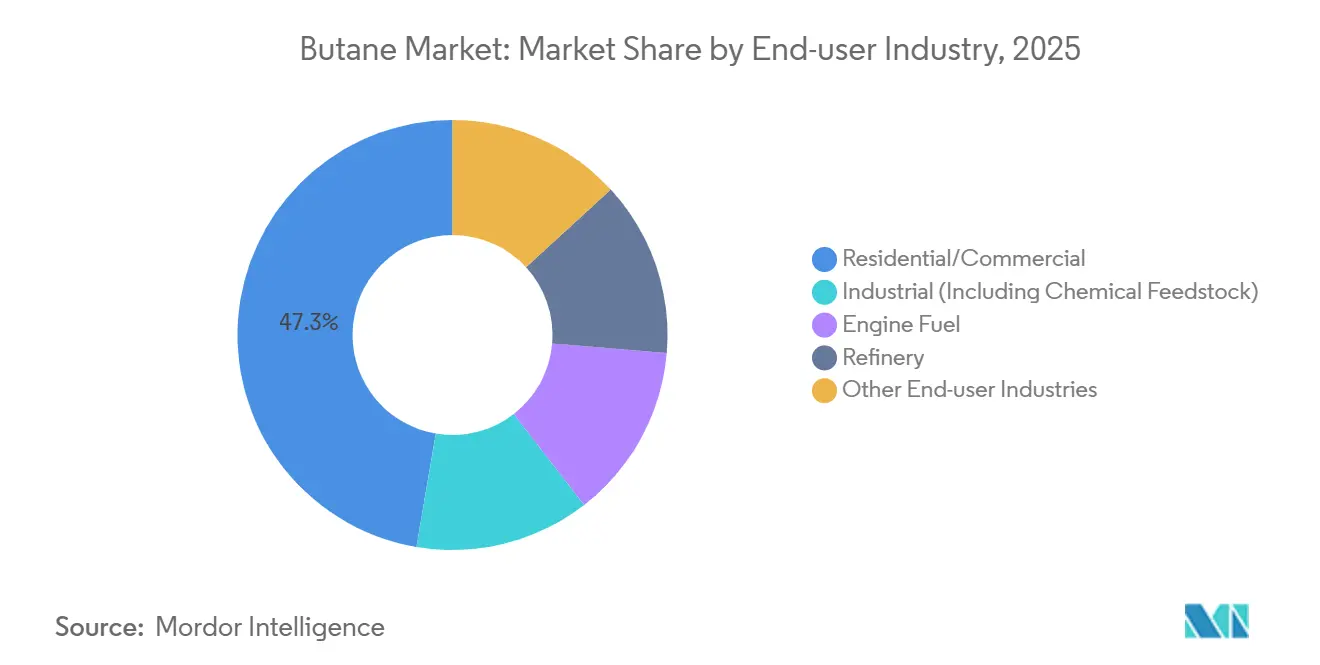
- By end-user industry, residential and commercial accounted for 47.34% of the butane market size in 2025, while engine fuel is projected to grow at a 5.14% CAGR through 2031.
- By geography, Asia-Pacific commanded 54.26% of global volume in 2025 and is forecast to advance at a 5.33% CAGR through 2031, driven by China’s appetite for n-butane feedstock and India’s LPG-cylinder rollout.
Note: Market size and forecast figures in this report are generated using Mordor Intelligence’s proprietary estimation framework, updated with the latest available data and insights as of January 2026.
Global Butane Market Trends and Insights
Driver Impact Analysis*
| Drivers | (~) % Impact on CAGR Forecast | Geographic Relevance | Impact Timeline |
|---|---|---|---|
| Surging LPG uptake for clean cooking and heating | +0.8% | Sub-Saharan Africa, South Asia, Southeast Asia | Medium term (2-4 years) |
| Expanding petrochemical demand (C4 cracking, alkylates) | +0.7% | Asia-Pacific, Middle East, North America Gulf Coast | Long term (≥ 4 years) |
| Autogas adoption in emission-constrained fleets | +0.6% | Europe, South Korea, select urban zones in China and India | Short term (≤ 2 years) |
| U.S. export surge reshaping global price benchmarks | +0.5% | Global, with strongest effect on Asia-Pacific and Middle East pricing | Medium term (2-4 years) |
| Digital-twin optimisation of LPG storage logistics | +0.7% | North America, Europe and Asia-Pacific | Long term (≥ 4 years) |
| Source: Mordor Intelligence | |||
Surging LPG Uptake for Clean Cooking and Heating
LPG outpaced electric and biogas alternatives between 2020 and 2025 by covering 75% of new clean-cooking access in sub-Saharan Africa. Government programs such as India’s Pradhan Mantri Ujjwala Yojana issued more than 100 million LPG connections by 2024, embedding butane–propane blends into previously biomass-dependent households. International forecasts indicate residential LPG demand could reach 3.4 million barrels per day by 2040 under accelerated-access scenarios[1]International Renewable Energy Agency, “Global LPG Access Pathways,” irena.org. However, refill rates remain under four cylinders per household each year in many rural districts, underscoring the importance of solving high last-mile distribution costs that at times exceed the fuel’s own value. These mixed signals suggest that continued policy support and infrastructure build-out are essential to converting initial access into sustained volume growth for the butane market.
Expanding Petrochemical Demand (C4 Cracking, Alkylates)
Global petrochemical feedstock use of LPG and naphtha rose from 14 million barrels per day in 2023 to an estimated 15.2 million barrels per day in 2025. n-Butane acts as a swing feedstock for steam crackers when naphtha prices jump, while iso-butane feeds alkylation units that secure high-octane gasoline blendstocks. Tightening balances have emerged as Chinese propane dehydrogenation projects slowed, lifting regional butane premiums. European players followed suit, with Borealis commissioning a 30,000-barrel-per-day LPG-based dehydrogenation unit in Belgium in 2024, an example of hedging against naphtha volatility. The collective outcome is a more durable demand base that decouples petrochemical margins from crude-oil price swings, cementing a long-run uplift for the butane market.
Autogas Adoption in Emission-Constrained Fleets
Roughly 11 million vehicles ran on autogas in 2025, led by South Korea, Turkey, and Poland. Euro 7 regulations, effective from 2025, incentivize European operators to switch diesel vans to autogas, a lower-cost compliance route than battery-electric alternatives[2]European Commission, “Euro 7 Vehicle Emission Standards,” europa.eu . South Korea’s taxi sector achieved a 60% autogas conversion rate across 250,000 cabs by 2024, producing fuel savings near 35% versus gasoline. India’s National Green Tribunal mandates conversions for commercial fleets in Delhi and Mumbai, adding around 50,000 barrels per day of incremental LPG demand in 2025. Continued network expansion of refueling stations will determine whether autogas preserves its 5.14% growth outlook amid intensifying electric-vehicle competition.
U.S. Export Surge Reshaping Global Price Benchmarks
U.S. butane exports climbed to 500,000 barrels per day in 2024, with 41% bound for Asia and 36% for Africa. Gulf Coast cargoes priced USD 5 to USD 8 per barrel below Asia and Middle East benchmarks throughout 2025, pressuring rival producers to match discounts. Domestic output is expected to plateau near 1.28 million barrels per day through 2027, underwriting sustained export availability even as U.S. petrochemical demand climbs. As a result, American suppliers now act as effective price setters, compelling non-U.S. players either to integrate downstream or accept thinner margins.
Restraint Impact Analysis*
| Restraints | (~) % Impact on CAGR Forecast | Geographic Relevance | Impact Timeline |
|---|---|---|---|
| Crude-oil and NGL price volatility | -0.5% | Global, most acute in petrochemical-heavy Asia-Pacific and Middle East | Short term (≤ 2 years) |
| Electrification and alternative fuels substitution | -0.4% | India, Indonesia, select European markets | Medium term (2-4 years) |
| Chokepoint shipping disruptions (Red Sea, Panama) | -0.5% | United States, Europe, and Asia | Medium term (2-4 years) |
| Source: Mordor Intelligence | |||
Crude-Oil and NGL Price Volatility
Butane prices mirror crude benchmarks with a 0.7 to 0.9 correlation, meaning a USD 10 swing in Brent moves butane by USD 7 to USD 9. Intra-year quotes at Mont Belvieu ranged from USD 28 to USD 52 per barrel during 2024, forcing petrochemical buyers to hold 30-to-45-day inventories that raised working capital needs by up to 25%. Such turbulence limits appetite for long-term contracts, encouraging users to diversify toward naphtha or propane when butane premiums spike, marginally trimming growth prospects for the butane market.
Electrification and Alternative Fuels Substitution
Induction cooking in India and Indonesia now costs 14% to 37% less than LPG on a lifecycle basis when subsidies are included. India’s Bureau of Energy Efficiency launched an e-cooking program targeting 10 million stove installations by 2027, a shift that could displace up to 20,000 barrels per day of LPG demand. On the transport side, battery-electric vehicles achieved a lower total cost of ownership than autogas fleets in several European cities by 2025. Together, these developments signal that residential and vehicular LPG growth may flatten over the next decade, compelling suppliers to lean more heavily on petrochemical offtake for volume expansion.
*Our forecasts treat driver/restraint impacts as directional, not additive. The impact forecasts reflect baseline growth, mix effects, and variable interactions.
Segment Analysis
By Product Type: n-Butane Retains Blending and Cracker Leadership
n-Butane captured 56.23% of the 2025 volume, reflecting its dual role in residential LPG blends and as a steam-cracker feedstock for C4 olefins. The segment is forecast to grow at a 4.97% CAGR through 2031, reinforcing its position in the butane market. Iso-butane expands slowly due to limited new refinery alkylation projects and growing electric-vehicle penetration that erodes gasoline octane demand. The n-butane advantage is amplified when naphtha trades above USD 600 per ton, a threshold breached in 11 of the past 24 months, prompting Asian crackers to switch feedstock and pushing n-butane utilization rates to record levels.
n-Butane also benefits from niche uses in aerosol propellants and lighter fluids, adding around 2 million tons of stable annual demand that cushions the segment from petrochemical cyclicality. Meanwhile, iso-butane margins face pressure as U.S. refiners channel capital toward renewable diesel units that require less alkylate blendstock. The resulting product-type divergence shapes trade flows: Middle Eastern suppliers rich in iso-butane must price cargoes competitively against U.S. n-butane, whereas integrated players with flexible fractionation can tailor output to regional demand patterns, securing higher realizations and strengthening their footing in the butane market.


By Source: Natural-Gas Processing Drives Cost Advantage
Natural-gas processing supplied 61.22% of global butane in 2025 and is projected to advance at a 5.22% CAGR through 2031, outpacing refinery-based production. Abundant associated gas in the Permian Basin and Qatar’s North Field gives producers a 20% to 30% unit-cost edge over refinery recovery methods. The butane market size that stems from gas processing will therefore continue to widen as new fractionation trains debottleneck constraints in Texas and Ras Laffan. Refinery-derived supply faces structural constraints as European and North American refineries shut 1.2 million barrels per day of crude capacity between 2020 and 2025.
Quality differentials further accentuate the shift: gas-plant streams deliver 95%-plus purity n-butane suitable for petrochemical feedstock, while refinery off-gases often carry heavier hydrocarbons that limit high-spec usage. Petrochemical buyers reward the cleaner stream with a USD 3 to USD 5 per barrel premium, reinforcing the economic pull toward gas-derived supply. As a result, refinery operators are evaluating whether to invest in upgraded recovery units or exit the segment, a bifurcation that could reshape regional balances in the butane market.
By End-User Industry: Engine Fuel Gains Momentum as Residential Plateaus
Engine fuel is the fastest-growing end-user, advancing at 5.14% CAGR through 2031 on the back of autogas conversions in Europe and South Korea. This growth narrows but does not yet eclipse the 47.34% residential and commercial share logged in 2025. Petrochemical feedstock demand tracks regional cracker utilization rates, leveraging butane’s persistent discount to naphtha that averaged USD 100 per ton in 2025. In contrast, refinery alkylation use is slipping as renewable diesel output expands, trimming iso-butane offtake by up to 200,000 barrels per day between 2023 and 2025.
Developed markets show LPG penetration above 80% of households, signaling a maturity phase, while sub-Saharan Africa remains at 12% penetration in 2025, presenting room for catch-up if distribution hurdles are solved. These cross-currents mean suppliers must manage highly seasonal residential peaks against steadier petrochemical pull, maintaining inventory agility to capture margins. The evolving mix underscores that growth pockets in the butane market will favor mobility and petrochemical channels over traditional cooking segments in the medium term.

Geography Analysis
Asia-Pacific anchored 54.26% of global demand in 2025 and is on track to expand at 5.33% CAGR through 2031, driven by China’s petrochemical expansion and India’s continuing LPG-cylinder rollout. China imported 12 million tons in 2025, up 6% year on year, locking into multiyear contracts with U.S. and Middle Eastern suppliers to secure feedstock for propylene and butadiene output. India held 340 million active cylinder connections in 2025, yet rural refill rates remain low, reminding suppliers that infrastructure access alone does not guarantee consumption growth.
North America held a significant market share in 2025, and supplied roughly 60% of seaborne butane, supported by Enterprise Products Partners’ 400,000-barrel-per-day fractionation expansion at Mont Belvieu, completed in 2024. Regional consumption grows at a milder rate as residential saturation offsets petrochemical uptake. Europe faces a flat outlook, with electrification of home heating and stringent fuel-efficiency rules capping autogas upside. However, select clusters such as Spain and Poland still pursue autogas as a compliance tool, tempering the overall slowdown.
The Middle East and Africa display divergent trajectories. Saudi Arabia’s petrochemical integration absorbs incremental domestic NGL output, limiting export availability yet deepening local offtake. Conversely, sub-Saharan Africa’s policy push for clean cooking creates a sizable back-of-the-queue demand pool, though logistical costs and currency volatility remain hurdles. South American butane demand is led by Brazil’s autogas program that could lift regional consumption by 50,000 barrels per day by 2027. These regional snapshots confirm that freight economics and terminal capacity often dictate trade flows more than headline consumption figures in the butane market.

Competitive Landscape
The butane market features high fragmentation. ExxonMobil, Shell, and TotalEnergies leverage end-to-end ownership—from upstream NGL recovery to downstream petrochemical offtake—to lock in feedstock and optimize margins. Saudi Aramco and PETRONAS follow a similar model, blending associated-gas extraction with captive crackers that insulate them from spot volatility. Independent processors compete primarily on logistics efficiency and terminal access, leveraging nimble operations to serve fragmented buyers in Africa and Southeast Asia.
Technology adoption is sharpening competitive divides. Shell cut unplanned downtime by 18% at its Singapore terminal after deploying a digital-twin platform in 2024. ExxonMobil’s Baytown complex lowered maintenance spending by USD 12 million annually through predictive algorithms that extend equipment life. Patent trends in AI-driven inventory management point to execution speed becoming a decisive edge, reducing the traditional dominance of raw asset scale. Emerging disruptors are also visible: renewable-LPG start-ups captured under 1% of supply in 2025 but attracted USD 800 million in new funding, hinting that decarbonization mandates could upend today’s hierarchy by 2030.
While integrated majors still enjoy scale economics, smaller players that license digital platforms can narrow cost gaps, fostering a gradual move toward a more contestable market. Regional distributors exploiting asset-light cylinder delivery models show 15% to 20% lower capital intensity than incumbents, illustrating how business-model innovation can compete with vertical integration in targeted niches of the butane market.
Butane Industry Leaders
Saudi Arabian Oil Co.
Exxon Mobil Corporation
China Petrochemical Corporation
Shell
BP plc
- *Disclaimer: Major Players sorted in no particular order

Recent Industry Developments
- January 2026: QatarEnergy and TotalEnergies completed a USD 1.8 billion expansion of the Ras Laffan NGL complex, adding 70,000 barrels per day of butane capacity under decade-long supply contracts with Asian petrochemical buyers.
- November 2025: ExxonMobil finalized a USD 600 million upgrade at Beaumont, Texas, increasing iso-butane alkylation capacity by 15,000 barrels per day to meet renewable-diesel octane needs.


Research Methodology Framework and Report Scope
Market Definitions and Key Coverage
Our study defines the global butane market as all bulk sales of n-butane and isobutane, quantified in million tons, that move from natural-gas processing plants or crude-oil refineries into end uses such as LPG blending, petrochemical feedstock, motor-fuel additives, and direct heating or cooking.
Scope exclusion: downstream chemicals derived from butane, portable cartridge gases, and specialty aerosol blends lie outside this assessment.
Segmentation Overview
- By Product Type
- n-Butane
- Iso-butane
- By Source
- Natural Gas
- Refining
- By End-user Industry
- Residential/Commercial
- Industrial (Including Chemical Feedstock)
- Engine Fuel
- Refinery
- Other End-user Industries
- By Geography
- Asia-Pacific
- China
- India
- Japan
- South Korea
- Rest of Asia-Pacific
- North America
- United States
- Canada
- Mexico
- Europe
- Germany
- United Kingdom
- France
- Italy
- Rest of Europe
- South America
- Brazil
- Argentina
- Rest of South America
- Middle-East and Africa
- Saudi Arabia
- South Africa
- Rest of Middle-East and Africa
- Asia-Pacific
Detailed Research Methodology and Data Validation
Primary Research
We interview refinery planners, LPG marketers, and petrochemical procurement leads across Asia-Pacific, North America, Europe, and the Middle East. The conversations confirm throughput assumptions, seasonal draw-down ratios, and average selling prices, while short surveys with distributors validate household penetration rates in emerging economies.
Desk Research
Mordor analysts begin with public datasets that anchor physical supply, such as the EIA International Energy Statistics, OPEC Annual Statistical Bulletin, UN Comtrade shipment codes 271112 and 271113, and IEA World Energy Balances. Trade association briefs from the World LPG Association, refinery yield data in Hydrocarbon Processing, and company 10-K filings enrich regional split-ups. Paid databases like D&B Hoovers and Dow Jones Factiva help verify producer capacities, contract awards, and price spreads in real time.
These tier-one sources map production, imports, and demand pools before any modeling starts. Many additional documents are screened to cross-check anomalies and clarify definitions, although they are not exhaustively listed here.
Market-Sizing & Forecasting
A top-down supply reconstruction converts country-level production and net trade into an apparent consumption baseline for 2025. Results are then challenged with selective bottom-up markers, sampled refinery butane yields, LPG retail volumes, and average spot prices to tighten totals. Key variables injected into the model include NGL output growth, refinery utilization, LPG subsidy programs, petrochemical capacity additions, currency adjusted ASPs, and winter-summer demand coefficients. A multivariate regression is applied to forecast volumes through 2030, and scenario analysis fills data gaps where bottom-up samples are thin.
Data Validation & Update Cycle
Outputs pass a two-layer peer review, variance checks against independent price and flow indicators, and a senior analyst sign-off. Reports refresh annually, with mid-cycle updates triggered by material policy shifts or supply disruptions.
Why Our Butane Baseline Commands Reliability
Published estimates often differ because firms mix value and volume metrics, include derivatives, or lock forecasts to dated exchange rates.
Key gap drivers here are mixed scope definitions, varied refresh cadence, and distinct ASP progression methods that tilt revenue-based models upward or downward relative to Mordor's physically grounded approach.
Benchmark comparison
| Market Size | Anonymized source | Primary gap driver |
|---|---|---|
| 204.82 million tons (2025) | Mordor Intelligence | - |
| USD 112.9 billion (2023) | Global Consultancy A | Uses revenue not tonnage and omits autogas demand |
| USD 94.0 billion (2024) | Trade Journal B | Blends butane derivatives and applies average 2024 crude price without quarterly resets |
| USD 83.54 billion (2025) | Industry Association C | Aggregates commercial, medical, and technical purity grades, creating a wider scope |
These comparisons show that when scope, units, and update cadence vary, headline figures swing widely. By centering on physical flows, aligning variables to verified plant data, and refreshing every year, Mordor Intelligence offers decision-makers a balanced baseline they can trace and reproduce with confidence.


Key Questions Answered in the Report
How large is the butane market in 2026, and where is it heading?
The butane market size is estimated at 205.32 million tons in 2026 and is forecast to rise to 253.55 million tons by 2031, supported by a 4.31% CAGR.
What segment grows fastest within global demand?
Engine fuel leads growth, advancing at 5.14% CAGR as autogas conversions scale across Europe and Asia.
Why is Asia-Pacific so dominant in consumption?
Robust petrochemical expansion, expanding LPG cylinder distribution, and clean-cooking initiatives lift Asia-Pacific to 54.26% of global volume in 2025 with the fastest regional CAGR through 2031.
How are U.S. exports influencing international prices?
Gulf Coast cargoes priced USD 5 to USD 8 below Asian and Middle Eastern benchmarks in 2025, making U.S. suppliers de facto price setters in global trade.
Which companies hold the strongest competitive positions?
Integrated majors like ExxonMobil, Shell, TotalEnergies, Saudi Aramco, and PETRONAS dominate through end-to-end control of upstream NGLs and downstream petrochemical outlets.
What risks could temper future growth?
High crude-oil price swings, emerging electrification in cooking and transport, and potential freight bottlenecks remain key drags that could shave up to 0.9 percentage points off the long-term CAGR.
Page last updated on:


