Tamaño y Participación del Mercado de Proteína de Cáñamo de los Estados Unidos
Visión General del Mercado
| Período de Estudio | 2021 - 2031 |
|---|---|
| Período de Datos Pronosticados | 2026 - 2031 |
| Período de Datos Históricos | 2021 - 2024 |
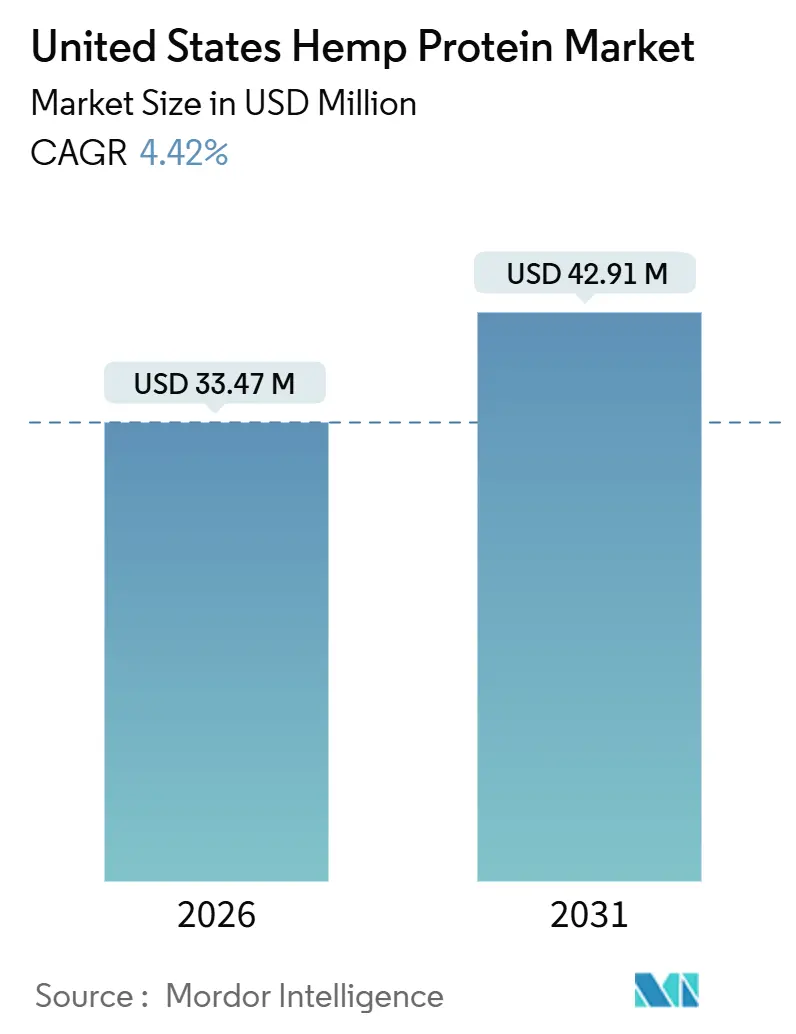
| Tamaño del Mercado (2026) | 33.47 Millones de dólares |
| Tamaño del Mercado (2031) | 42.91 Millones de dólares |
| Tasa de crecimiento (2026 - 2031) | 4.42% CAGR |
| Concentración del Mercado | Medio |
Jugadores principales *Nota aclaratoria: los principales jugadores no se ordenaron de un modo en especial Imagen © Mordor Intelligence. El uso requiere atribución según CC BY 4.0. | |
Análisis del Mercado de Proteína de Cáñamo de los Estados Unidos por Mordor Intelligence
El mercado de proteína de cáñamo de los Estados Unidos está valorado en USD 33,47 millones en 2026 y se proyecta que alcance USD 42,91 millones en 2031, creciendo a una CAGR del 5,09% durante el período de pronóstico. Este crecimiento refleja el creciente interés de los consumidores en fuentes de proteína de origen vegetal, con etiqueta limpia y libres de alérgenos. La proteína de cáñamo se utiliza cada vez más en nutrición deportiva, alimentos funcionales, suplementos dietéticos y bebidas listas para mezclar, impulsada por su perfil completo de aminoácidos y sus credenciales de sostenibilidad. La expansión de las poblaciones veganas y flexitarianas continúa apoyando la demanda en los segmentos de alimentos y nutrición. Los fabricantes de alimentos y bebidas están incorporando proteína de cáñamo en barras de proteína, polvos, productos de panadería y alternativas lácteas para diversificar su oferta. El crecimiento está respaldado además por mejores prácticas de cultivo de cáñamo y la estandarización de productos. Sin embargo, el mercado sigue siendo un nicho en comparación con la proteína de soja y de guisante, lo que limita la adopción a gran escala.
Conclusiones Clave del Informe
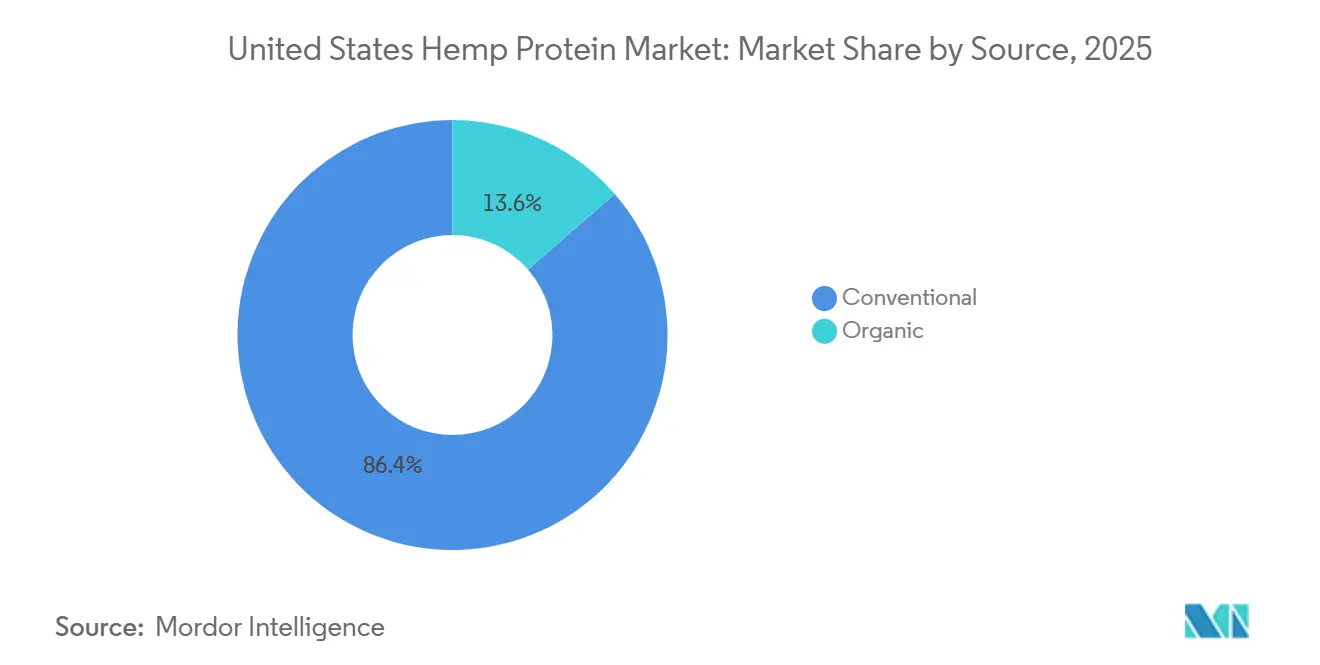
- Por fuente, los formatos convencionales representaron el 86,38% de la participación del mercado de proteína de cáñamo de los Estados Unidos en 2025, mientras que los formatos orgánicos se expandieron a una CAGR del 6,42% hasta 2031.
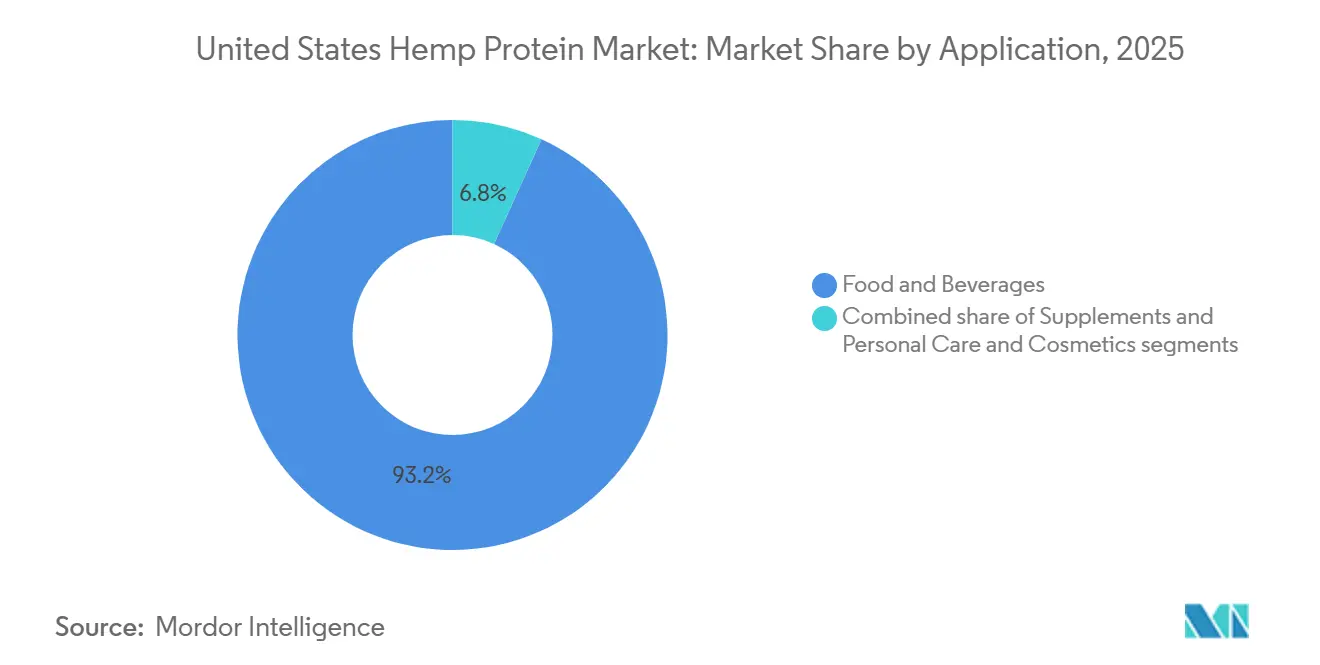
- Por aplicación, los alimentos y bebidas representaron el 93,21% del tamaño del mercado de proteína de cáñamo de los Estados Unidos en 2025; el segmento de suplementos registró la CAGR más rápida del 6,89% hacia 2031.
Nota: Las cifras del tamaño del mercado y los pronósticos de este informe se generan utilizando el marco de estimación patentado de Mordor Intelligence, actualizado con los datos y conocimientos más recientes disponibles a partir de enero de 2026.
Tendencias e Información del Mercado de Proteína de Cáñamo de los Estados Unidos
Análisis del Impacto de los Impulsores*
| Impulsor | (~) % de Impacto en el Pronóstico de la CAGR | Relevancia Geográfica | Horizonte Temporal del Impacto |
|---|---|---|---|
| Creciente demanda de los consumidores de proteínas de origen vegetal | +1.2% | Nacional, con concentración en los mercados urbanos de la Costa Oeste y el Noreste | Mediano plazo (2-4 años) |
| Creciente conciencia sobre la salud y el bienestar | +0.9% | Nacional, más fuerte en áreas metropolitanas con altos ingresos familiares | Mediano plazo (2-4 años) |
| Mayor uso en nutrición deportiva y productos de fitness | +0.8% | Nacional, con adopción temprana en comunidades de CrossFit y atletas de resistencia | Corto plazo (≤ 2 años) |
| Expansión de las dietas veganas y vegetarianas | +0.7% | Nacional, liderada por los grupos demográficos de la Generación Z y los Millennials | Largo plazo (≥ 4 años) |
| Creciente interés en ingredientes sostenibles y ecológicos | +0.6% | Nacional, con posicionamiento premium en mercados costeros y ciudades universitarias | Largo plazo (≥ 4 años) |
| Crecimiento de alimentos funcionales y suplementos | +0.5% | Nacional, impulsado por la cohorte de Baby Boomers en proceso de envejecimiento y consumidores orientados al bienestar | Mediano plazo (2-4 años) |
| Fuente: Mordor Intelligence | |||


Creciente demanda de los consumidores de proteínas de origen vegetal
La creciente demanda de los consumidores de proteínas de origen vegetal está impulsando el mercado de proteína de cáñamo en los EE. UU., alimentada por una mayor conciencia sobre la salud, preocupaciones por la sostenibilidad y cambios en las preferencias dietéticas. Reflejando esta tendencia, el Good Food Institute informó que en 2024, aproximadamente el 60% de los hogares estadounidenses adquirieron algún tipo de alimento de origen vegetal, lo que demuestra la adopción generalizada de dietas de origen vegetal más allá de vegetarianos y veganos[1]Fuente: Good Food Institute, "Perspectivas del mercado minorista de EE. UU. para la industria de origen vegetal", gfi.org. Los consumidores buscan activamente fuentes de proteína que sean nutritivas y respetuosas con el medio ambiente, lo que convierte a la proteína de cáñamo en una opción popular gracias a su perfil completo de aminoácidos, su alto contenido de fibra y su atractivo de etiqueta limpia. El auge de los estilos de vida de origen vegetal en los canales de servicios de alimentación, venta minorista y directo al consumidor respalda aún más el crecimiento del mercado. Además, la proteína de cáñamo se alinea con las tendencias de alimentos funcionales, ofreciendo beneficios como soporte muscular, control de peso y salud intestinal.
Creciente conciencia sobre la salud y el bienestar
Los consumidores en los Estados Unidos priorizan cada vez más la salud y el bienestar, especialmente en lo que respecta a la ingesta de proteínas, lo que impulsa el mercado de proteína de cáñamo. En 2024, el 54% de los adultos estadounidenses encuestados enfatizaron el contenido de proteínas en sus elecciones de alimentos envasados, un aumento notable desde el 41% en 2020[2]Fuente: Consejo Internacional de Información Alimentaria, "Encuesta de Alimentos y Salud IFIC 2024", ific.org. Esta tendencia subraya una mayor conciencia sobre el papel de las proteínas en la saciedad, la salud metabólica y el mantenimiento muscular. A medida que los consumidores se informan más sobre la importancia dietética de las proteínas, se observa un marcado aumento en la demanda de alimentos funcionales y ricos en nutrientes. La proteína de cáñamo se destaca en este panorama, con un perfil completo de aminoácidos, alto contenido de fibra y origen vegetal. A medida que los consumidores buscan productos que impulsen la energía, ayuden a la recuperación y promuevan el bienestar general, la proteína de cáñamo emerge como una alternativa convincente a las fuentes de proteína convencionales. Este impulso se ve reforzado por una creciente preferencia por ingredientes de etiqueta limpia y sostenibles, consolidando la posición de la proteína de cáñamo en el floreciente mercado de proteínas de origen vegetal.
Mayor uso en nutrición deportiva y productos de fitness
En los EE. UU., el mercado de proteína de cáñamo está en auge, en gran parte debido a su creciente popularidad en la nutrición deportiva y los productos de fitness. Esta tendencia se alinea con el mayor énfasis de la nación en la salud física y el estilo de vida activo. Para 2024, los EE. UU. contaban con 77 millones de membresías en clubes de fitness, lo que subraya una vasta audiencia ávida de nutrición que mejore el rendimiento y ayude a la recuperación[3]Fuente: Asociación de Salud y Fitness, "Cómo entrenan 77 millones de miembros de fitness: nuevos datos de la HFA revelan tendencias cambiantes en equipos, entrenamiento y membresías", healthandfitness.org. La proteína de cáñamo, reconocida por su perfil completo de aminoácidos y su superior digestibilidad, se está incorporando en polvos de proteína, barras y batidos listos para beber, todos adaptados para atletas y entusiastas del fitness. Las marcas están aprovechando el atractivo de origen vegetal y etiqueta limpia del cáñamo, atendiendo la creciente demanda de proteínas sostenibles y funcionales. A medida que los consumidores se inclinan hacia la proteína de cáñamo para el mantenimiento muscular, la recuperación post-entrenamiento y el bienestar integral, esta emerge como un sustituto preferido de las proteínas tradicionales de origen animal.
Expansión de las dietas veganas y vegetarianas
La expansión de las dietas veganas y vegetarianas es un impulsor destacado del mercado de proteína de cáñamo en los EE. UU., que refleja un cambio más amplio hacia la nutrición de origen vegetal. Un número creciente de consumidores está adoptando estilos de vida vegetarianos o completamente veganos por razones de salud, éticas y medioambientales, lo que genera una fuerte demanda de fuentes alternativas de proteína. La proteína de cáñamo, con su perfil completo de aminoácidos, alto contenido de fibra y posicionamiento de etiqueta limpia, sirve como una opción ideal de proteína de origen vegetal. Los minoristas y proveedores de servicios de alimentación incorporan cada vez más proteína de cáñamo en snacks, bebidas, sustitutos de comidas y suplementos proteicos para atender a este creciente grupo demográfico. La creciente conciencia sobre el impacto ambiental de las proteínas de origen animal respalda aún más su adopción, ya que los consumidores priorizan alternativas sostenibles y ricas en nutrientes. Esta tendencia subraya la creciente integración de la salud, la sostenibilidad y las preferencias dietéticas en la configuración de las elecciones de los consumidores.
Análisis del Impacto de las Restricciones*
| Restricción | (~) % de Impacto en el Pronóstico de la CAGR | Relevancia Geográfica | Horizonte Temporal del Impacto |
|---|---|---|---|
| Incertidumbre regulatoria en torno al procesamiento y etiquetado del cáñamo | -0.8% | Nacional, con variaciones en la aplicación a nivel estatal | Corto plazo (≤ 2 años) |
| Conciencia limitada de los consumidores en comparación con otras proteínas vegetales | -0.6% | Nacional, más aguda en los estados del Medio Oeste y del Sur | Mediano plazo (2-4 años) |
| Restricciones de suministro de biomasa de cáñamo de calidad | -0.5% | Nacional, concentrada en estados con programas de cáñamo incipientes | Corto plazo (≤ 2 años) |
| Limitaciones en el perfil de sabor y gusto | -0.4% | Nacional, que afecta la adopción generalizada en todos los grupos demográficos | Mediano plazo (2-4 años) |
| Fuente: Mordor Intelligence | |||
Incertidumbre regulatoria en torno al procesamiento y etiquetado del cáñamo
Las continuas incertidumbres regulatorias en torno al procesamiento y etiquetado del cáñamo representan un desafío significativo para el mercado de proteína de cáñamo en los EE. UU. Si bien la Ley Agrícola de 2018 legalizó el cáñamo a nivel federal, las regulaciones estatales y las cambiantes directrices de la Administración de Alimentos y Medicamentos presentan obstáculos de cumplimiento para los fabricantes. Las empresas lidian con normas complejas sobre los límites de contenido de THC, el etiquetado de productos y las declaraciones de marketing, lo que a menudo genera retrasos en el lanzamiento de productos y mayores costos operativos. Estas regulaciones estatales inconsistentes complican aún más la distribución interestatal y los esfuerzos de escalamiento, frenando la expansión del mercado. Tales incertidumbres pueden mermar la confianza de los inversores y disuadir a nuevos participantes, especialmente a los productores más pequeños. Además, los estrictos requisitos de pruebas y documentación para garantizar el cumplimiento amplían los plazos de producción e incrementan los costos.
Restricciones de suministro de biomasa de cáñamo de calidad
Las restricciones de suministro de biomasa de cáñamo de calidad son una restricción importante en el mercado de proteína de cáñamo de los EE. UU., que limita la producción consistente y la escalabilidad. La producción de polvos de proteína de cáñamo funcionales requiere cáñamo de alta calidad, rico en proteínas y bajo en THC. Sin embargo, el cultivo enfrenta desafíos derivados de la variabilidad climática, la tierra arable limitada y la necesidad de experiencia agrícola. Los rendimientos inconsistentes y las variaciones en el contenido de proteínas pueden interrumpir la fabricación y comprometer la calidad del producto, lo que representa desafíos para productores de todos los tamaños. Además, dado que el sector de cultivo de cáñamo en los EE. UU. aún está madurando, experimenta fluctuaciones estacionales de suministro y elevados costos de materias primas. Estos desafíos dificultan la capacidad de las empresas para satisfacer de manera confiable la creciente demanda de los consumidores de productos de proteína de origen vegetal.
*Nuestras previsiones consideran los impactos de impulsores y restricciones como direccionales, no aditivos. Las previsiones de impacto reflejan el crecimiento base, los efectos de mezcla y las interacciones entre variables.
Análisis de Segmentos
Por Fuente: El Dominio Convencional Refleja la Sensibilidad al Precio
Los formatos de proteína de cáñamo convencional representaron el 86,38% del mercado de proteína de cáñamo de los Estados Unidos en 2025, convirtiéndolos en la opción mayoritaria clara entre fabricantes y consumidores. Su dominio refleja una amplia disponibilidad, cadenas de suministro establecidas y precios generalmente más bajos en comparación con las alternativas orgánicas. Los productos convencionales se utilizan ampliamente en aplicaciones como mezclas de panadería, batidos, bebidas listas para beber y barras de nutrición, donde la competitividad en costos es fundamental. Muchos minoristas de gran formato y marcas masivas aún priorizan el abastecimiento convencional para mantener los precios de los productos accesibles. Además, las relaciones consolidadas con proveedores y la infraestructura de procesamiento certificada para la proteína de cáñamo convencional refuerzan su posición arraigada.
La proteína de cáñamo orgánica, aunque con una participación absoluta menor en la actualidad, está emergiendo como el formato de más rápido crecimiento en el mercado de proteína de cáñamo de los Estados Unidos, con una CAGR proyectada del 6,42% durante el período de pronóstico (2026-2031). Este crecimiento está estrechamente vinculado al creciente interés de los consumidores en proteínas vegetales de etiqueta limpia, producidas de manera sostenible y libres de pesticidas. Los compradores conscientes de la salud buscan cada vez más certificaciones orgánicas como sinónimo de mayor calidad percibida y responsabilidad ambiental. Las marcas que apuntan a canales de bienestar premium, nutrición deportiva y venta minorista especializada están, por lo tanto, apostando más por la proteína de cáñamo orgánica en sus formulaciones. El formato también se beneficia del impulso más amplio en alimentos y bebidas orgánicos, donde los compradores de múltiples categorías a menudo mejoran su nivel de compra en varios tipos de productos.

Por Aplicación: Alimentos y Bebidas Lideran, los Suplementos se Aceleran
Los alimentos y bebidas representaron el 93,21% del mercado de proteína de cáñamo de los Estados Unidos en 2025, lo que convierte a este en el segmento de aplicación dominante de manera abrumadora. En este espacio, la proteína de cáñamo se utiliza principalmente como ingrediente funcional que mejora la nutrición, la textura y la unión, en lugar de servir como el componente principal en la etiqueta. Se incorpora ampliamente en productos de panadería, incluidos panes, muffins y barras, donde aumenta el contenido de proteínas al tiempo que contribuye a la estructura. Los snacks como chips, galletas saladas y mezclas de granola también aprovechan la proteína de cáñamo para alinearse con el posicionamiento de alto contenido proteico y mejor para ti. En las bebidas de origen vegetal, la proteína de cáñamo ayuda a apoyar el crecimiento de las alternativas lácteas y las bebidas fortificadas dirigidas a consumidores flexitarianos y veganos.
Los suplementos, si bien representan solo el 6,79% del mercado de proteína de cáñamo de los Estados Unidos en 2025, están destinados a crecer más rápido, con una CAGR proyectada del 6,89% hasta 2031. Esta aceleración está estrechamente vinculada a la expansión de los productos de nutrición deportiva que incorporan proteína de cáñamo en polvos, mezclas y batidos listos para beber. Los atletas y consumidores activos están cada vez más interesados en opciones de proteína de origen vegetal que complementen o reemplacen los ingredientes tradicionales derivados de lácteos. El segmento también está respaldado por productos de nutrición para adultos mayores y nutrición médica, donde la proteína de cáñamo puede contribuir al mantenimiento muscular, la saciedad y la ingesta general de proteínas. Estas formulaciones especializadas frecuentemente enfatizan la digestibilidad, el perfil de aminoácidos y la alineación con las tendencias de bienestar más amplias.

Análisis Geográfico
El mercado de proteína de cáñamo de los Estados Unidos está configurado por regiones con condiciones favorables para el cultivo de cáñamo y marcos regulatorios de apoyo. Estados como Colorado, Kentucky, Montana, Oregón y Dakota del Norte han emergido como centros de producción clave debido a la adopción temprana del cultivo de cáñamo, el clima adecuado y la infraestructura agrícola establecida. Estos estados se benefician de la proximidad al suministro de semillas de cáñamo en bruto, lo que permite un procesamiento eficiente en polvos e ingredientes de proteína de cáñamo. Las instalaciones de procesamiento localizadas ayudan a reducir los costos logísticos y mejorar la eficiencia de la cadena de suministro. La fuerte participación de los agricultores y los programas de apoyo a nivel estatal fomentan aún más el crecimiento de la producción.
En el lado de la demanda, el consumo de proteína de cáñamo se concentra en regiones conscientes de la salud y urbanizadas, particularmente la Costa Oeste, el Noreste y partes del Medio Oeste. California, Washington, Nueva York y Massachusetts muestran una mayor adopción debido a la fuerte presencia de mercados de alimentos naturales, orgánicos y funcionales. Estas regiones albergan un gran número de minoristas de alimentos naturales, marcas de suplementos y empresas de nutrición deportiva que incorporan activamente proteína de cáñamo en las formulaciones de sus productos. La conciencia de los consumidores sobre la nutrición de origen vegetal y la sostenibilidad es notablemente mayor en estos mercados.
El Medio Oeste sirve como un corredor estratégico de procesamiento y distribución, apoyando los envíos a nivel nacional. Las empresas están ubicando cada vez más sus instalaciones cerca de las zonas de cultivo para garantizar la trazabilidad y el control de calidad. La claridad regulatoria a nivel federal ha fomentado el comercio interestatal, aunque las variaciones a nivel estatal aún influyen en las estrategias de expansión. En general, la geografía del mercado de proteína de cáñamo de los Estados Unidos refleja un equilibrio entre los estados enfocados en el cultivo y las regiones metropolitanas impulsadas por el consumo, apoyando un crecimiento nacional constante.
Panorama Competitivo
El mercado de proteína de cáñamo de los Estados Unidos exhibe una fragmentación moderada, con una combinación de proveedores de ingredientes naturales establecidos, marcas de nicho de origen vegetal y procesadores especializados emergentes. A diferencia de los mercados altamente consolidados, ningún actor domina de manera absoluta; en cambio, la competencia surge de una amplia gama de empresas que varían en tamaño, enfoque de producto y alcance de distribución. Las empresas más grandes de alimentos naturales y suplementos aprovechan sus amplias carteras y su fuerte presencia minorista para impulsar la adopción de proteína de cáñamo, mientras que las marcas de nicho más pequeñas a menudo se diferencian a través de formulaciones únicas, certificación orgánica o posicionamiento de etiqueta limpia. Esta estructura fomenta la innovación continua y una oferta de productos diversa.
La diferenciación de productos y la marca juegan un papel significativo en la configuración de la competencia. Muchos actores compiten en atributos de calidad como el contenido de proteínas, el perfil de sabor, la certificación orgánica o sin organismos genéticamente modificados, y las credenciales de sostenibilidad. La proteína de cáñamo se incorpora en polvos, barras, batidos y mezclas de proteínas vegetales combinadas, y las empresas que adaptan sus productos a segmentos de consumidores específicos, como atletas, veganos o compradores orientados al bienestar, tienden a generar una mayor lealtad. Las asociaciones estratégicas con minoristas y la mayor visibilidad a través de plataformas de comercio electrónico también influyen en el posicionamiento competitivo, lo que permite a las marcas innovadoras expandir rápidamente su presencia nacional sin grandes inversiones en canales de distribución tradicionales.
La sensibilidad al precio y las posiciones de costo influyen aún más en la dinámica competitiva. La proteína de cáñamo generalmente tiene un precio premium en relación con proteínas vegetales más establecidas como la soja y el guisante, lo que lleva a las empresas a optimizar la producción y las eficiencias de abastecimiento para seguir siendo competitivas. Al mismo tiempo, los nuevos participantes a menudo ingresan al mercado con propuestas de nicho o de valor agregado, como productos con sabor, fórmulas combinadas o mejoras funcionales (por ejemplo, probióticos). Los desarrollos regulatorios en torno a los estándares de cultivo y procesamiento del cáñamo también impactan la competencia, ya que las empresas que pueden garantizar el cumplimiento y la calidad consistente obtienen una ventaja.
Líderes de la Industria de Proteína de Cáñamo de los Estados Unidos
Axiom Foods Inc.
ETChem Co.
Martin Bauer Group
Tilray Brands Inc.
NOW Foods LLC
- *Nota aclaratoria: los principales jugadores no se ordenaron de un modo en especial

Desarrollos Recientes de la Industria
- Abril de 2025: Victory Hemp Foods presentó la línea de procesamiento sin solventes más grande de América del Norte, dedicada a la proteína de corazón de cáñamo (V-70) y el aceite (V-ONE), en Carrollton, Kentucky. Aprovechando tecnología patentada, esta instalación está preparada para atender la creciente demanda de ingredientes de origen vegetal libres de alérgenos, ricos en nutrientes y sostenibles en los sectores de alimentos, bebidas y cosméticos.
- Agosto de 2024: Victory Hemp Foods completó una expansión de USD 2,5 millones de su instalación de Kentucky en el condado de Carroll, añadiendo 22 empleos y aumentando la capacidad de producción en un 40%. El proyecto recibió apoyo de la Junta de Desarrollo Agrícola de Kentucky y posiciona a la empresa para atender la creciente demanda de fabricantes de panadería y snacks.
- Abril de 2024: Panda Biotech inició operaciones comerciales en su masiva instalación de procesamiento de cáñamo industrial Panda Hemp Gin en Wichita Falls, Texas. Con una superficie de aproximadamente 500.000 pies cuadrados, es ahora la planta de procesamiento de cáñamo más grande del Hemisferio Occidental, capaz de procesar alrededor de 10 toneladas métricas de cáñamo por hora.


Alcance del Informe del Mercado de Proteína de Cáñamo de los Estados Unidos
El mercado de proteína de cáñamo de los Estados Unidos está segmentado por fuente en orgánica y convencional; por aplicación en alimentos funcionales, bebidas funcionales, suplementos dietéticos, farmacéuticos, cuidado personal y otros usos industriales.
| Orgánico |
| Convencional |
| Alimentos y Bebidas | Panadería |
| Snacks | |
| Confitería | |
| Bebidas | |
| Otros | |
| Suplementos | Nutrición Deportiva/de Rendimiento |
| Nutrición para Adultos Mayores y Nutrición Médica | |
| Cuidado Personal y Cosméticos |
| Por Fuente | Orgánico | |
| Convencional | ||
| Por Aplicación | Alimentos y Bebidas | Panadería |
| Snacks | ||
| Confitería | ||
| Bebidas | ||
| Otros | ||
| Suplementos | Nutrición Deportiva/de Rendimiento | |
| Nutrición para Adultos Mayores y Nutrición Médica | ||
| Cuidado Personal y Cosméticos | ||


Definición de mercado
- Usuario Final - El Mercado de Ingredientes Proteicos opera sobre una base B2B. Los fabricantes de Alimentos, Bebidas, Suplementos, Alimento para Animales y Cuidado Personal y Cosméticos se consideran usuarios finales en el mercado estudiado. El alcance excluye a los fabricantes que compran suero de leche líquido/seco para su uso como agente aglutinante o espesante u otras aplicaciones no proteicas.
- Tasa de Penetración - La Tasa de Penetración se define como el porcentaje del Volumen del Mercado de Usuario Final Enriquecido con Proteínas en el Volumen Total del Mercado de Usuario Final.
- Contenido Promedio de Proteína - El contenido promedio de proteína es el contenido promedio de proteína presente por cada 100 g de producto fabricado por todas las empresas de usuarios finales consideradas dentro del alcance de este informe.
- Volumen del Mercado de Usuario Final - El volumen del mercado de usuario final es el volumen consolidado de todos los tipos y formas de productos de usuario final en el país o región.
| Palabra clave | Definición |
|---|---|
| Alfa-lactoalbúmina (α-Lactoalbúmina) | Es una proteína que regula la producción de lactosa en la leche de casi todas las especies de mamíferos. |
| Aminoácido | Es un compuesto orgánico que contiene grupos funcionales tanto amino como de ácido carboxílico, que son necesarios para la síntesis de proteínas corporales y otros compuestos importantes que contienen nitrógeno, como la creatina, las hormonas peptídicas y algunos neurotransmisores. |
| Escaldado | Es el proceso de calentar brevemente verduras con vapor o agua hirviendo. |
| BRC | Consorcio Minorista Británico |
| Mejorador de pan | Es una mezcla a base de harina de varios componentes con propiedades funcionales específicas diseñadas para modificar las características de la masa y dar atributos de calidad al pan. |
| BSF | Mosca Soldado Negro |
| Caseinato | Es una sustancia producida al añadir un álcali a la caseína ácida, un derivado de la caseína. |
| Enfermedad celíaca | La enfermedad celíaca es una reacción inmune a la ingesta de gluten, una proteína que se encuentra en el trigo, la cebada y el centeno. |
| Calostro | Es un fluido lácteo que liberan los mamíferos que han dado a luz recientemente antes de que comience la producción de leche materna. |
| Concentrado | Es la forma menos procesada de proteína y tiene un contenido de proteína que oscila entre el 40 y el 90% en peso. |
| Base de proteína seca | Se refiere al porcentaje de "proteína pura" presente en un suplemento después de que el agua que contiene se elimina completamente mediante calor. |
| Suero de leche seco | Es el producto resultante de secar el suero de leche fresco que ha sido pasteurizado y al que no se le ha añadido nada como conservante. |
| Proteína de huevo | Es una mezcla de proteínas individuales, que incluye ovoalbúmina, ovomucoide, ovoglobulina, conalbúmina, vitelina y vitelenina. |
| Emulsionante | Es un aditivo alimentario que facilita la mezcla de alimentos que son inmiscibles entre sí, como el aceite y el agua. |
| Enriquecimiento | Es el proceso de adición de micronutrientes que se pierden durante el procesamiento del producto. |
| ERS | Servicio de Investigación Económica del Departamento de Agricultura de los EE. UU. |
| Extrusión | Es el proceso de forzar ingredientes mezclados blandos a través de una abertura en una placa perforada o troquel diseñado para producir la forma requerida. El alimento extruido se corta luego a un tamaño específico mediante cuchillas. |
| Haba | También conocida como faba, es otra palabra para los frijoles amarillos partidos. |
| FDA | Administración de Alimentos y Medicamentos |
| Laminado | Es un proceso en el que típicamente un grano de cereal (como maíz, trigo o arroz) se descompone en sémola, se cocina con sabores y jarabes, y luego se prensa en copos entre rodillos enfriados. |
| Agente espumante | Es un ingrediente alimentario que hace posible formar o mantener una dispersión uniforme de una fase gaseosa en un alimento líquido o sólido. |
| Servicios de alimentación | Se refiere a la parte de la industria alimentaria que incluye empresas, instituciones y compañías que preparan comidas fuera del hogar. Incluye restaurantes, cafeterías escolares y hospitalarias, operaciones de catering y muchos otros formatos. |
| Fortificación | Es la adición deliberada de micronutrientes que no se encuentran en ellos de forma natural o que se pierden durante el procesamiento, para mejorar el valor nutricional de un producto alimenticio. |
| FSANZ | Normas Alimentarias de Australia y Nueva Zelanda |
| FSIS | Servicio de Inspección y Seguridad Alimentaria |
| FSSAI | Autoridad de Seguridad y Normas Alimentarias de la India |
| Agente gelificante | Es un ingrediente que funciona como estabilizador y espesante para proporcionar espesor sin rigidez mediante la formación de gel. |
| GHG | Gas de Efecto Invernadero |
| Gluten | Es una familia de proteínas que se encuentran en los cereales, incluidos el trigo, el centeno, la espelta y la cebada. |
| Cáñamo | Es una clase botánica de cultivares de Cannabis sativa cultivados específicamente para uso industrial o medicinal. |
| Hidrolizado | Es una forma de proteína fabricada exponiendo la proteína a enzimas que pueden romper parcialmente los enlaces entre los aminoácidos de la proteína y descomponer proteínas grandes y complicadas en piezas más pequeñas. Su procesamiento facilita y acelera su digestión. |
| Hipoalergénico | Se refiere a una sustancia que causa menos reacciones alérgicas. |
| Aislado | Es la forma más pura y procesada de proteína que ha sido sometida a separación para obtener una fracción de proteína pura. Típicamente contiene ≥ 90% de proteína en peso. |
| Queratina | Es una proteína que ayuda a formar el cabello, las uñas y la capa exterior de la piel. |
| Lactoalbúmina | Es la albúmina contenida en la leche y obtenida del suero de leche. |
| Lactoferrina | Es una glicoproteína de unión al hierro que está presente en la leche de la mayoría de los mamíferos. |
| Lupino | Son las semillas de leguminosas amarillas del género Lupinus. |
| Millennial | También conocido como Generación Y o Gen Y, se refiere a las personas nacidas entre 1981 y 1996. |
| Monogástrico | Se refiere a un animal con un estómago de un solo compartimento. Ejemplos de monogástricos incluyen humanos, aves de corral, cerdos, caballos, conejos, perros y gatos. La mayoría de los monogástricos generalmente no pueden digerir muchos materiales alimenticios de celulosa, como los pastos. |
| MPC | Concentrado de proteína de leche |
| MPI | Aislado de proteína de leche |
| MSPI | Aislado de proteína de soja metilada |
| Micoproteína | La micoproteína es una forma de proteína unicelular, también conocida como proteína fúngica, derivada de hongos para el consumo humano. |
| Nutricosmética | Es una categoría de productos e ingredientes que actúan como suplementos nutricionales para cuidar la belleza natural de la piel, las uñas y el cabello. |
| Osteoporosis | Es una condición médica en la que los huesos se vuelven frágiles y quebradizos por la pérdida de tejido, típicamente como resultado de cambios hormonales o deficiencia de calcio o vitamina D. |
| PDCAAS | La puntuación de aminoácidos corregida por digestibilidad de proteínas (PDCAAS) es un método para evaluar la calidad de una proteína basado tanto en los requisitos de aminoácidos de los humanos como en su capacidad para digerirla. |
| Consumo per cápita de proteína animal | Es la cantidad promedio de proteína animal (como leche, suero de leche, gelatina, colágeno y proteínas de huevo) que está disponible para el consumo de cada persona en una población real. |
| Consumo per cápita de proteína vegetal | Es la cantidad promedio de proteína vegetal (como proteínas de soja, trigo, guisante, avena y cáñamo) que está disponible para el consumo de cada persona en una población real. |
| Quorn | Es una proteína microbiana fabricada utilizando micoproteína como ingrediente, en la que el cultivo de hongos se seca y se mezcla con albúmina de huevo o proteína de papa, que actúa como aglutinante, y luego se ajusta en textura y se prensa en diversas formas. |
| Listo para Cocinar | Se refiere a productos alimenticios que incluyen todos los ingredientes, donde se requiere alguna preparación o cocción a través de un proceso que se indica en el envase. |
| Listo para Comer | Se refiere a un producto alimenticio preparado o cocinado con anticipación, sin necesidad de cocción o preparación adicional antes de ser consumido. |
| RTD | Listo para Beber |
| RTS | Listo para Servir |
| Grasa saturada | Es un tipo de grasa en la que las cadenas de ácidos grasos tienen todos enlaces simples. Generalmente se considera poco saludable. |
| Salchicha | Es un producto cárnico elaborado con carne finamente picada y sazonada, que puede ser fresca, ahumada o en escabeche y que generalmente se rellena en una tripa. |
| Seitán | Es un sustituto cárnico de origen vegetal elaborado a partir de gluten de trigo. |
| Cápsula blanda de gelatina | Es una cápsula a base de gelatina con relleno líquido. |
| SPC | Concentrado de proteína de soja |
| SPI | Aislado de proteína de soja |
| Espirulina | Es una biomasa de cianobacterias que puede ser consumida por humanos y animales. |
| Estabilizador | Es un ingrediente añadido a los productos alimenticios para ayudar a mantener o mejorar su textura original y sus características físicas y químicas. |
| Suplementación | Es el consumo o provisión de fuentes concentradas de nutrientes u otras sustancias que tienen como objetivo complementar los nutrientes en la dieta y está destinada a corregir deficiencias nutricionales. |
| Texturizante | Es un tipo específico de ingrediente alimentario que se utiliza para controlar y alterar la sensación en boca y la textura de los productos alimenticios y de bebidas. |
| Espesante | Es un ingrediente que se utiliza para aumentar la viscosidad de un líquido o masa y hacerlo más espeso, sin cambiar sustancialmente sus otras propiedades. |
| Grasa trans | También llamados ácidos grasos trans insaturados o ácidos grasos trans, es un tipo de grasa insaturada que se produce naturalmente en pequeñas cantidades en la carne. |
| TSP | Proteína de soja texturizada |
| TVP | Proteína vegetal texturizada |
| WPC | Concentrado de proteína de suero de leche |
| WPI | Aislado de proteína de suero de leche |


Metodología de Investigación
Mordor Intelligence sigue una metodología de cuatro pasos en todos nuestros informes.
- Paso 1: Identificar Variables Clave: Las variables clave cuantificables (industriales y externas) relacionadas con el segmento de producto específico y el país se seleccionan de un grupo de variables y factores relevantes basados en investigación documental y revisión bibliográfica; junto con aportes de expertos primarios. Estas variables se confirman posteriormente mediante modelos de regresión (cuando sea necesario).
- Paso 2: Construir un Modelo de Mercado: Con el fin de construir una metodología de pronóstico sólida, las variables y factores identificados en el Paso 1 se prueban contra los números históricos disponibles del mercado. A través de un proceso iterativo, se establecen las variables necesarias para el pronóstico del mercado y el modelo se construye sobre la base de estas variables.
- Paso 3: Validar y Finalizar: En este importante paso, todos los números del mercado, variables y criterios de los analistas se validan a través de una extensa red de expertos en investigación primaria del mercado estudiado. Los encuestados se seleccionan en todos los niveles y funciones para generar una imagen holística del mercado estudiado.
- Paso 4: Resultados de la Investigación: Informes Sindicados, Asignaciones de Consultoría Personalizada, Bases de Datos y Plataformas de Suscripción


