Tamaño y Participación del Mercado de Proteína de Leche de América del Norte
Visión General del Mercado
| Período de Estudio | 2021 - 2031 |
|---|---|
| Período de Datos Pronosticados | 2026 - 2031 |
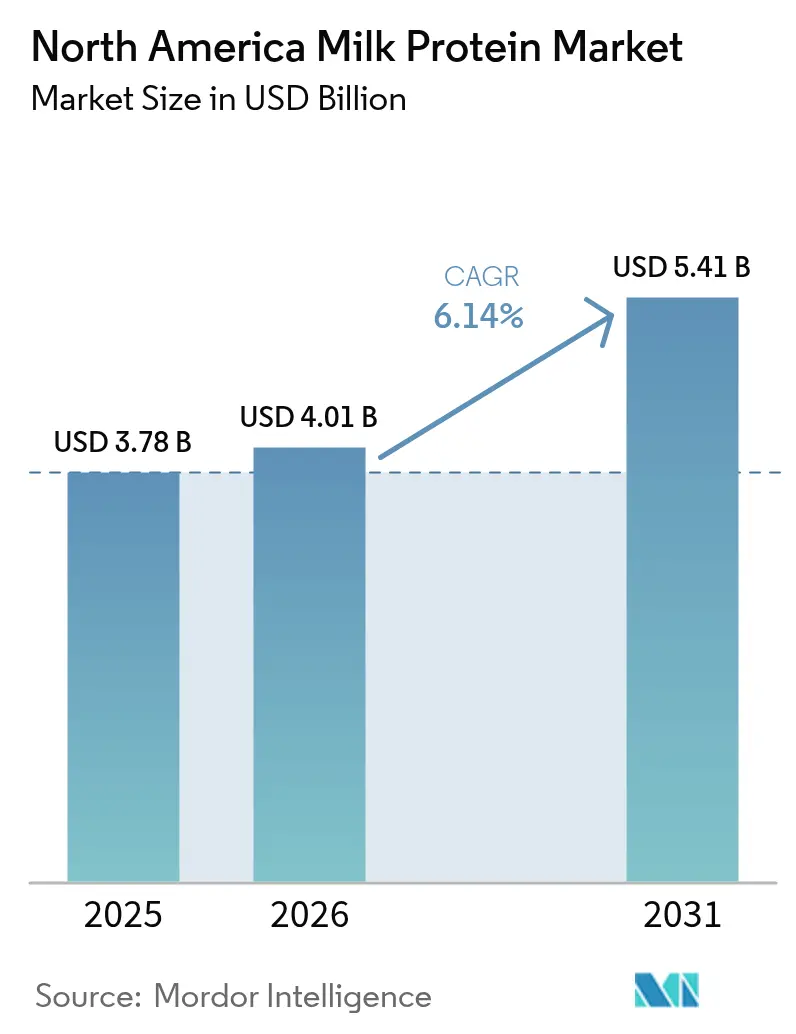
| Tamaño del mercado en el año base (2025) | 3.78 Mil millones de dólares |
| Tamaño del Mercado (2026) | 4.01 Mil millones de dólares |
| Tamaño del Mercado (2031) | 5.41 Mil millones de dólares |
| Tasa de crecimiento (2026 - 2031) | 6.14% CAGR |
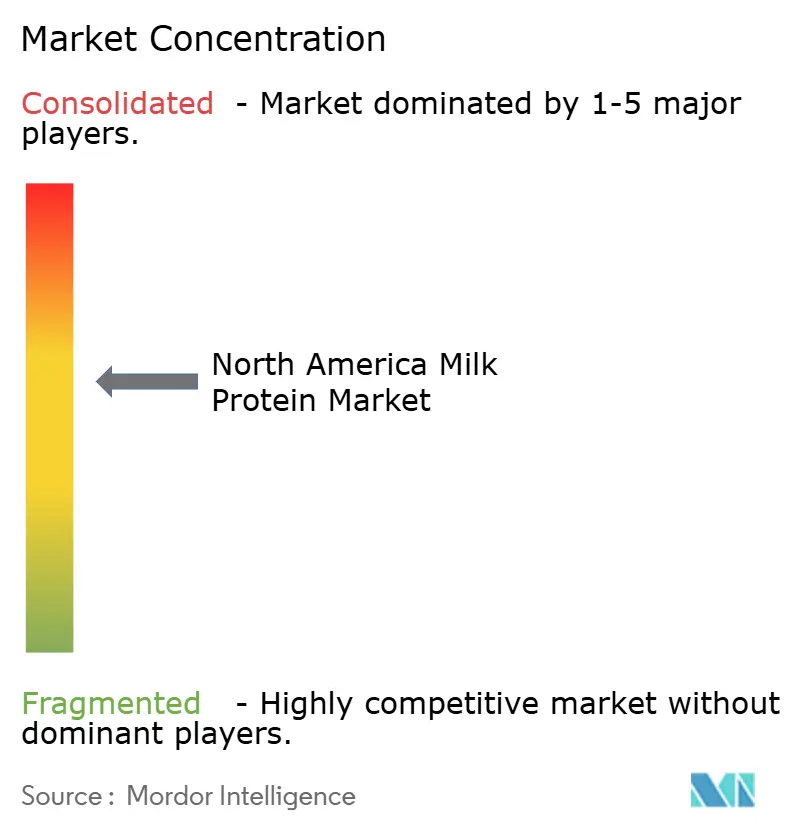
| Concentración del Mercado | Medio |
Jugadores principales *Nota aclaratoria: los principales jugadores no se ordenaron de un modo en especial Imagen © Mordor Intelligence. El uso requiere atribución según CC BY 4.0. | |
Análisis del Mercado de Proteína de Leche de América del Norte por Mordor Intelligence
El tamaño del mercado de proteína de leche de América del Norte fue valorado en USD 3,78 mil millones en 2025 y se estima que crecerá desde USD 4,01 mil millones en 2026 hasta alcanzar USD 5,41 mil millones en 2031, a una CAGR del 6,14% durante el período de previsión (2026-2031). Esta trayectoria refleja cambios estructurales en el consumo de proteínas de los consumidores más que fluctuaciones cíclicas de la demanda. El sesenta y uno por ciento de los estadounidenses aumentó su ingesta de proteínas en 2024 en comparación con el 48% en 2019, con los consumidores de la Generación Z liderando la tendencia con un 66% de adopción de dietas altas en proteínas [1]Fuente: Consejo Internacional de Información Alimentaria, "ingesta de proteínas", ific.org. El auge simultáneo de los medicamentos GLP-1 para el control del peso ha creado un impulso inesperado, ya que los pacientes priorizan las proteínas para preservar la masa muscular magra durante la pérdida de peso rápida [2]Fuente: Administración de Alimentos y Medicamentos de los EE. UU., "medicamentos GLP-1", fda.gov. Las marcas de nutrición deportiva están introduciendo bebidas de suero claro que combinan alta densidad proteica con perfiles sensoriales ligeros similares a los jugos, mientras que los productores de alimentos y bebidas enriquecen las líneas principales de panadería, snacks y alternativas lácteas para mejorar la calidad de los aminoácidos. Las cooperativas verticalmente integradas de los Estados Unidos están ampliando la capacidad de ultrafiltración y secado por aspersión, y las disposiciones de comercio transfronterizo del USMCA permiten a los proveedores estadounidenses atender la creciente demanda de la clase media de México. La volatilidad de los márgenes persiste debido a la contracción del suministro de leche, el aumento de los costos de alimentación animal y las medidas de bioseguridad relacionadas con el H5N1, aunque la resiliencia estructural de la demanda limita el riesgo a la baja.
Conclusiones Clave del Informe
- Por tipo, el Concentrado de Proteína de Leche mantuvo el 86,65% de la participación del mercado de proteína de leche de América del Norte en 2025, mientras que el Aislado de Proteína de Leche tiene previsto avanzar a una CAGR del 6,92% hasta 2031.
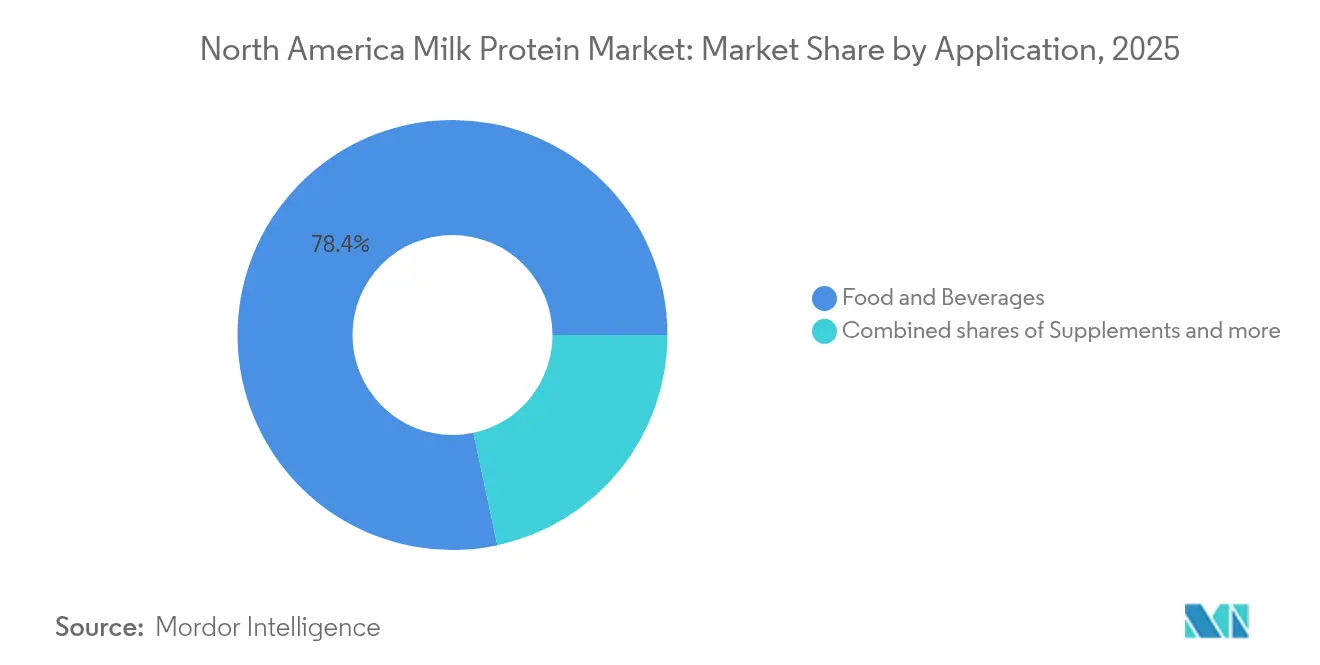
- Por aplicación, Alimentos y Bebidas representó el 78,35% del tamaño del mercado de proteína de leche de América del Norte en 2025, mientras que Suplementos se proyecta que registrará una CAGR del 5,69% hasta 2031.
- Por geografía, los Estados Unidos representaron el 84,95% de los ingresos de 2025, aunque se espera que México registre la CAGR más rápida del 6,21% durante 2026-2031.
Nota: Las cifras de tamaño del mercado y previsión de este informe se generan utilizando el marco de estimación propietario de Mordor Intelligence, actualizado con los últimos datos e información disponibles a partir de 2026.
Tendencias e Información del Mercado de Proteína de Leche de América del Norte
Análisis del Impacto de los Impulsores*
| Impulsor | (~) % de Impacto en la Previsión de CAGR | Relevancia Geográfica | Horizonte Temporal del Impacto |
|---|---|---|---|
| Aumento de la demanda de dietas altas en proteínas entre los consumidores conscientes de su condición física | +1.8% | Estados Unidos, Canadá, con repercusión en los centros urbanos de México | Mediano plazo (2-4 años) |
| Adopción de ingredientes de etiqueta limpia por parte de los fabricantes de alimentos | +1.2% | América del Norte, con mayor intensidad en los canales de venta minorista premium de los Estados Unidos | Largo plazo (≥ 4 años) |
| Mayor uso de proteínas de leche en productos de nutrición deportiva | +1.5% | Estados Unidos, Canadá, especialmente en formatos listos para beber y en barra | Corto plazo (≤ 2 años) |
| Creciente popularidad de las proteínas de origen lácteo en reemplazos de comidas y snacks | +0.9% | Estados Unidos, Canadá, impulsado por los grupos demográficos Millennial y Generación Z | Mediano plazo (2-4 años) |
| Innovación en polvos de proteína de leche saborizados y listos para usar por conveniencia | +0.7% | Estados Unidos, Canadá, con expansión hacia los canales de comercio electrónico de México | Corto plazo (≤ 2 años) |
| Aumento de las inversiones en I+D por parte de los fabricantes para crear proteínas especializadas para nutrición clínica y pediátrica | +1.0% | Estados Unidos, Canadá, con armonización regulatoria bajo la FDA y Health Canada | Largo plazo (≥ 4 años) |
| Fuente: Mordor Intelligence | |||
Aumento de la Demanda de Dietas Altas en Proteínas entre los Consumidores Conscientes de su Condición Física
Las plataformas de redes sociales han transformado las proteínas de una preocupación de nicho del culturismo en una prioridad dietética generalizada, con influencers de TikTok e Instagram que amplifican los planes de alimentación altos en proteínas a audiencias más jóvenes y diversas que las comunidades de fitness tradicionales. El sesenta y seis por ciento de los consumidores de la Generación Z siguen ahora dietas altas en proteínas, un grupo que históricamente priorizaba la alimentación a base de plantas, pero que cada vez más considera las proteínas lácteas compatibles con los objetivos de sostenibilidad cuando se obtienen de sistemas de agricultura regenerativa. La proliferación de agonistas del receptor GLP-1 como el semaglutida para el control del peso ha generado un aumento inesperado de la demanda de proteínas, ya que los proveedores de atención médica recomiendan de 1,2 a 1,6 gramos de proteína por kilogramo de peso corporal para mitigar la pérdida muscular durante la reducción de peso inducida farmacológicamente. Esta superposición de la nutrición médica posiciona a las proteínas de leche, en particular las mezclas de suero y caseína, como ingredientes funcionales en lugar de aditivos de materia prima. Las ventas trimestrales de ingredientes de proteína de suero en América del Norte se acercaron a una cifra significativa, con los formatos listos para beber captando participación de los productos en polvo, ya que la conveniencia supera el costo por porción para los consumidores con limitaciones de tiempo[3]Fuente: Departamento de Agricultura de los EE. UU., "ingrediente de proteína de suero", ams.usda.gov.
Adopción de Ingredientes de Etiqueta Limpia por Parte de los Fabricantes de Alimentos
El cincuenta y seis por ciento de los consumidores expresa disposición a pagar precios premium por productos con listas de ingredientes reconocibles, un umbral que favorece a las proteínas de leche sobre los aislados sintéticos o las alternativas altamente procesadas. La actualización de diciembre de 2024 de la Administración de Alimentos y Medicamentos (FDA) sobre la declaración de contenido nutricional "saludable" excluye explícitamente los aislados de proteína del cálculo de Equivalencia de Grupo de Alimentos, creando inadvertidamente una ventaja regulatoria para las fuentes de proteína de alimentos integrales, como el concentrado de proteína de leche, que aportan calcio, fósforo y vitaminas del complejo B. Este cambio en la regulación obliga a los equipos de reformulación a reconsiderar las jerarquías de ingredientes, especialmente en cereales de desayuno y barras de snacks, donde las declaraciones de "saludable" en la parte frontal del envase impulsan la prueba entre los compradores conscientes de su salud. Las cooperativas lecheras han respondido invirtiendo en verificación no transgénica y certificaciones de alimentación a base de pasto; Organic Valley informó que sus ventas de proteína de suero de alimentación a base de pasto crecieron en 2024, superando al suero convencional en una proporción de 3 a 1. El posicionamiento de etiqueta limpia también aísla a las proteínas de leche de la reacción contra los alimentos ultraprocesados, ya que las auditorías de transparencia de ingredientes realizadas por minoristas y grupos de defensa del consumidor señalan cada vez más los aditivos con números E o nombres de sonido químico.
Mayor Uso de Proteínas de Leche en Productos de Nutrición Deportiva
La nutrición deportiva ha evolucionado desde una categoría de nicho dominada por botes de polvo sin sabor hasta un mercado norteamericano de USD 15 mil millones que abarca batidos listos para beber, barras de proteína y sobres individuales que compiten directamente con los snacks tradicionales. El contenido de leucina, el aminoácido de cadena ramificada más directamente relacionado con la síntesis de proteínas musculares, otorga al aislado de proteína de suero una ventaja bioquímica sobre las proteínas vegetales, con 2,5 gramos de leucina por porción de 25 gramos en comparación con 1,8 gramos en el aislado de proteína de guisante. Arla Foods Ingredients lanzó Lacprodan ISO.Clear en 2024, un aislado de proteína de suero diseñado para bebidas transparentes similares a los jugos que evitan la sensación granulosa que los consumidores asocian con los batidos de proteína tradicionales. Esta innovación aborda una barrera crítica para la expansión de la categoría: la fatiga sensorial entre los usuarios frecuentes que se cansan de los productos cremosos al estilo de los batidos de leche. El Nutiani WPC-80 de Fonterra, introducido en 2024, apunta al segmento de valor con un concentrado de proteína de suero al 80% que ofrece ahorros de costos del 15-20% respecto a los aislados, manteniendo al mismo tiempo la solubilidad en agua fría. El cambio hacia los formatos claros y ligeros también se alinea con las tendencias de hidratación, ya que los consumidores consideran cada vez más las bebidas proteicas como una bebida funcional refrescante en lugar de sustitutos de comidas.
Creciente Popularidad de las Proteínas de Origen Lácteo en Reemplazos de Comidas y Snacks
La nutrición portátil ha migrado desde entornos clínicos, donde los batidos de reemplazo de comidas servían a pacientes con disfagia o desnutrición, hasta el comercio minorista general, ya que los profesionales y padres con poco tiempo buscan alternativas saciantes a las comidas tradicionales. Los consumidores Millennial y de la Generación Z, que comprenden el 58% de los compradores de reemplazos de comidas, priorizan la conveniencia y el equilibrio de macronutrientes sobre la restricción calórica, un cambio que favorece las formulaciones altas en proteínas con 20-30 gramos por porción. El concentrado de proteína de leche ofrece a los formuladores una base rentable que aporta tanto suero de digestión rápida como caseína de digestión lenta, creando una liberación sostenida de aminoácidos que prolonga la saciedad durante 3-4 horas después del consumo. La declaración de propiedades saludables calificada de la FDA de marzo de 2024 para el yogur y la reducción del riesgo de diabetes tipo 2 ha amplificado el interés en los beneficios metabólicos de las proteínas lácteas, impulsando a las marcas de snacks a destacar los ingredientes derivados de la leche en las etiquetas frontales del envase. Los snacks de proteína listos para comer, incluidas las crisps de queso, los puffs de proteína y la granola enriquecida, crecieron en ventas en dólares durante 2024, superando a los snacks salados tradicionales por un factor de tres. Esta expansión de categoría beneficia a los proveedores de proteína de leche al crear demanda de ingredientes especializados como la caseína micelar y el suero nativo, que alcanzan primas de precio del 25-40% sobre el concentrado de proteína de suero de materia prima.
Análisis del Impacto de las Restricciones*
| Restricción | (~) % de Impacto en la Previsión de CAGR | Relevancia Geográfica | Horizonte Temporal del Impacto |
|---|---|---|---|
| Intolerancia a la lactosa que limita la aceptación del consumidor de proteínas de leche | -0.6% | Estados Unidos (mayor prevalencia entre las poblaciones afroamericana, hispana y asiático-americana), Canadá | Mediano plazo (2-4 años) |
| Aprobaciones regulatorias estrictas para alimentos funcionales y enriquecidos | -0.4% | Estados Unidos (FDA), Canadá (Health Canada), México (COFEPRIS) | Largo plazo (≥ 4 años) |
| Competencia de alternativas proteicas de origen vegetal | -0.8% | Estados Unidos, Canadá, especialmente en canales de venta minorista en supermercados y servicios de alimentación | Corto plazo (≤ 2 años) |
| Interrupciones en la cadena de suministro que afectan la disponibilidad de proteína de leche | -0.5% | Estados Unidos (región de producción primaria), con repercusión en Canadá y México | Corto plazo (≤ 2 años) |
| Fuente: Mordor Intelligence | |||
Intolerancia a la Lactosa que Limita la Aceptación del Consumidor de Proteínas de Leche
Aproximadamente el 36% de la población de los Estados Unidos experimenta algún grado de malabsorción de lactosa, con una prevalencia que alcanza el 80% entre los afroamericanos, el 80-100% entre los indígenas americanos, el 90-100% entre los asiático-americanos y el 50-80% entre las poblaciones hispanas/latinas, según el Instituto Nacional de Diabetes y Enfermedades Digestivas y Renales. Esta realidad demográfica limita el tamaño del mercado potencial, especialmente a medida que aumenta la diversidad étnica. La Oficina del Censo de los EE. UU. proyecta que los blancos no hispanos comprenderán menos del 50% de la población para 2045. Sin embargo, la mayoría de las personas con intolerancia a la lactosa pueden consumir hasta 12 gramos de lactosa por día sin síntomas, equivalente a una taza de leche, y muchos ingredientes de proteína de leche contienen lactosa residual mínima después del procesamiento por ultrafiltración. El Aislado de Proteína de Leche típicamente contiene menos del 1% de lactosa, en comparación con el 4-5% en la leche líquida, posicionándolo como una opción viable para los consumidores sensibles a la lactosa cuando se combina con un etiquetado apropiado. El auge de los productos lácteos sin lactosa, que crecieron en ventas en dólares durante 2024, demuestra que la hidrólisis enzimática de la lactosa puede preservar las propiedades sensoriales y funcionales de las proteínas de leche mientras amplía la accesibilidad del consumidor. Los fabricantes también están explorando las proteínas de leche de beta-caseína A2, sobre las cuales algunos consumidores informan que causan menos malestar digestivo que la leche A1 convencional, aunque la evidencia revisada por pares sigue siendo no concluyente.
Aprobaciones Regulatorias Estrictas para Alimentos Funcionales y Enriquecidos
La revisión de diciembre de 2024 de la FDA sobre la declaración de contenido nutricional "saludable" introdujo una paradoja para los alimentos enriquecidos con proteínas: si bien la norma fomenta un mayor contenido de proteínas, simultáneamente excluye los aislados de proteína de los cálculos de Equivalencia de Grupo de Alimentos, complicando los mensajes en la parte frontal del envase para productos como barras de proteína y cereales enriquecidos. Cada nueva declaración funcional requiere ya sea una autodeterminación GRAS o una notificación formal GRAS ante la FDA, un proceso que puede durar de 12 a 18 meses y costar entre USD 50.000 y USD 150.000 en estudios toxicológicos y consultoría regulatoria. La notificación GRAS de β-lactoglobulina de Arla Foods Ingredients, presentada en 2024, ejemplifica la carga de documentación: la presentación incluyó caracterización de proteínas, validación del proceso de fabricación, evaluaciones de exposición dietética y estudios de seguridad en múltiples modelos animales. Las regulaciones canadienses sobre alimentos suplementados imponen complejidad adicional, requiriendo autorización previa a la comercialización para cualquier alimento que contenga aminoácidos añadidos o hidrolizados de proteínas por encima de los umbrales especificados, creando efectivamente un proceso de aprobación de doble vía para los lanzamientos en América del Norte. La COFEPRIS de México ha endurecido el escrutinio de las declaraciones de propiedades saludables en los productos proteicos, exigiendo sustentación clínica para cualquier declaración que implique reducción del riesgo de enfermedad o beneficio fisiológico. Estas fricciones regulatorias afectan desproporcionadamente a los fabricantes más pequeños que carecen de equipos dedicados de asuntos regulatorios, consolidando la ventaja competitiva de los proveedores de ingredientes multinacionales.
*Nuestras previsiones consideran los impactos de impulsores y restricciones como direccionales, no aditivos. Las previsiones de impacto reflejan el crecimiento base, los efectos de mezcla y las interacciones entre variables.
Análisis de Segmentos
Por Tipo: El Aislado Gana Terreno a Pesar del Dominio del Concentrado
El Concentrado de Proteína de Leche capturó el 86,65% de la participación de mercado en 2025, un dominio arraigado en su rentabilidad y versatilidad en aplicaciones de panadería, bebidas y alternativas lácteas donde el contenido proteico del 70-85% es suficiente. Sin embargo, el Aislado de Proteína de Leche se expandirá a una CAGR del 6,92% hasta 2031, el crecimiento más rápido entre los tipos de proteínas, ya que las marcas de nutrición deportiva priorizan formulaciones que superan el 90% de proteína para maximizar la densidad proteica por porción al mismo tiempo que minimizan los carbohidratos y las grasas. Las innovaciones en bebidas de suero claro, ejemplificadas por el Lacprodan ISO.Clear de Arla lanzado en 2024, requieren la eliminación casi completa de lípidos y minerales que causarían turbidez, una especificación que solo los aislados pueden cumplir. La Proteína de Leche Hidrolizada ocupa un nicho especializado en fórmula infantil y nutrición médica, donde los péptidos predigeridos reducen la alergenicidad y aceleran la absorción; la guía de fórmula infantil de 2024 de la FDA, que enfatiza métricas de calidad proteica como el DIAAS, ha impulsado a los fabricantes a reformular con fracciones de suero hidrolizado que imitan mejor los perfiles de aminoácidos de la leche materna humana.
El liderazgo de mercado del Concentrado refleja su doble funcionalidad como fuente de proteína y agente texturizante en alimentos procesados. Las aplicaciones de panadería aprovechan la capacidad de retención de agua del concentrado para extender la vida útil y mejorar la estructura de la miga, mientras que los formuladores de bebidas lo utilizan para crear cuerpo y sensación en la boca en jugos y batidos enriquecidos con proteínas. El contenido de lactosa del 13-15% en la mayoría de los concentrados limita su uso en productos sin lactosa, pero proporciona una dulzura natural que reduce los requisitos de azúcar añadida, alineándose con las tendencias de etiqueta limpia. El precio premium del Aislado, típicamente un 25-40% por encima del Concentrado en base a precio por libra, restringe su adopción a aplicaciones donde la pureza proteica justifica el costo, como los batidos listos para beber dirigidos a atletas y los reemplazos de comidas comercializados para consumidores que gestionan su peso. Los avances en tecnología de filtración por membrana, incluidas las membranas cerámicas que toleran temperaturas y presiones de operación más altas, están reduciendo gradualmente la brecha de costos al mejorar los rendimientos de producción de aislado.


Por Aplicación: Los Suplementos se Aceleran mientras Alimentos y Bebidas Madura
Alimentos y Bebidas representó el 78,35% del volumen del mercado en 2025, abarcando la enriquecimiento en panadería, bebidas enriquecidas con proteínas, productos lácteos y alternativas lácteas, comidas listas para comer y snacks, aunque el segmento de Suplementos crecerá más rápido con una CAGR del 5,69% hasta 2031, a medida que las aplicaciones de fórmula infantil, nutrición deportiva y nutrición para personas mayores convergen en la proteína de alta calidad como ingrediente funcional básico. Dentro de Alimentos y Bebidas, las aplicaciones de panadería se benefician de la capacidad de la proteína de leche para mejorar la elasticidad de la masa y la retención de agua, extendiendo la vida útil en 2-3 días en la producción comercial de pan, una ventaja crítica para los minoristas que buscan reducir el desperdicio. Los productos lácteos y las alternativas lácteas incorporan cada vez más proteína de leche para cerrar la brecha nutricional entre las leches de origen vegetal y la leche bovina; las mezclas de leche de guisante enriquecidas con aislado de proteína de suero aportan de 8 a 10 gramos de proteína completa por porción, igualando el perfil de aminoácidos de la leche de vaca mientras mantienen un posicionamiento de etiqueta frontal apto para veganos para los consumidores flexitarianos.
La acelerada trayectoria de crecimiento de los Suplementos refleja vientos de cola demográficos y regulatorios. El envejecimiento de la población de América del Norte, con el grupo de mayores de 65 años proyectado a alcanzar los 73 millones para 2030, está impulsando la demanda de productos de nutrición médica que aborden la sarcopenia, con proteínas de leche enriquecidas con leucina que ofrecen una síntesis de proteínas musculares superior en comparación con las alternativas vegetales. La nutrición deportiva y de rendimiento, aunque más madura que los segmentos clínicos, continúa expandiéndose a medida que la suplementación proteica se normaliza más allá de los atletas de alto rendimiento. Las aplicaciones de alimento para animales siguen siendo marginales en América del Norte, donde los usos de nutrición humana de alto valor absorben la mayor parte de la producción de proteína de leche, a diferencia de Europa, donde el permeado de suero encuentra un uso significativo en los alimentos de inicio para lechones. Las aplicaciones de cuidado personal y cosméticos, aunque pequeñas en volumen, alcanzan precios premium para los péptidos derivados de la leche utilizados en sueros antienvejecimiento y productos para el cuidado del cabello, con marcas como Drunk Elephant y The Ordinary que incorporan hidrolizados de proteína de suero por sus propiedades de estimulación del colágeno.
Análisis Geográfico
Los Estados Unidos detentaron el 84,95% del mercado de proteína de leche de América del Norte en 2025, una concentración que refleja las cooperativas lecheras verticalmente integradas del país, la avanzada infraestructura de procesamiento y la proximidad a los fabricantes de uso final en nutrición deportiva y nutrición clínica. Dairy Farmers of America, Hilmar Cheese Company, Leprino Foods Company e Idaho Milk Products operan colectivamente más de 40 instalaciones de producción de proteína de leche en el Medio Oeste Superior y el Suroeste, beneficiándose del suministro de leche de bajo costo en regiones como Wisconsin, California y Nuevo México.
Sin embargo, México se expandirá más rápido con una CAGR del 6,21% hasta 2031, impulsado por tasas de urbanización que superan el 80%, una clase media en crecimiento con ingresos disponibles en aumento y las disposiciones comerciales del USMCA que facilitan las importaciones de ingredientes libres de aranceles de los proveedores estadounidenses. Los consumidores mexicanos están cambiando de las fuentes de proteína tradicionales como frijoles y cerdo hacia formatos convenientes y estables en almacenamiento, incluidas barras de proteína, bebidas enriquecidas y bebidas de desayuno instantáneas, una transición que refleja la trayectoria de Corea del Sur una década antes. El mercado de Canadá, aunque menor en términos absolutos, exhibe marcos regulatorios sofisticados que dan forma a la innovación de productos. La aprobación de 2024 de Health Canada para la β-lactoglobulina de fermentación de precisión de Remilk señala una apertura hacia nuevos métodos de producción, posicionando potencialmente al país como mercado de prueba para proteínas lácteas de origen no animal antes de un lanzamiento más amplio en América del Norte. La empresa conjunta FrieslandCampina-Vitalus Nutrition en Ontario produce proteínas especializadas para fórmula infantil para exportación a mercados asiáticos, aprovechando la reputación de Canadá en materia de seguridad alimentaria y trazabilidad. El resto de América del Norte, que abarca los mercados del Caribe y América Central, sigue siendo dependiente de las importaciones y sensible al precio, con una capacidad de procesamiento doméstico limitada que restringe el crecimiento a aumentos de la demanda impulsados por la población. Las cadenas de suministro transfronterizas se están consolidando; las exportaciones de queso de los EE. UU. crecieron un 5,5% en 2024, impulsadas por la demanda mexicana de mozzarella y cheddar utilizados en alimentos procesados, mientras que los envíos de concentrado de proteína de suero a México aumentaron un 8% a medida que las marcas locales de nutrición deportiva escalaron la producción.
Panorama Competitivo
El mercado de proteína de leche de América del Norte registra una concentración moderada, con actores como Dairy Farmers of America, Glanbia PLC, Fonterra Co‑operative Group, Hilmar Cheese Company y Leprino Foods Company. Las cooperativas regionales y los procesadores especializados mantienen nichos competitivos en los segmentos orgánico, de alimentación a base de pasto y no transgénico. El énfasis estratégico ha pasado de la consolidación horizontal hacia la integración vertical y la expansión de capacidad; la inversión de USD 200 millones de Dairy Farmers of America en su instalación de Clovis, Nuevo México, en 2024 ejemplifica la preferencia por proyectos en terrenos nuevos y existentes que añaden entre 20.000 y 30.000 toneladas métricas anuales de capacidad de concentrado de proteína de suero en lugar de adquirir competidores.
La desinversión de Glanbia PLC en agosto de 2024 de sus marcas de nutrición de rendimiento para el consumidor a Bain Capital por USD 2.300 millones representa una retirada estratégica de la competencia en el mercado intermedio con los clientes, permitiendo a Glanbia Nutritionals enfocarse en soluciones de ingredientes donde posee tecnologías propietarias de extracción de bioactivos. Están surgiendo oportunidades en la intersección de la fermentación de precisión y el procesamiento lácteo tradicional, donde empresas como Arla Foods Ingredients están presentando notificaciones GRAS para proteínas de leche recombinantes que pueden producirse sin lactosa, permitiendo formulaciones verdaderamente libres de alérgenos para poblaciones sensibles.
Las patentes de tecnología de filtración por membrana presentadas en 2024 revelan una carrera para reducir el consumo de energía y el uso de agua en los procesos de concentración de proteínas, con sistemas de membrana cerámica que demuestran costos operativos entre un 30-40% más bajos que las membranas poliméricas en ensayos a escala piloto. Los actores más pequeños como AMCO Proteins y Actus Nutrition están consolidando posiciones defendibles mediante certificaciones orgánicas y de alimentación a base de pasto que alcanzan primas de precio del 25-35% en el canal minorista natural, una estrategia que los aísla de la volatilidad de precios de las materias primas al mismo tiempo que acceden a consumidores dispuestos a pagar por la procedencia y los atributos de bienestar animal.
Líderes de la Industria de Proteína de Leche de América del Norte
Dairy Farmers of America, Inc.
Glanbia PLC
Fonterra Co‑operative Group
Saputo Inc.
Arla Foods Ingredients Group P/S
- *Nota aclaratoria: los principales jugadores no se ordenaron de un modo en especial

Desarrollos Recientes de la Industria
- Diciembre de 2025: El grupo lácteo neerlandés FrieslandCampina Ingredients anunció planes para adquirir Wisconsin Whey Protein, un productor estadounidense de aislado de proteína de suero, con el fin de ampliar significativamente su capacidad y profundizar su presencia en el mercado de ingredientes de proteína de suero de América del Norte (incluido MPI). La adquisición incluye una expansión planificada de instalaciones que más que duplicará la capacidad de producción de aislado.
- Abril de 2025: El proveedor de análisis de mercado estadounidense Expana lanzó evaluaciones semanales de precios de referencia para el Concentrado de Proteína de Leche al 70% y al 85% (MPC) en el mercado lácteo de los EE. UU., con el propósito de mejorar la transparencia de precios para los principales ingredientes de proteína láctea, un desarrollo importante para los participantes del mercado y la estrategia de precios.
- Marzo de 2025: Arla Foods Ingredients firmó un acuerdo de fabricación por contrato con Valley Queen de Dakota del Sur para aumentar la producción de su gama de concentrado de proteína de suero microparticulado Nutrilac® ProteinBoost en los EE. UU., fortaleciendo su capacidad para atender el creciente mercado de ingredientes lácteos con alto contenido proteico. La producción en la instalación de Milbank está programada para comenzar en el invierno de 2025/26 tras la instalación de equipos de procesamiento especializados.


Alcance del Informe del Mercado de Proteína de Leche de América del Norte
Las proteínas de leche son proteínas derivadas de la leche en diversas formas y niveles de proteína. Los ingredientes de proteína de leche incluyen concentrados de proteína de leche (MPC) a diferentes niveles de proteína y aislados de proteína de leche (MPI), que contienen el típico 80% de caseína y 20% de proteína de suero presentes en la leche. El tamaño del mercado de proteína de leche de América del Norte está segmentado por tipo, aplicación y geografía. Por tipo, el mercado está segmentado en concentrado de proteína de leche, aislado de proteína de leche y proteína de leche hidrolizada. Por aplicación, el mercado está segmentado en alimento para animales, cuidado personal y cosméticos, alimentos y bebidas, y más. Por geografía, el mercado está segmentado en los Estados Unidos, Canadá, México y el Resto de América del Norte. Las previsiones del mercado se proporcionan en términos de valor (USD).
| Concentrado de Proteína de Leche |
| Aislado de Proteína de Leche |
| Proteína de Leche Hidrolizada |
| Alimento para Animales | |
| Cuidado Personal y Cosméticos | |
| Alimentos y Bebidas | Panadería |
| Bebidas | |
| Cereales de Desayuno | |
| Condimentos/Salsas | |
| Productos Lácteos y Alternativas Lácteas | |
| Productos de Carne/Aves de Corral/Mariscos y Alternativas Cárnicas | |
| Productos Alimenticios RTE/RTC | |
| Snacks | |
| Suplementos | Alimentos para Bebés y Fórmula Infantil |
| Nutrición para Personas Mayores y Nutrición Médica | |
| Nutrición Deportiva/de Rendimiento |
| Estados Unidos |
| Canadá |
| México |
| Resto de América del Norte |
| Por Tipo | Concentrado de Proteína de Leche | |
| Aislado de Proteína de Leche | ||
| Proteína de Leche Hidrolizada | ||
| Por Aplicación | Alimento para Animales | |
| Cuidado Personal y Cosméticos | ||
| Alimentos y Bebidas | Panadería | |
| Bebidas | ||
| Cereales de Desayuno | ||
| Condimentos/Salsas | ||
| Productos Lácteos y Alternativas Lácteas | ||
| Productos de Carne/Aves de Corral/Mariscos y Alternativas Cárnicas | ||
| Productos Alimenticios RTE/RTC | ||
| Snacks | ||
| Suplementos | Alimentos para Bebés y Fórmula Infantil | |
| Nutrición para Personas Mayores y Nutrición Médica | ||
| Nutrición Deportiva/de Rendimiento | ||
| Geografía | Estados Unidos | |
| Canadá | ||
| México | ||
| Resto de América del Norte | ||


Preguntas Clave Respondidas en el Informe
¿Cuál es el valor actual del mercado de proteína de leche de América del Norte?
El mercado se sitúa en USD 4,01 mil millones en 2026.
¿A qué velocidad se está expandiendo el segmento de Aislado de Proteína de Leche?
Se prevé que el Aislado de Proteína de Leche crezca a una CAGR del 6,92% entre 2026 y 2031.
¿Cuál es el área de aplicación de mayor crecimiento en América del Norte?
Se proyecta que el segmento de Suplementos registre una CAGR del 5,69% hasta 2031.
¿Por qué México es la geografía de más rápido crecimiento?
La urbanización, el aumento de los ingresos de la clase media y el acceso libre de aranceles a los ingredientes estadounidenses bajo el USMCA están impulsando una perspectiva de CAGR del 6,21%.
Última actualización de la página el:


