
Market Overview
| Study Period | 2020 - 2031 |
|---|---|
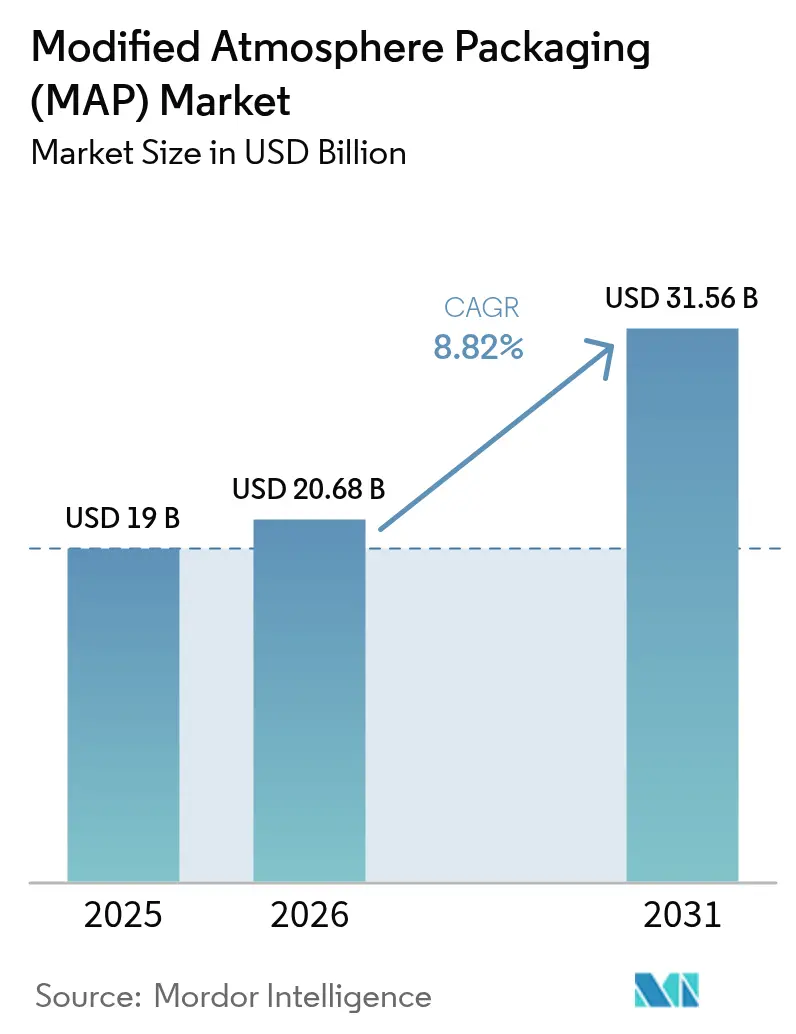
| Market Size (2026) | USD 20.68 Billion |
| Market Size (2031) | USD 31.56 Billion |
| Growth Rate (2026 - 2031) | 8.82 % |
| Fastest Growing Market | Asia Pacific |
| Largest Market | Asia Pacific |
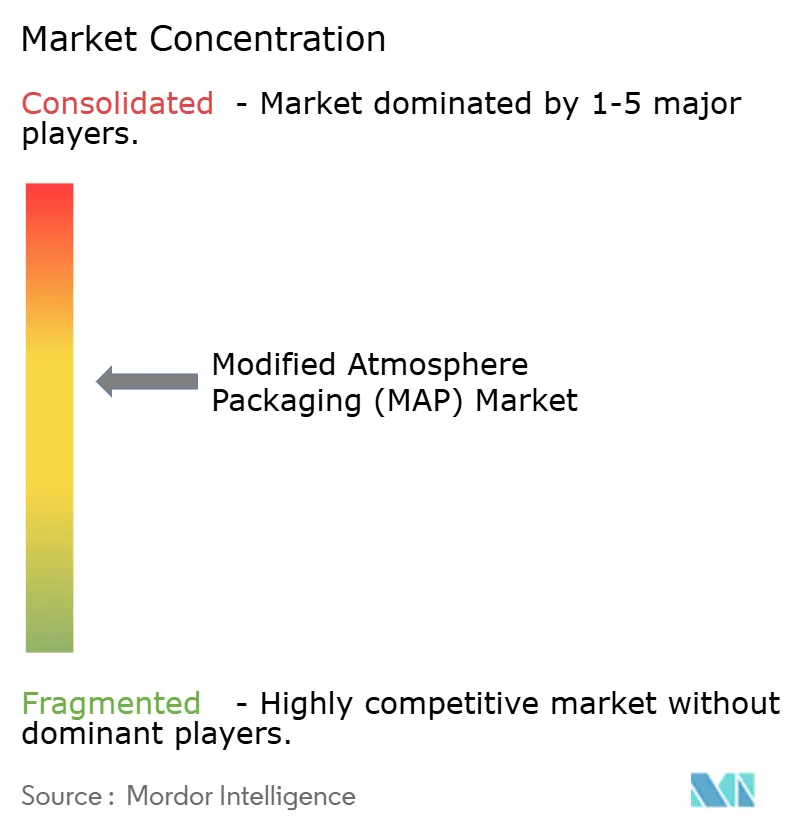
| Market Concentration | Medium |
Major Players *Disclaimer: Major Players sorted in no particular order Image © Mordor Intelligence. Reuse requires attribution under CC BY 4.0. | |
Modified Atmosphere Packaging (MAP) Market Analysis by Mordor Intelligence
The modified atmosphere packaging market size in 2026 is estimated at USD 20.68 billion, growing from 2025 value of USD 19.0 billion with 2031 projections showing USD 31.56 billion, growing at 8.82% CAGR over 2026-2031. Robust e-grocery expansion, stricter food-waste regulations, and rapid advances in smart sensors collectively reposition the modified atmosphere packaging market as a cornerstone of modern food-preservation logistics. Nitrogen remains the most widely used gas because of its inert properties and cost advantage, while carbon dioxide use accelerates in high-protein categories where antimicrobial action is critical. At the material level, polyethylene retains volume leadership, yet compostable films gain momentum as brand owners align with circular-economy mandates. Competitive intensity is moderate: no player exceeds a 15% share, but sustained R&D spending in IoT-enabled equipment is enabling mid-tier firms to challenge incumbents
Key Report Takeaways
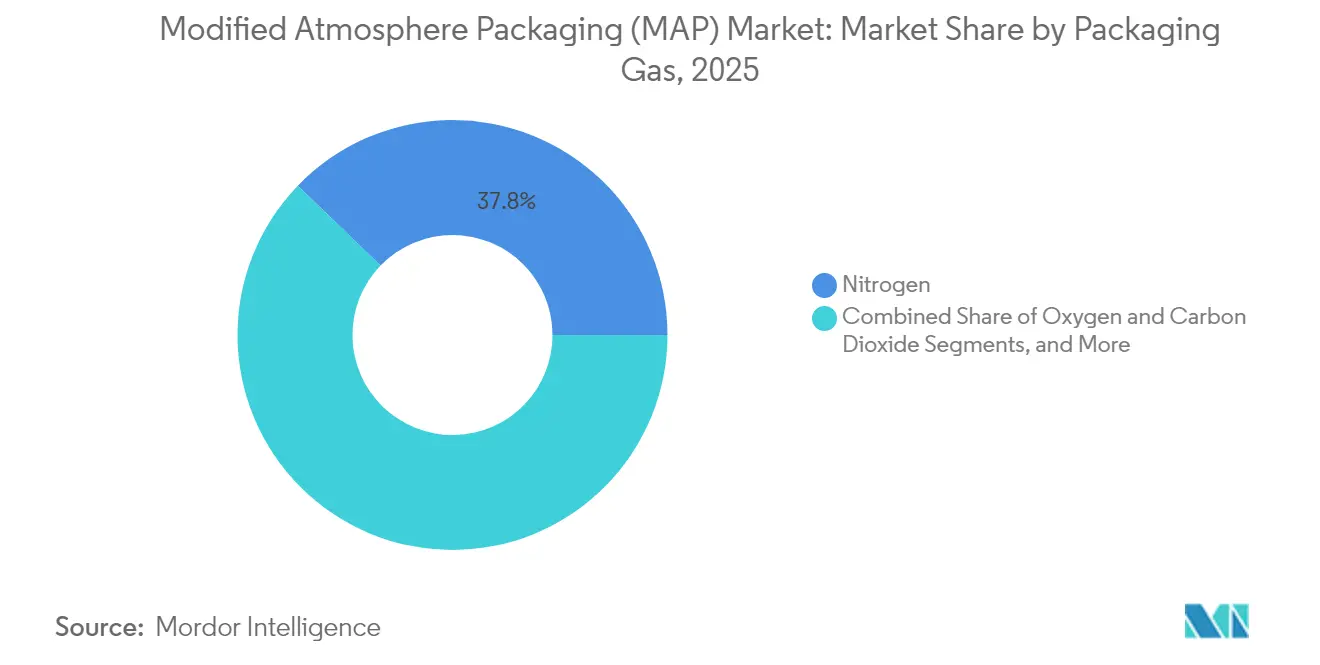
- By gas type, nitrogen led with 37.78% modified atmosphere packaging market share in 2025, whereas carbon dioxide is advancing at a 9.05% CAGR through 2031.
- By packaging material, polyethylene captured 28.96% of the modified atmosphere packaging market size in 2025, while compostable alternatives are forecast to grow 9.94% annually to 2031.
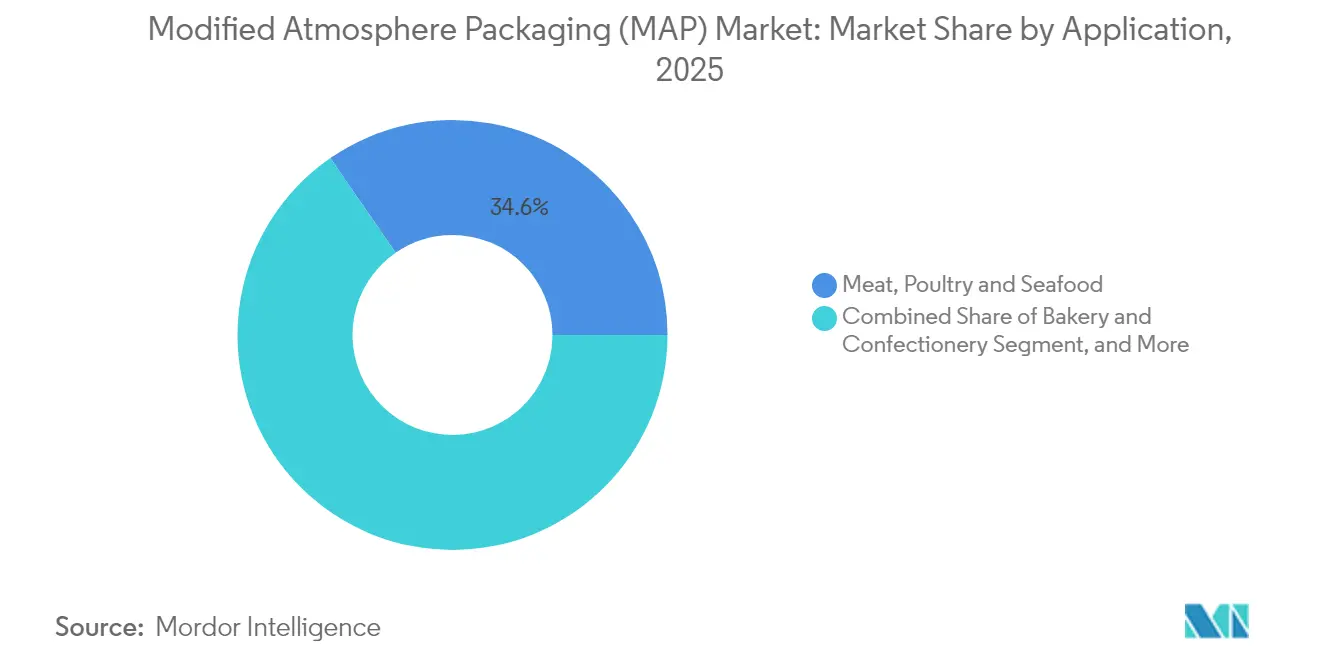
- By application, meat, poultry, and seafood accounted for 34.62% of the modified atmosphere packaging market size in 2025; meal-kit services are registering the highest 9.28% CAGR to 2031.
- By equipment type, tray-sealing machines held 31.63% of the modified atmosphere packaging market share in 2025, whereas vacuum-chamber units are expanding at 9.84% CAGR to 2031.
- By geography, Asia-Pacific commanded 38.22% revenue share in 2025 and remains the fastest-growing region at 10.11% CAGR through 2031.
Note: Market size and forecast figures in this report are generated using Mordor Intelligence’s proprietary estimation framework, updated with the latest available data and insights as of 2026.
Market Trends and Insights
Drivers Impact Analysis of Modified Atmosphere Packaging (MAP) Market*
| Driver | (~) % Impact on CAGR Forecast | Geographic Relevance | Impact Timeline |
|---|---|---|---|
| Surge in e-grocery adoption requiring extended shelf-life | +1.5% | Global; strongest in APAC and North America | Medium term (2-4 years) |
| Regulatory push to cut food waste | +1.2% | EU and North America, spillover to APAC | Long term (≥ 4 years) |
| Emerging cold-chain infrastructure in Africa | +0.8% | Sub-Saharan and North Africa | Long term (≥ 4 years) |
| Clean-label demand for minimally processed foods | +1.1% | North America, EU, urban APAC | Medium term (2-4 years) |
| IoT-enabled dynamic MAP solutions | +0.9% | Global, technology-forward markets first | Short term (≤ 2 years) |
| Growth in compostable MAP films | +0.7% | EU first-mover markets, expanding worldwide | Medium term (2-4 years) |
| Source: Mordor Intelligence | |||
Surge in E-grocery Adoption Requiring Extended Shelf-Life
Rising online grocery penetration lengthens distribution windows from 24 hours to as much as 72 hours, forcing retailers to adopt packages that preserve quality throughout last-mile delivery. Meal-kit leaders now specify nitrogen-flushed trays as standard for proteins, a specification that has already lowered spoilage losses from 8-12% to 3-5% in 2024 operations. Capital spending on vacuum-chamber lines therefore scales proportionally with subscription volume, underpinning long-term demand for modified atmosphere packaging market equipment. Supply-chain data visibility further supports dynamic shelf-life modeling, enabling inventory optimization that benefits both retailers and consumers. Consequently, the modified atmosphere packaging market enjoys a durable demand curve aligned with the growth trajectory of e-commerce food retail.
Regulatory Push to Cut Food Waste
The EU’s Farm-to-Fork Strategy and similar United States guidance single out MAP as a validated tool for achieving 50% waste-reduction targets by 2030. France’s anti-waste law even grants preferential status to retailers implementing certified MAP solutions, nudging procurement toward higher-specification equipment. Export-oriented processors adopt MAP not merely for compliance but also to secure access to high-margin markets in Western Europe and North America. Certification protocols have thus become competitive differentiators, amplifying the modified atmosphere packaging market’s role in global trade flows. The legislative momentum places smaller firms under pressure to upgrade or risk exclusion from lucrative retail contracts, sustaining equipment replacement cycles.
Emerging Cold-Chain Infrastructure in Africa
A USD 2.5 billion African Development Bank program earmarks funds for technologies that curtail post-harvest losses, with MAP explicitly cited among eligible investments . South Africa’s citrus exporters now mandate gas-flush sealing to maintain color and firmness during 20-day sea voyages, creating regional benchmarks quickly replicated in Kenya and Ghana. Nigerian processors attracted USD 800 million in foreign capital in 2024 and embedded MAP capability at the design stage, bypassing retrofit challenges typical in mature markets. As urban demand for packaged proteins rises, integrated cold storage and MAP systems jointly mitigate spoilage, cementing the modified atmosphere packaging market as an essential pillar of Africa’s agri-logistics expansion. Suppliers able to bundle gas, film, and machinery tailored to local conditions gain early-mover advantages.
Clean-Label Demand for Minimally Processed Foods
Consumers pay 15-25% premiums for ingredient lists free of chemical preservatives, prompting brands to replace additives with controlled atmospheres. Nitrogen’s sensory neutrality makes it the gas of choice for organic lines seeking “nothing artificial” claims. Retail buyers have started embedding MAP specifications in procurement tenders, effectively institutionalizing the technology within supply standards rather than optional up-charges. Certification authorities treat MAP as a mechanical process, simplifying organic compliance relative to chemical treatments. This alignment of consumer sentiment, retailer policy, and certification clarity accelerates nitrogen uptake and anchors premium positioning within the modified atmosphere packaging market.
Restraints Impact Analysis of Modified Atmosphere Packaging (MAP) Market*
| Restraint | (~) % Impact on CAGR Forecast | Geographic Relevance | Impact Timeline |
|---|---|---|---|
| High capital outlay for MAP machinery | –1.8% | Global, acute for small and mid-size enterprises | Short term (≤ 2 years) |
| Recycling challenges of multi-layer films | –1.3% | EU, gradually influencing global suppliers | Medium term (2-4 years) |
| Industrial-gas price volatility | –1.1% | Global; energy-intensive regions most affected | Short term (≤ 2 years) |
| CO₂ supply shortages from decarbonization drives | –0.9% | EU and North America, extending to developed Asia | Medium term (2-4 years) |
| Source: Mordor Intelligence | |||
High Capital Outlay for MAP Machinery
Entry-level tray sealers with gas-flush modules start near USD 200,000, while high-throughput vacuum-chamber systems surpass USD 600,000, sums that equal 15-20% of annual sales for typical SMEs. Traditional lenders hesitate because resale values are opaque and technology risk is poorly understood. Maintenance contracts add 12-15% of purchase price annually, stretching cash flows and slowing payback periods. Consequently, large processors consolidate share, widening scale advantages and nudging the modified atmosphere packaging market toward moderate concentration. Vendor-financing programs and government grants partially offset the barrier, but funding gaps persist, particularly in emerging economies.
Recycling Challenges of Multi-Layer Films
Essential barrier films often combine polyethylene, polyamide, and metalized layers that current recycling plants cannot separate, exposing brand owners to escalating EU eco-modulation fees. Retailers such as Tesco require suppliers to shift to recyclable or compostable films by 2027, a timeline that forces technical overhauls. Compostable options demand 20-30% thicker gauges to match barrier performance, increasing material costs and sometimes stressing packaging lines calibrated for thin films. Until mono-material solutions scale, sustainability targets and food-safety requirements remain in tension, constraining growth in segments sensitive to environmental scrutiny within the modified atmosphere packaging market.
*Our forecasts treat driver/restraint impacts as directional, not additive. The impact forecasts reflect baseline growth, mix effects, and variable interactions.
Modified Atmosphere Packaging (MAP) Market Segment Analysis
By Packaging Gas:
Nitrogen Dominance Faces Dynamic CompetitionNitrogen retained 37.78% modified atmosphere packaging market share in 2025, reflecting its affordability and broad applicability in oxygen-sensitive categories. Carbon dioxide usage, however, is climbing at a 9.05% CAGR thanks to superior antimicrobial efficacy in proteins that command premium shelf-life extensions. Precision mixers able to regulate head-space to ±0.3% unlock product-specific recipes, gradually shifting the modified atmosphere packaging market size outlook toward multi-gas solutions.
Further differentiation arises as processors integrate inline sensors that adjust flow rates in real time, mitigating over-flush and trimming gas consumption by 12-15% . Oxygen retains niche relevance in fresh-cut produce where controlled levels preserve color, while argon appears in delicate confectionery demanding zero flavor carry-over. Long term, carbon-neutral CO₂ captured from bio-ethanol plants could stabilize supply, insulating the modified atmosphere packaging industry from current price shocks.

By Packaging Material:
Sustainability Drives InnovationPolyethylene kept 28.96% revenue share in 2025 because of consistent barrier performance and line familiarity, yet compostables expanded 9.94% annually as cost gaps narrowed and regulatory fees intensified. The modified atmosphere packaging market size for mono-material solutions is set to rise as metallized PLA films achieve oxygen transmission rates rivaling PET-aluminum laminates.
Material R&D now targets downgauging without compromising seal integrity, with pilot lines showing 8-10% resin savings per pouch at equal puncture resistance. Recycling-ready PE/PE structures compatible with store-drop streams help brand owners meet 2027 retailer mandates, offsetting fee exposure. As scale accelerates, compostable films are projected to command double-digit share by 2031, reflecting the sustainability pivot reshaping the modified atmosphere packaging industry.
By Application:
Protein Products Lead GrowthMeat, poultry, and seafood captured 34.62% of the modified atmosphere packaging market size in 2025, underscoring the category’s susceptibility to microbial spoilage and discoloration . Meal-kit services, though smaller in absolute terms, top growth charts at 9.28% CAGR by virtue of subscription-based demand predictability and stringent freshness KPIs.
Retail produce programs deploy high-oxygen blends to delay enzymatic browning, while bakery manufacturers leverage nitrogen to arrest mold formation. The modified atmosphere packaging market thus diversifies across value chains, with portion-controlled trays and multi-compartment pouches enabling cross-ingredient convenience sought by dual-income households. Innovation in breathable membranes for respiring produce further expands use cases and lowers rejection rates at retail docks.
By Equipment Type:
Automation Drives EfficiencyTray sealers held 31.63% modified atmosphere packaging market share in 2025 because of format flexibility and mid-range throughput ideally suited to varied SKUs. Vacuum-chamber machines, aided by 9.84% CAGR, resonate with processors managing irregular shapes or high-margin cuts demanding near-zero residual oxygen.
Touchscreen HMI and recipe storage reduce changeover from 30 minutes to under 8 minutes, enhancing uptime. Integrated printers now apply QR codes for traceability directly on pouches, fulfilling retailer transparency mandates. As labor scarcity intensifies, full-line robotics from tray denesters to case packers becomes standard, elevating capital requirements but also deepening total addressable value within the modified atmosphere packaging industry.
Geography Analysis
APAC Modified Atmosphere Packaging (MAP) Market
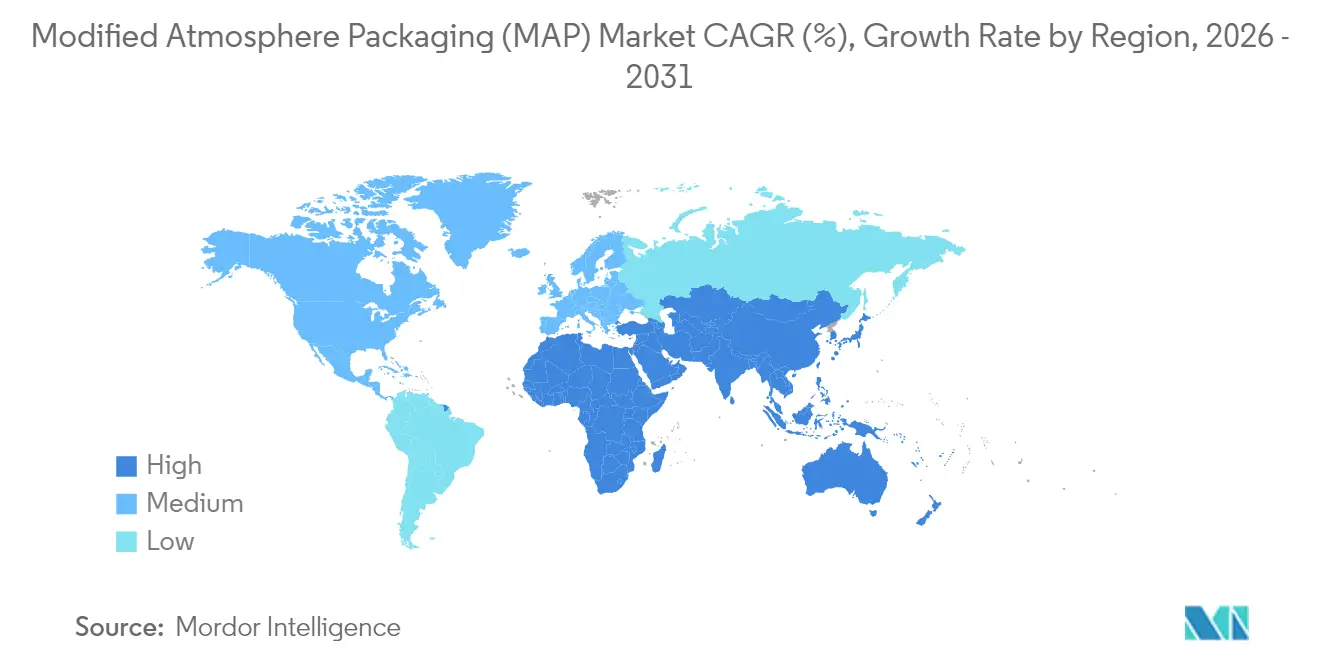
Asia-Pacific anchored 38.22% revenue in 2025 and is on track to post a 10.11% CAGR to 2031, propelled by urban migration, expanding cold chains, and rising middle-class food-safety expectations. China accelerates adoption under its “Zero Food Waste” policy that subsidizes smart packaging, while India’s organized retail growth steers processors toward higher-specification MAP lines.
North America and Europe Modified Atmosphere Packaging (MAP) Market
North America remains a steady yet innovation-intensive arena where e-grocery fulfillment centers demand IoT-ready machines that synchronize with inventory-management systems. Europe’s roadmap centers on waste-reduction and circular-economy directives, making compostable solutions a disproportionate driver of regional modified atmosphere packaging market growth
MEA and LATAM Modified Atmosphere Packaging (MAP) Market
The Middle East and Africa record single-digit share but double-digit growth as logistics corridors mature; South-Africa’s citrus exporters set quality benchmarks influencing neighboring nations, illustrating how export requirements cascade through regional value chains. Latin America, while smaller, witnesses beef processors adopting hybrid nitrogen-CO₂ blends to meet U.S. import regulations, underscoring regulatory convergence that aligns global modified atmosphere packaging industry standards.
Regulatory Landscape
Modified atmosphere packaging (MAP) solutions sit within food-contact and food-safety compliance regimes that cover packaging materials, additives, and manufacturing controls. In the European Union, Regulation (EC) No 1935/2004 provides the overarching framework for food contact materials (including active and intelligent materials used to extend shelf life), while Commission Regulation (EC) No 2023/2006 sets Good Manufacturing Practice (GMP) requirements across food-contact material manufacturing, processing, and distribution. In the United States, the FDA Food Contact Substance (FCS) Notification Program (created under the Food and Drug Administration Modernization Act of 1997) is a primary premarket authorization pathway for substances used in packaging, and 21 CFR 170.100 reflects the premarket notification approach tied to demonstrating safety for intended technical effect.
Regulatory processes are also becoming more digitized, which changes how quickly MAP-related materials and components can be authorized and implemented on commercial packaging lines. By mid-2026, the FDA Centralized Online Submission Module (COSM) functions as the primary electronic interface for submitting Food Contact Notifications and related filings, shaping the compliance workflow for suppliers introducing new barrier structures, coatings, and other food-contact substances used in MAP systems. Differences in regional acceptance of specific gases or additives can still complicate harmonization for global food exporters and multinational packaging suppliers.
Value Chain Analysis
The MAP value chain connects resin and specialty-material suppliers (barrier films and sealants), packaging converters (films, lidding, trays), industrial gas suppliers (nitrogen, carbon dioxide, oxygen and blends), and equipment OEMs (tray sealers, vacuum chamber systems, and inline quality-control hardware). Downstream, food processors and packers translate shelf-life and appearance requirements into application specifications, notably proteins, produce, and meal-kits, while cold-chain logistics providers and retailers enforce performance and compliance documentation through procurement requirements. As smart sensors and in-line controls are added to reduce residual-gas drift and limit over-flush, software and service layers (installation, validation, maintenance contracts, and monitoring) become a larger part of total solution delivery.
Bottlenecks often appear where performance requirements intersect with sustainability and compliance timelines, particularly when multilayer barrier structures face recycling constraints and qualification cycles for new recyclable structures stretch across multiple product and line-validation iterations. Europe acts as a reference point for documented food-contact compliance, including alignment with EU framework rules such as Regulation (EC) No 1935/2004 and related plastics measures, and this can cascade into global supplier specifications. On the demand side, MAP-enabled shelf-life extension supports longer distribution windows and modal shifts in fresh supply chains; for example, StePac PPC positions specialized films that help fresh produce move from air freight to sea freight, linking packaging performance to logistics economics and waste reduction.
Competitive Landscape
Tier-one multinationals Amcor, Sealed Air, and Linde each command 8-12% individual share, leaving roughly 60-65% fragmented among regional converters, gas suppliers, and equipment specialists. Vertical integration defines recent M&A activity: ProMach’s acquisitions knit film, filling, and sealing assets into turnkey offerings that lower customer integration risk.[1]
Innovation pipelines concentrate on sensor-laden pouches and machine-learning algorithms that predict residual-gas drift, pushing the modified atmosphere packaging market toward data-centric service models. Established players bundle gas supply contracts with equipment leases, creating sticky customer relationships and recurring revenue.
Smaller firms differentiate via application focus such as seafood-specific films or geography, leveraging localized distribution to outcompete multinationals on service responsiveness. Smart-equipment retrofits represent a fertile playing field, as brownfield plants seek to upgrade without wholesale line replacement. Patent filings in 2024 targeted bio-based barrier coatings and cloud analytics, validating the dual themes of sustainability and digitalization shaping the modified atmosphere packaging industry.
Modified Atmosphere Packaging (MAP) Industry Leaders
-
Sealed Air Corporation
-
Amcor PLC
-
Linde AG
-
Praxair Packaging Solutions LLC
-
Air Products and Chemicals Inc.
- *Disclaimer: Major Players sorted in no particular order
Modified Atmosphere Packaging (MAP) Market Companies Covered in this Report
- Amcor plc
- Sealed Air Corporation
- Linde plc
- Air Products and Chemicals Inc.
- Praxair Packaging Solutions LLC
- Mondi Group plc
- Multisorb Technologies Inc.
- StePac Ltd.
- Robert Reiser and Co. Inc.
- Wespertech s.r.o.
- CV Thermoformers Ltd.
- Orics Industries Inc.
- Ilapak International SA
- GEA Group AG
- Ulma Packaging S. Coop.
- Harpak-Ulma Packaging LLC
- CVP Systems Inc.
- Wipak Oy
- Coveris Holdings SA
Read Analysis of Modified Atmosphere Packaging (MAP) Companies
Market Opportunities and Future Outlook
A clear whitespace is upgrading installed MAP bases with higher-throughput sealing and stronger process control, particularly where e-grocery and meal-kit operations need longer distribution windows and tighter freshness KPIs. In June 2026, Amcor installed the first Moda rotary vacuum chamber sealing technology in Brazil at Barra Mansa Alimentos, replacing nine belt chamber machines with three rotary units. This points to equipment modernization for throughput gains and vacuum consistency, rather than purely incremental line tweaks, creating adjacent opportunity for converters and gas suppliers that can bundle validated materials, optimized gas recipes, and equipment settings into repeatable application playbooks for proteins and convenience foods.
Regulatory and sustainability-driven redesign is another opportunity area that is shifting development toward recyclable mono-material and alternative barrier structures that still meet MAP performance needs. In February 2026, the European Commission enacted Regulation (EU) 2026/245 updating authorized substances for plastic food-contact materials under Regulation (EU) No 10/2011, reinforcing the need for compliance-ready formulations when converters adjust barrier packages. In India, FSSAI draft amendments to the Food Safety and Standards (Packaging) Regulations, 2018 (published in February 2026) explicitly define modified atmosphere packaging and address concepts such as food contact materials and non-intentionally added substances (NIAS), which supports compliance-led adoption for organized retail and export-oriented processors that need clearer definitions and documentation. Together, these proof points favor suppliers that can shorten qualification cycles through pre-validated structures, testing support, and traceable digital compliance packages across regions.
Recent Industry Developments in Modified Atmosphere Packaging (MAP) Market
- June 2026: Amcor installed the first Moda rotary vacuum chamber sealing technology in Brazil at Barra Mansa Alimentos, replacing nine belt chamber machines with three rotary units. The installation highlights a processor-led push toward higher throughput and tighter vacuum consistency in MAP operations, supporting broader demand for rotary sealing architectures and line-optimization services.
- May 2026: TransFRESH Corporation acquired Hazel Technologies, integrating Hazel's Breatheway modified atmosphere packaging technology into its freshness solutions portfolio for the berry supply chain. The deal strengthens end-to-end offerings that combine packaging with post-harvest and logistics tools, increasing competitive pressure on niche MAP providers serving high-value produce categories.
- April 2025: Syntegon revealed the Pack 103 flow-wrapper reaching 175 packs per minute for small and mid-sized businesses upgrading MAP capability. The release expands access to higher-speed MAP-ready equipment for customers constrained by capital outlay, reinforcing the role of OEM innovation in lowering operational barriers to adoption.
Modified Atmosphere Packaging (MAP) Market Report Scope and Research Methodology
Market Definition and Coverage
For this methodology, the modified atmosphere packaging market covers packaging solutions and related equipment that change or control the gas mix inside a pack to slow spoilage and extend shelf life, mainly for perishable foods across global end users.
Scope exclusions: It does not count conventional packaging that does not actively manage the internal atmosphere, and it excludes downstream cold chain services and retailing margins.
Segments Covered in This Report
- By Packaging Gas
- Oxygen
- Nitrogen
- Carbon Dioxide
- Other Packaging Gases
- By Packaging Material
- Polyethylene (PE)
- Polypropylene (PP)
- Polyethylene Terephthalate (PET)
- Compostable
- Other Packaging Materials
- By Application
- Fruits and Vegetables
- Meat, Poultry and Seafood
- Bakery and Confectionery
- Online Grocery Meal-Kits
- Other Applications
- By Equipment Type
- Tray-Sealing Machines
- Form-Fill-Seal Systems
- Bag-Sealing Machines
- Vacuum Chamber Machines
- Other Equipment Types
- By Geography
- North America
- United States
- Canada
- Mexico
- South America
- Brazil
- Argentina
- Chile
- Rest of South America
- Europe
- United Kingdom
- Germany
- France
- Spain
- Italy
- Rest of Europe
- Asia-Pacific
- China
- India
- Japan
- Australia
- South Korea
- Vietnam
- Rest of Asia-Pacific
- Middle East and Africa
- Middle East
- Saudi Arabia
- United Arab Emirates
- Turkey
- Rest of Middle East
- Africa
- South Africa
- Nigeria
- Egypt
- Rest of Africa
- Middle East
- North America
Data Sources, Market Sizing, and Validation
Desk Research
Desk research was used to set the fact base for demand drivers and packaging usage patterns, and then to cross-check the direction of our estimates. We reviewed public sources such as the FAO for food production trends, UN Comtrade for trade flows in food categories that heavily use MAP, and the US FDA plus the European Commission for food contact and labeling signals that shape packaging adoption.
To keep assumptions realistic, we also referred to sources such as USDA and Eurostat for processed and fresh food volumes, along with peer-reviewed papers on shelf-life extension and gas composition outcomes. Company annual reports, investor presentations, and reputable press were used to understand capacity additions, material shifts (film choices in particular), and pricing narratives, and paid subscription coverage for company financials, patents, and shipment-level trade intelligence was used selectively to fill data gaps. These desk sources are illustrative and not exhaustive, and many other public references were also used for validation and clarification.
Primary Interviews and Surveys
Primary interviews and structured surveys were used to test what we built from public indicators, especially for application-level adoption, typical pack formats, and practical pricing ranges. We spoke with a mix of packaging converters, film and gas ecosystem participants, equipment-side experts, and food processors across major consuming regions, so assumptions could be corrected before the final totals were locked.
Distribution of primary research fieldwork respondents
| Company type | Respondent position | Region |
|---|---|---|
| Top tier: 37% | CXOs: 22% | APAC: 41% |
| Mid tier: 41% | Functional/Unit leaders: 25% | EMEA: 33% |
| Smaller Players: 22% | Managers: 53% | Americas: 26% |
Market-Sizing & Forecasting
Our sizing starts with a top-down approach where food production and trade series are used to reconstruct a realistic demand pool for MAP-ready categories, which is then filtered through adoption rates by application. The totals are corroborated with selective bottom-up approximations, such as sampled converter revenues, equipment install-base checks, and typical ASP times volume ranges, which helps adjust for under-coverage in any single signal.
Key inputs include packaged meat and seafood throughput, fresh produce export volumes, penetration of tray-seal versus flexible formats, film material mix shifts, and average pack price movements in major regions. Where direct observations were limited, gaps were handled by using proxy ratios from similar food categories and then re-tested with interview feedback until the variance narrowed.
For forecasting, scenario analysis was used because adoption is sensitive to regulation, food waste targets, and cold chain readiness, which can change by region and year. Growth paths were then stress-tested against expected changes in perishable food consumption, convenience food share, and equipment investment cycles, and the final trajectory was aligned to what industry participants describe as a practical ramp rather than a purely aggressive curve.
Data Validation & Update Cycle
Validation is done through repeated triangulation across independent checks, including comparing implied MAP spend per ton of targeted foods against observed packaging economics and reported material trends. Outliers are flagged early, and assumptions are re-checked with follow-up calls when the model output moves beyond reasonable ranges for penetration or pricing.
Before sign-off, the workbook goes through a multi-step review where another analyst checks formulas, unit consistency, currency timing, and whether inputs match the stated scope. Reports are refreshed annually, with interim updates when material events occur, such as regulatory changes, major capacity additions, or large resin price moves, and a final pre-delivery pass is completed so clients receive the most current view.
Mordor Intelligence's Modified Atmosphere Packaging Market Size Compared With Other Published Estimates
Published market sizes for modified atmosphere packaging can differ even when the topic sounds identical, because each publisher draws the boundary of what counts and then uses different price and adoption assumptions. Differences also show up when the base year is not the same, or when regional weighting is handled using different consumption indicators.
Food output trends, perishable trade flows, and pack-format penetration checks are the evidence that keeps Mordor Intelligence's estimate anchored to a defined MAP demand pool rather than a broad packaging spend bucket.
Benchmark comparison
| Source | Market Size | Gaps in Research Methodology |
|---|---|---|
| Mordor Intelligence | USD 20.68 B (2026) | |
| Industry Publisher A | USD 16.03 B (2024) | Uses an earlier base year and a different pricing stack, which can understate the impact of recent MAP adoption in fresh and processed food lines and can shift currency timing effects. |
| Industry Publisher B | USD 21.15 B (2025) | Uses a different base year and may apply broader inclusion around packaging solutions, so adjacent packaging spend can be blended into MAP in cases where the atmosphere-control boundary is not tested at the application level. |
The spread across the three numbers is mostly explained by base-year alignment and how tightly the scope is kept to true atmosphere-control packaging versus nearby categories. By tying assumptions back to food volume signals, adoption checks, and practical pricing ranges that can be re-tested, the final result stays transparent and repeatable for planning use.
Key Questions Answered in the Report
How big is the Modified Atmosphere Packaging (MAP) Market?
The Modified Atmosphere Packaging (MAP) Market size is worth USD 20.68 billion in 2026, growing at an 8.82% CAGR and is forecast to hit USD 31.56 billion by 2031.
What is the current Modified Atmosphere Packaging (MAP) Market size?
In 2026, the Modified Atmosphere Packaging (MAP) Market size is expected to reach USD 20.68 billion.
What is modified atmosphere packaging and how does it extend shelf life?
It replaces the air inside a pack with a controlled mix—usually nitrogen or carbon dioxide—to slow microbial growth, oxidation, and moisture loss, thereby extending shelf life by several days to weeks depending on the food category.
Which gas is used most widely for meat, poultry, and seafood packs?
Carbon dioxide is favored for proteins because its antimicrobial action significantly cuts spoilage, helping this segment grow at a 9.05% CAGR through 2031.
How fast is Asia-Pacific demand for this technology expanding?
Asia-Pacific sales are rising at a 10.11% CAGR to 2031, reflecting urbanization, new cold-chain capacity, and government support for food-processing upgrades.
Are compostable films compatible with nitrogen-flush or CO₂-flush applications?
Yes; new metallized PLA and mono-material PLA/PLA films now deliver oxygen transmission rates low enough for MAP while meeting industrial-composting standards.
Which equipment category is gaining the most traction through 2031?
Vacuum-chamber machines are the fastest-growing at a 9.84% CAGR because they handle varied product shapes and achieve very low residual oxygen levels.
How do food-waste regulations influence adoption of this technology?
EU and U.S. policies targeting 50% waste reduction by 2031 recognize MAP as a validated solution, prompting retailers and exporters to require certified MAP lines in supplier contracts.