
Market Overview
| Study Period | 2020 - 2031 |
|---|---|
| Forecast Data Period | 2026 - 2031 |
| Base Year Market Size (2025) | USD 240.55 Billion |
| Market Size (2026) | USD 257.63 Billion |
| Market Size (2031) | USD 363.03 Billion |
| Growth Rate (2026 - 2031) | 7.10 % |
| Market Concentration | Low |
Major Players *Disclaimer: Major Players sorted in no particular order Image © Mordor Intelligence. Reuse requires attribution under CC BY 4.0. | |
Africa Construction Market Analysis by Mordor Intelligence
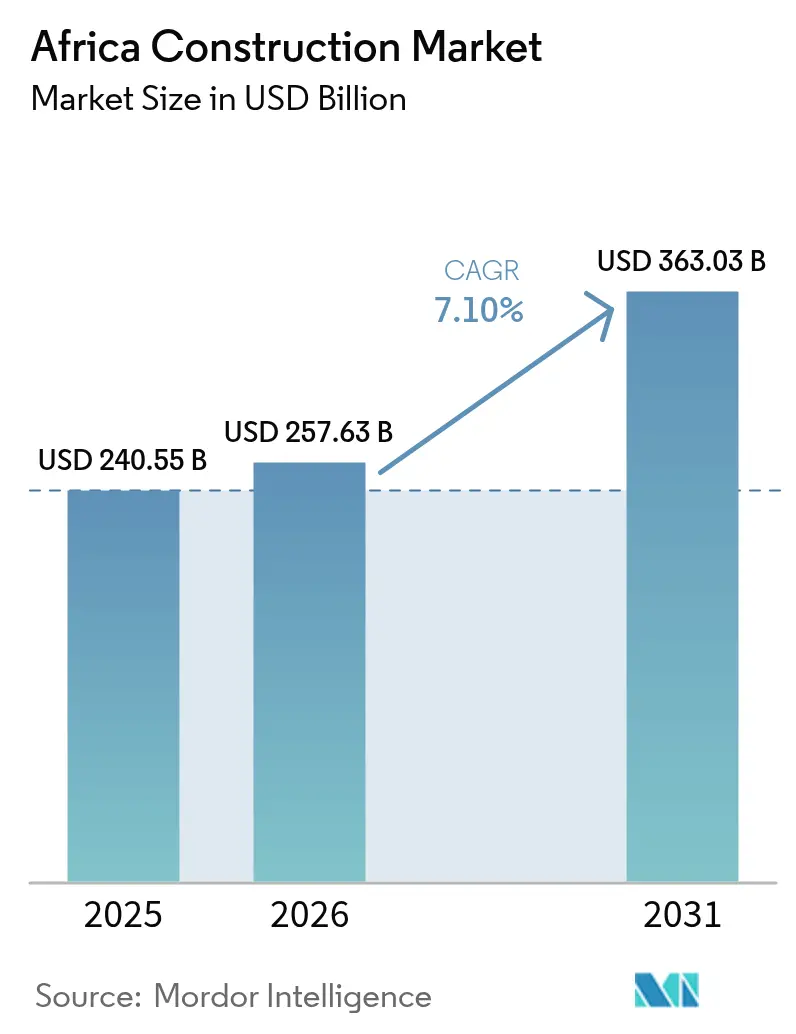
The Africa Construction Market size was valued at USD 240.55 billion in 2025 and estimated to grow from USD 257.63 billion in 2026 to reach USD 363.03 billion by 2031, at a CAGR of 7.1% during the forecast period (2026-2031). Rapid urban migration, the African Continental Free Trade Area (AfCFTA) rollout, and heightened government focus on connectivity projects are combining to lift contract backlogs across all major markets. Multilateral lenders continue to anchor funding for transnational logistics corridors, while climate-related finance mechanisms are unlocking capital for water security, renewable power, and green-building initiatives. Rising private-sector participation, particularly through public-private partnerships (PPPs), is beginning to rebalance a historically public-led ecosystem, enhancing project delivery discipline and technology uptake. Construction methods are also modernizing as modular and prefabricated solutions gain traction, addressing skilled labor bottlenecks and accelerating build times in densely populated cities.
Key Report Takeaways
- By sector, residential led with 38.02% revenue share of the Africa construction market size in 2025, while infrastructure is projected to advance at a 9.05% CAGR through 2031.
- By construction type, new builds commanded 71.05% of the Africa construction market share in 2025, whereas renovation is set to expand at a 9.2% CAGR to 2031.
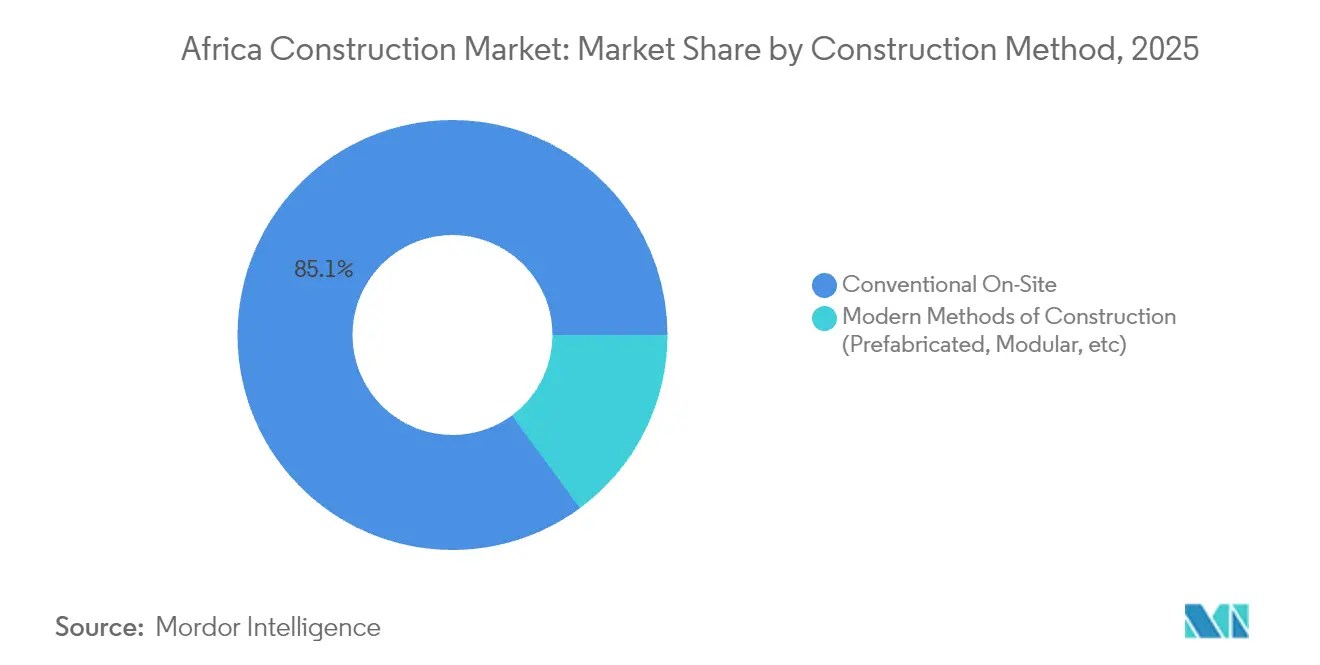
- By construction method, conventional on-site techniques retained an 85.10% share in 2025; prefabricated and modular approaches are the fastest growing at a 9.6% CAGR.
- By investment source, public spending held 75.90% of the Africa construction market size in 2025, although private funding via PPPs is forecast to climb at a 10.4% CAGR.
- By geography, Egypt captured 37.30% of the Africa construction market in 2025, whereas Kenya is the fastest-growing country at a 8.9% CAGR to 2031.
Note: Market size and forecast figures in this report are generated using Mordor Intelligence’s proprietary estimation framework, updated with the latest available data and insights as of 2026.
Market Trends and Insights
Drivers Impact Analysis of Africa Construction Market*
| Driver | (~) % Impact on CAGR Forecast | Geographic Relevance | Impact Timeline |
|---|---|---|---|
| Rapid urbanization & housing backlog | +1.2% | Nigeria, Kenya, Ethiopia | Long term (≥ 4 years) |
| Economic diversification & GDP rebound | +0.8% | Egypt, South Africa, Morocco, Ghana | Medium term (2-4 years) |
| Government-backed infrastructure programs & PPP pipelines | +0.9% | Egypt, Kenya, Morocco | Medium term (2-4 years) |
| Expansion of pan-African logistics corridors | +0.7% | East Africa corridor, West Africa coastal routes | Long term (≥ 4 years) |
| Green-building finance inflows | +0.6% | South Africa, Morocco, Kenya, Nigeria | Medium term (2-4 years) |
| AfCFTA-linked industrial park developments | +0.5% | Ghana, Rwanda, Ethiopia, Morocco | Long term (≥ 4 years) |
| Source: Mordor Intelligence | |||
Rapid Urbanization & Housing Backlog
Africa’s urban population is forecast to double to 1.4 billion by 2050, creating an immediate housing imperative that stretches across major capitals and secondary cities. The current deficit of 51 million affordable units puts sustained pressure on public budgets and spurs innovative financing, including mortgage-backed securities and diaspora bonds. Kenya’s two-million-unit shortfall has pushed authorities to mandate 250,000 new affordable homes annually, injecting steady volume into the Africa construction market. Nigeria’s demographic surge toward 401.31 million people by 2050 further amplifies demand for formal housing and supporting utilities. Smaller economies such as Zimbabwe are also scaling initiatives—for example, a 220,000-unit program slated for completion by 2025—highlighting region-wide momentum.
Economic Diversification & GDP Rebound
Post-pandemic fiscal strategies are channeling recovery funds into infrastructure that underpins manufacturing, services, and renewable energy goals. Morocco targets 52% renewable power in its generation mix by 2030, driving utility-scale construction and grid upgrades. Egypt’s New Administrative Capital and South Africa’s USD 54 billion infrastructure plan illustrate how megaproject pipelines can catalyze private investment and job creation. Ghana’s macro-stabilization under international support has revived flagship transport schemes, restoring contractor order books and reducing financing spreads. These diversification agendas sustain multipliers that reinforce long-run demand for civil works, commercial premises, and industrial zones across the Africa construction market[1].
Government-Backed Infrastructure Programs & PPP Pipelines
Seventy-eight percent of African economies now maintain PPP-specific regulations, lifting average annual infrastructure investment by USD 488 million where frameworks are robust. Ethiopia’s USD 7.8 billion Bishoftu Airport and Morocco’s USD 10 billion rail plan are emblematic of how PPP structuring enables transformative assets without unduly stretching public debt limits. Transparent risk-allocation models and standardized concession templates are shortening financial close timelines, bringing global lenders and contractors deeper into the Africa construction market. Capacity-building programs by multilateral agencies also improve contract oversight, mitigating historic cost overrun patterns and bolstering investor confidence.
Expansion of Pan-African Logistics Corridors
AfCFTA implementation has triggered parallel investments in roads, rail, ports, and dry ports that knit together regional value chains. Since 2024, over USD 15 billion has flowed into the Northern Corridor linking Kenya, Uganda, Rwanda, and South Sudan, cutting transit times by up to 40% on key trade routes. The Abidjan-Lagos coastal highway and Morocco’s new Mauritania crossing support metals, agri-business, and tourism flows, reinforcing demand for bridges, tunnels, and service centers. Corridor-led industrial nodes generate follow-on commercial and residential schemes, multiplying contract opportunities in the wider Africa construction market[2].
Restraints Impact Analysis of Africa Construction Market*
| Restraint | (~) % Impact on CAGR Forecast | Geographic Relevance | Impact Timeline |
|---|---|---|---|
| Political-regulatory volatility & contract risk | -0.9% | Sahel, parts of East Africa, select West Africa | Short term (≤ 2 years) |
| Skilled-labor deficits & productivity gaps | -0.8% | Most fast-growing markets | Medium term (2-4 years) |
| Hard-currency shortage & capital-controls risk | -0.6% | Nigeria, Ghana, Zambia, Malawi, Ethiopia | Short term (≤ 2 years) |
| Climatic shocks driving insurance & rebuild costs | -0.5% | Sahel, East Africa, Southern Africa drought zones | Long term (≥ 4 years) |
| Source: Mordor Intelligence | |||
Political-Regulatory Volatility & Contract Risk
Security incidents in the Sahel and sudden policy reversals elsewhere have raised political-risk premiums, pressuring contractor margins and insurance costs. Project suspensions by several global firms underscore the sensitivity of the Africa construction industry to governance instability. Retroactive rule changes, such as new localization quotas, can distort project economics and delay execution timetables. Currency volatility adds a second-order impact by inflating imported material costs and undermining debt-service capacity for foreign-currency loans. These uncertainties prompt risk-sharing mechanisms and demand contractual safeguards that lengthen negotiation cycles.
Skilled-Labor Deficits & Productivity Gaps
Demand for masons, plumbers, and BIM technicians consistently outstrips supply, leading to wage spikes and project overruns in hubs such as Johannesburg and Nairobi. Training academies lag output targets, while migration funnels skilled workers toward higher-pay Gulf markets. Limited on-site automation means productivity still relies heavily on manual processes, amplifying the impact of labor shortfalls. The adoption of digital twins and off-site fabrication is constrained by uneven broadband penetration and high equipment costs, further widening the capability gap.
*Our forecasts treat driver/restraint impacts as directional, not additive. The impact forecasts reflect baseline growth, mix effects, and variable interactions.
Africa Construction Market Segment Analysis
By Sector:
Infrastructure Drives Long-Term GrowthInfrastructure commands the fastest 9.05% CAGR within the Africa construction market, energized by flagship transport, energy, and water projects that enhance regional integration and climate resilience. Residential retained a 38.02% share of the Africa construction market size in 2025, buoyed by housing backlog programs and mortgage market reforms. Commercial schemes trail but remain significant, tracking the expansion of retail chains and multinational head-office relocations.
Mass-transit rail in Egypt, the USD 7.8 billion Bishoftu Airport in Ethiopia, and Morocco’s USD 40 billion water-security master plan anchor multiyear capital commitments, providing visibility to contractors and suppliers. Meanwhile, AfCFTA-enabled industrial estates stimulate warehousing and light-manufacturing structures, bridging infrastructure and commercial sub-sectors. As governments mainstream climate adaptation, infrastructure outlays increasingly cover levee upgrades, desalination plants, and smart-grid deployments, thereby diversifying contractor scope within the Africa construction market.


By Construction Type:
Renovation Gains MomentumNew builds ruled with a hefty 71.05% Africa construction market share in 2025, mirroring the continent’s infrastructure gap and swelling city footprints. Renovation, however, is projected to outpace at a 9.2% CAGR, propelled by asset-life extension and energy-retrofit mandates, particularly in middle-income economies.
South Africa’s refurbishment of apartheid-era commercial towers and Ghana’s school-rehabilitation programs illustrate how aging assets pivot capital toward retrofits. Climate-resilience spending further accelerates facade upgrades, waterproofing, and insulation improvements. Contractors with diagnostic-survey and BIM reverse-engineering capabilities are positioned to capture this climbing renovation slice of the Africa construction market.
By Construction Method:
Technology Adoption AcceleratesConventional techniques still dominate 85.10% of contracts, yet modular and prefabricated systems are forecast to expand at 9.6% CAGR through 2031. Modular dormitories for mining camps in South Africa and factory-built housing shells in Lagos highlight on-site labor savings and quality gains.
Government pilot schemes in Tanzania now mandate Building Information Modeling for select public projects, signaling policy support for digital workflows. Cost-certainty, faster schedules, and reduced waste resonate with developers contending with skilled-labor shortages, thereby accelerating technology penetration across the wider Africa construction market.
By Investment Source:
Private Sector Participation SurgesPublic expenditure accounted for 75.90% of 2025 spending, but private inflows through PPPs are set to grow 10.4% annually as fiscal headroom narrows. China’s pivot toward equity-based PPP stakes rather than sovereign loans exemplifies changing deal structures.
The USD 350 million Tema Motorway PPP in Ghana demonstrates how shared-risk frameworks mobilize domestic pension funds and foreign institutional capital. Climate-bond issuances and blended-finance vehicles expand the investable universe further, embedding ESG metrics that attract global asset managers searching for yield in the Africa construction market.
Geography Analysis
Egypt Construction Market
Egypt retained 37.30% of the Africa construction market in 2025, leveraging a mature contractor base and steady mega-project flow, including the New Administrative Capital and Suez Canal upgrades. Its streamlined approvals, bonded logistics zones, and deep labor pool foster execution certainty that reassures international financiers. Simultaneously, PPP reforms are widening the door for private toll-road and urban-rail concessions, diversifying procurement channels beyond state-funded models.
Kenya Construction Market
Kenya is the fastest-expanding market with a 8.9% CAGR from 2026-2031, underpinned by the USD 470 billion Mombasa-Nairobi Expressway, commuter rail extensions, and renewable-power corridors. Foreign-exchange stability and judicial reforms strengthen project bankability, elevating Nairobi’s status as the gateway for East African engineering, procurement, and construction (EPC) firms.
Africa Construction Market
Nigeria, South Africa, Ethiopia, and Morocco round out the second-tier heavyweights. Nigeria’s infrastructure drive aligns with oil-sector revival and housing-finance initiatives, sustaining a sizeable slice of the Africa construction market. South Africa directs capital toward grid stabilization and transport-hub refurbishments, while Ethiopia’s airport and dam programs anchor inward investment despite regional security headwinds. Morocco’s USD 10 billion rail and USD 40 billion water projects transform its northern trade corridors, signaling a climb in market share over the forecast horizon.
Regulatory Landscape
Construction regulation across Africa is tightening around procurement governance, contractor development, and building safety compliance, with reforms increasingly intended to improve the bankability of large public and PPP pipelines. South Africa’s Public Procurement Act 28 of 2024 codifies unified procurement rules for public entities. Tanzania’s 2024 Public Procurement Act update and Botswana’s Public Procurement Act reinforce standardized tendering and oversight norms that shape EPC and concession award processes.
In 2026, enforcement emphasis moved beyond tendering into delivery controls and capability building. Kenya operationalized its National Building Code 2024 through a 2026 National Buildings Inspection, Audit and Safety Testing Services Framework issued by the State Department for Public Works, tightening inspection, audit, and safety testing expectations for new and higher-risk buildings. Mauritius commenced the Construction Industry Authority Act 2023 in January 2026, and South Africa’s cidb B.U.I.L.D Standards published in April 2026 embed developmental procurement by requiring at least 5% of contract value allocation for emerging contractor development on larger-grade projects.
Value Chain Analysis
The Africa construction value chain covers project origination and financing (public budgets, multilateral lenders, PPP sponsors), project preparation and approvals, design and engineering (AEC consultants), procurement and logistics, construction execution (EPCs, local contractors, specialist subcontractors), and operations and maintenance for infrastructure assets. Public buyers still anchor volumes, but PPP structures and climate-linked financing are adding private decision-makers in tender design, risk allocation, and payment security. As a result, bankable contracts, standardized procurement, and stronger project preparation are becoming more important across the value chain.
Materials and equipment supply remains a constraint in multiple markets, with reliance on imported machinery and certain construction inputs creating exposure to shipping disruptions, counterfeit parts, and limited in-country maintenance capacity. Contractors increasingly manage this by tightening supplier qualification, consolidating procurement, and expanding regional service and spares support for heavy equipment to reduce downtime. On the lifecycle side, climate-resilient materials and maintenance models are gaining visibility through programs backed by development finance institutions, shifting value toward solutions that extend asset life, strengthen quality assurance, and shorten maintenance cycles for roads, power, and water infrastructure.
Competitive Landscape
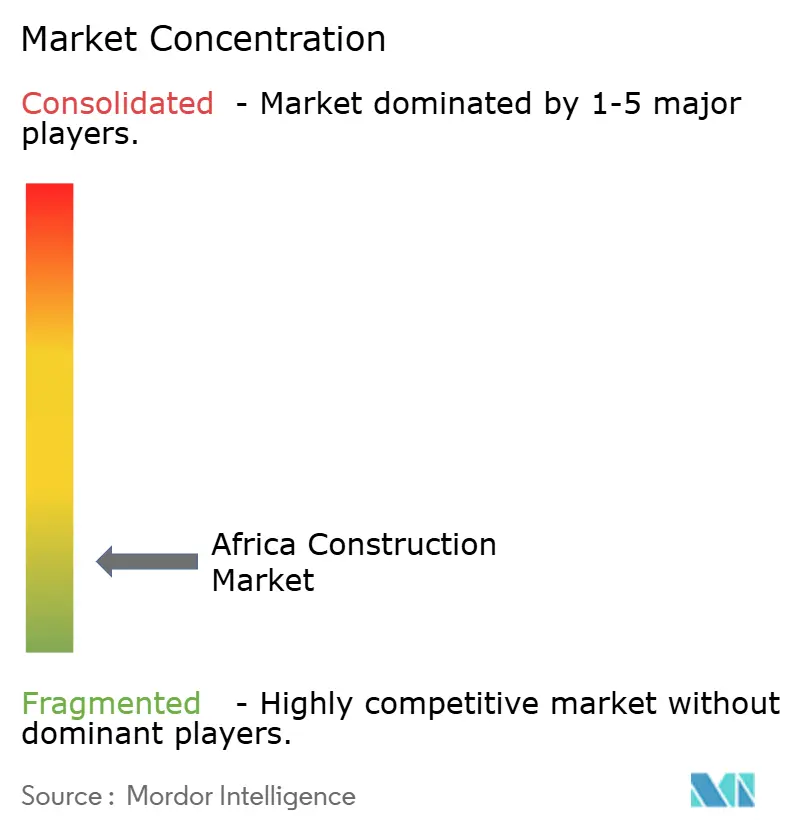
The Africa construction market exhibits high fragmentation, with no single contractor controlling more than 5% of regional turnover. Chinese state-owned enterprises such as China Communications Construction Group and China Railway Construction Corp still win large civil works packages under government-to-government frameworks, yet project awards increasingly hinge on localization clauses that favor joint ventures with domestic firms. European majors Vinci, Bouygues, and Strabag focus on high-specification rail, hydropower, and airport contracts where technical thresholds are higher.
Local champions, including Julius Berger Nigeria, Aveng, and WBHO, expand through cost-competitive bids and nuanced regulatory knowledge, helped by preference policies that award additional scoring for domestic content. As technology becomes an edge, early adopters of BIM-enabled clash detection and drone-based site monitoring are garnering productivity advantages that translate into improved bid accuracy. Prefabricated housing specialists from South Africa and Kenya are carving out niches in the affordable-housing sub-sector, highlighting fragmentation even within emerging technology arenas of the Africa construction market.
External market entrants face growing compliance hurdles around ESG, data-sharing, and workforce nationalization, impacting cost structures and partnership strategies. Supply-chain localization is intensifying, driving demand for regional cement, steel rebar, and façade systems, which in turn is elevating procurement risks tied to commodity price swings. The competitive chessboard remains fluid, offering room for strategic alliances centered on specialized equipment, digital twins, and green-material innovation.
Africa Construction Industry Leaders
-
China Communications Construction Group Ltd.
-
China Railway Construction Coro Ltd.
-
Vinci SA
-
Dangote Group
-
Bouygues SA
- *Disclaimer: Major Players sorted in no particular order
Africa Construction Market Companies Covered in this Report
- China Communications Construction Group Ltd
- China Railway Construction Corp. Ltd
- Vinci SA
- Dangote Group
- Bouygues SA
- Aveng Ltd
- WBHO (Wilson Bayly Holmes-Ovcon)
- Orascom Construction
- Bam International
- Shapoorji Pallonji Group
- Julius Berger Nigeria PLC
- Sonatrach (Infrastructure arm)
- Consolidated Contractors Company (CCC)
- China National Machinery Industry Corp. (Sinomach)
- Power Construction Corp. of China (PowerChina)
- Shapoorji Pallonji Africa
- Group Five Construction
- Arab Contractors
- Dumez Nigeria PLC
- General Nile Company for Roads & Bridges
Market Opportunities and Future Outlook
Opportunity is expanding in integrated infrastructure ecosystems where transport, power, and utilities are bundled into corridor-led development rather than delivered as isolated assets. Large named pipelines create near-term work for contractors, equipment providers, and specialist subcontractors, including Ethiopia’s Bishoftu International Airport program (USD 7.8 billion in the report context, with a January 2026 groundbreaking reported at a larger program value) and Morocco’s multi-year water-security and rail investments that support demand for civil works, MEP, and systems integration. The African Union’s April 2026 5th Specialised Technical Committee on Transport and Energy review of PIDA PAP2 implementation also reinforces a multi-country project-preparation agenda that supports transnational logistics and energy connectivity.
A second opportunity is compliance-led services and modernization tied to updated procurement and safety frameworks, where delivery discipline and documentation requirements increase the role of BIM-enabled design coordination, inspection and testing, and contractor capability programs. Kenya operationalized building-code enforcement through a 2026 inspection and safety testing framework, creating spend pathways for certified testing, audit services, and remediation work across public buildings and higher-risk assets. Affordable housing programs, including Nigeria’s July 2026 launch targeting 154,800 units, add volume for modular and prefabrication, local materials, and standardized designs that can reduce site labor intensity and improve schedule certainty in fast-growing urban markets.
Recent Industry Developments in Africa Construction Market
- June 2026: China Communications Construction Co. (CCCC) was reported as winning a USD 2.9 billion EPC contract to expand and modernize Jomo Kenyatta International Airport (JKIA) in Kenya. The award underscores continued reliance on large, state-backed contractors for headline transport projects and supports a broader pipeline for terminals, airside works, and surrounding commercial infrastructure.
- April 2026: VINCI Energies signed a EUR 192 million contract with Guinea’s Ministry of Energy and Ministry of Economy and Finance to deliver electrical infrastructure, including a 50 MWp solar facility and about 350 km of transmission lines. The package strengthens the role of European groups in power and grid-linked construction where technical thresholds, permitting, and systems integration capabilities shape competitive advantage.
- June 2024: Kenya inked a contract for the Mombasa-Nairobi Expressway, one of the region’s largest transport investments highlighted in the report context. The project reinforced East Africa’s corridor-driven construction demand, creating multi-year work for civil contractors, materials suppliers, and equipment fleets across roads, bridges, and interchanges.
Africa Construction Market Report Scope and Research Methodology
Market Definition and Coverage
This market tracks the total value of construction activity delivered across Africa in a given year, covering spending tied to building and civil works execution from planning through completion across major end-use areas.
Scope exclusions: It excludes upstream building materials manufacturing and standalone real estate transactions that do not represent construction work done.
Segments Covered in This Report
- By Sector
- Residential
- Apartments/Condominiums
- Villas/Landed Houses
- Commercial
- Office
- Retail
- Industrial and Logistics
- Others
- Infrastructure
- Transportation Infrastructure (Roadways, Railways, Airways, others)
- Energy & Utilities
- Others
- Residential
- By Construction Type
- New Construction
- Renovation
- By Construction Method
- Conventional On-Site
- Modern Methods of Construction (Prefabricated, Modular, etc)
- By Investment Source
- Public
- Private
- By Geography
- Nigeria
- South Africa
- Egypt
- Kenya
- Ethiopia
- Rest of Africa
Data Sources, Market Sizing, and Validation
Desk Research
Desk research was used to set the factual base for the model and to avoid relying on a single data series that can be incomplete across countries. We used public sources such as World Bank indicators, IMF macro tables, UNData and UN Comtrade trade statistics, and national statistics offices and central bank releases to understand construction activity direction and currency conditions.
To link the market to what is being built, we also reviewed government budget documents, procurement portals, and project announcements from transport, energy, and housing ministries, alongside multilateral development bank project pipelines and disclosures. Company annual reports, investor presentations, and trusted business press were reviewed to sense-check backlog trends and capacity. For a few gaps like shipment patterns and patent activity around construction methods, we used select paid subscriptions for import-export shipment-level data and patent databases. These sources are illustrative, and we also relied on other public documents for collection, validation, and clarification.
Primary Interviews and Surveys
Field research uses expert interviews and surveys with contractors, developers, public works participants, lenders, and distributors active in African countries. Respondent input helps clarify project timing, tender conversion, renovation activity, pricing, and public-private funding assumptions, while addressing country-level gaps in desk records. Re-contact is triggered when views on delivery rates or input costs differ materially from the model.
Distribution of primary research fieldwork respondents
| Company type | Respondent position |
|---|---|
| Top tier: 31% | CXOs: 16% |
| Mid tier: 47% | Functional/Unit leaders: 32% |
| Smaller Players: 22% | Managers: 52% |
Market-Sizing & Forecasting
The market is built using a top-down approach where national construction output signals are reconstructed into a consistent Africa total, then aligned to sector splits that match what is being commissioned. After that initial total is formed, we cross-check it with selective bottom-up approximations using sampled project values, contractor revenue exposure to Africa, and channel checks on typical cost per square meter or per kilometer for common asset types.
Key inputs used in the model include GDP and fixed investment trends, public capital expenditure levels, infrastructure and energy program timelines, urbanization and housing demand indicators, and imports of construction-related equipment as a proxy for execution intensity. For parts of Africa where official series are thin, we handle gaps by using nearest-country comparables and then adjusting them using interview feedback on labor availability, financing constraints, and the pace of project awards.
For forecasting, we apply scenario analysis so the base case can be stress-tested against funding conditions and execution capacity, then tune the final path using consensus expectations from the experts we interviewed. Currency conversion is kept consistent by using the same year-average exchange rate logic across countries, before totals are summed into USD.
Data Validation & Update Cycle
Outputs are validated by checking whether modeled growth matches independent signals such as budget execution trends, announced project pipelines reaching the award stage, and visible import and equipment activity. Any sharp swings are reviewed country by country, and assumptions are rechecked before sign-off, with follow-up outreach triggered when a major variance cannot be explained by macro or policy changes.
The work is reviewed in multiple steps so calculation errors, unit mismatches, and currency timing issues are caught early. Reports are refreshed annually, and interim updates are made when major events occur, such as a large program launch, a funding pause, or a policy change that shifts project flow. Right before delivery, a final analyst pass is completed so clients receive the latest updated view.
Mordor Intelligence's Africa Construction Market Estimate Compared With Other Published Estimates
Published market sizes for Africa construction can look far apart even when the same headline is used. The spread usually comes from what gets counted as construction value, how currency conversion is handled, and whether the forecast starts from awarded work or from broader investment intent.
Building materials manufacturing sits outside Mordor Intelligence's scope, which tends to lower the total versus estimates that fold cement, steel, and other upstream supply into the same number, and then amplify it with aggressive price escalation. Differences also show up when one source focuses only on Sub-Saharan Africa, or when a conservative case is published without making that scenario assumption clear, and then compared against a base case number.
Benchmark comparison
| Source | Market Size | Gaps in Research Methodology |
|---|---|---|
| Mordor Intelligence | USD 240.55 B (2025) | |
| Regional Consultancy A | USD 219.66 B (2024) | Uses an earlier base year and appears to apply a slower growth path for 2025 to 2030, which can understate countries with active infrastructure and energy award cycles. Scope and conversion timing are not always stated clearly, making year-to-year comparisons harder. |
| Global Consultancy B | USD 266.75 B (2024) | Likely includes adjacent value pools such as broader construction supply and higher assumed price uplift, which pushes the 2024 number upward. Limited visibility on how Africa sub-regions are weighted and how gaps in country data are adjusted can also change the final total. |
The table shows that the biggest drivers are scope and base-year alignment, followed by how inflation and currency are treated when rolling country values into USD. By tying inputs to observable construction activity signals and then rechecking them with project and stakeholder feedback, we arrive at a balanced number that can be repeated and explained.
Key Questions Answered in the Report
What is the current value of the Africa construction market and its forecast CAGR?
The market is valued at USD 257.63 billion in 2026 and is projected to expand at a 7.1% CAGR through 2031.
Which country holds the largest share in African construction activity?
Egypt leads with a 37.30% share, supported by mega-projects such as the New Administrative Capital and Suez Canal upgrades.
Which segment is expected to grow fastest through 2031?
Infrastructure construction is forecast to grow at 9.05% CAGR, driven by transport, energy, and water projects.
How significant is private investment in African construction?
Private funding accounts for 24.10% of spending today and is projected to rise at 10.4% CAGR as PPP models proliferate.