United States Gaming Console And Accessories Market Size and Share
Market Overview
| Study Period | 2020 - 2031 |
|---|---|
| Forecast Data Period | 2026 - 2031 |
| Historical Data Period | 2020 - 2024 |
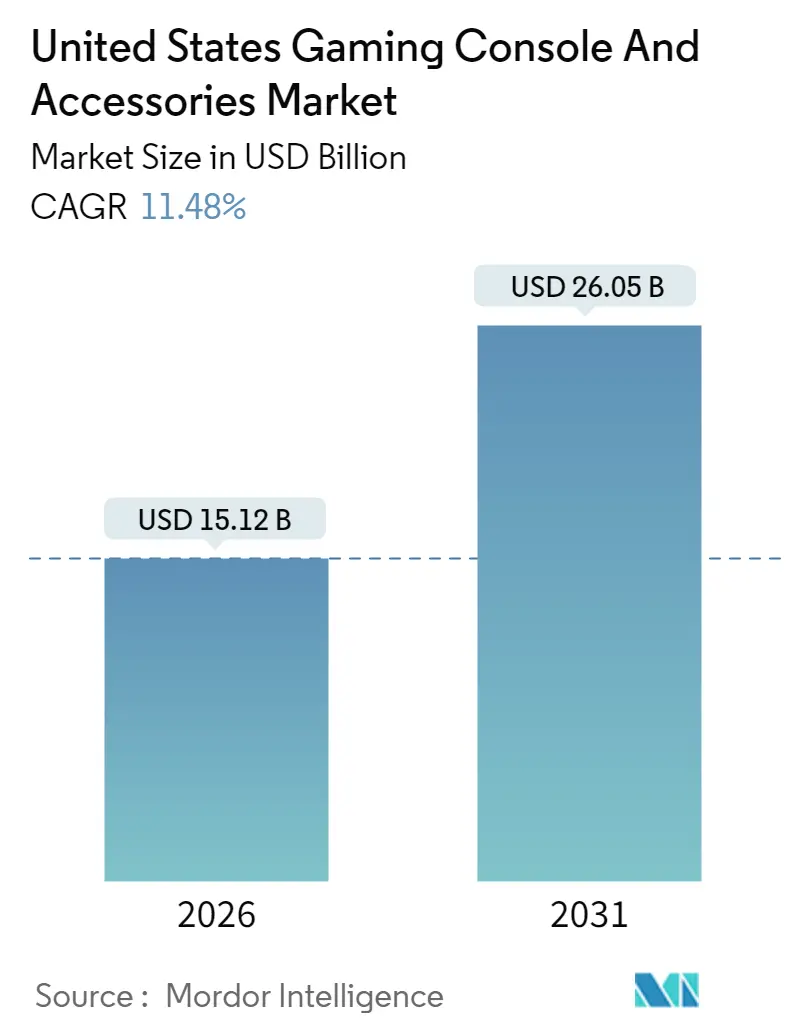
| Market Size (2026) | USD 15.12 Billion |
| Market Size (2031) | USD 26.05 Billion |
| Growth Rate (2026 - 2031) | 11.48% CAGR |
| Market Concentration | Medium |
Major Players *Disclaimer: Major Players sorted in no particular order Image © Mordor Intelligence. Reuse requires attribution under CC BY 4.0. | |
United States Gaming Console And Accessories Market Analysis by Mordor Intelligence
The United States gaming console and accessories market size in 2026 is estimated at USD 15.12 billion, growing from 2025 value of USD 13.56 billion with 2031 projections showing USD 26.05 billion, growing at 11.48% CAGR over 2026-2031. Growth is being powered by the blockbuster-driven upgrade cycle, the normalization of premium display ownership, and platform owner focus on deep ecosystem engagement that rewards first-party exclusivity. Content that pushes technical boundaries, such as Grand Theft Auto VI and future Unreal Engine 5 titles, is encouraging both lapsed and existing users to refresh hardware and add higher-margin peripherals. Parallel advances in tactile feedback, spatial audio, and RGB light synchronization are expanding the addressable accessory basket, while online storefronts funnel much of that incremental spend directly to platform holders. Cloud streaming remains a credible substitution risk, yet latency constraints outside dense metro hubs keep dedicated boxes relevant. Supply normalization at leading foundries eases the worst of recent shortages, but premium silicon demand from AI workloads means console makers still operate with less buffer than desired.
Key Report Takeaways
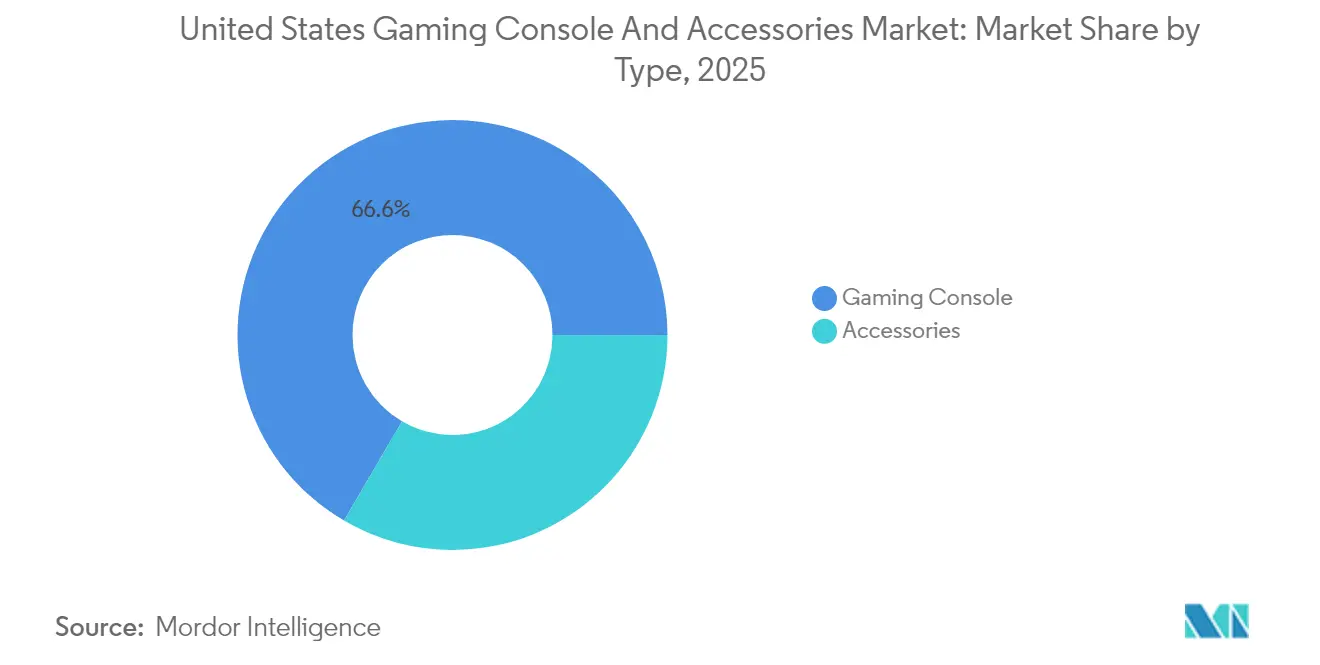
- By type, consoles captured 66.58% value in 2025, yet accessories are advancing at a faster 12.31% CAGR through 2031.
- By console form factor, home systems led with a 71.86% share in 2025, while hybrid and VR-ready designs are forecast to expand at 12.55% through 2031.
- By accessory class, gamepads held 37.85% revenue in 2025, and VR peripherals are on track to rise at 12.07% CAGR.
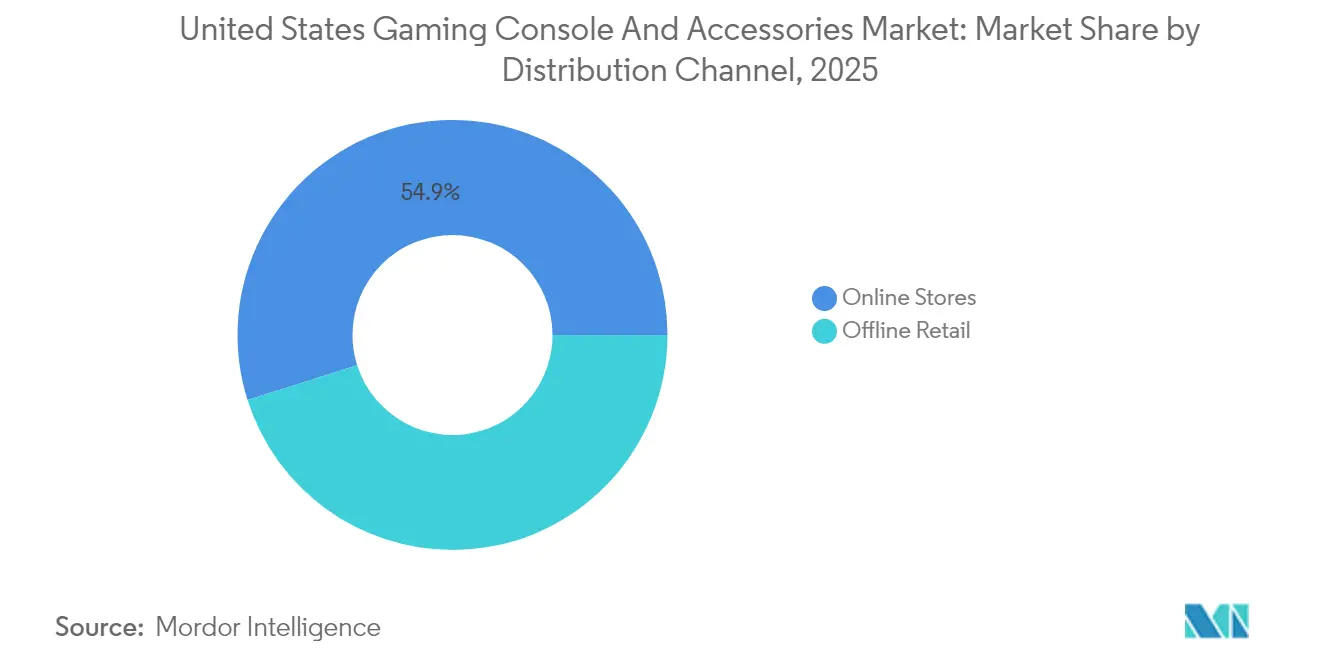
- By distribution, online channels accounted for 54.88% of the 2025 turnover and are growing at a rate of 12.29%, as direct-to-consumer models gain traction.
- By price band, the USD 300-499 bracket accounted for 45.76% of 2025 sales, while the tier above USD 500 is increasing at a 12.22% CAGR, driven by mid-generation refreshes.
Note: Market size and forecast figures in this report are generated using Mordor Intelligence’s proprietary estimation framework, updated with the latest available data and insights as of January 2026.
United States Gaming Console And Accessories Market Trends and Insights
Drivers Impact Analysis
| Driver | (~) % Impact on CAGR Forecast | Geographic Relevance | Impact Timeline |
|---|---|---|---|
| Launch of New AAA Gaming Content With High Graphic Requirements | +2.1% | National, with concentration in urban metro areas | Medium term (2-4 years) |
| Integration of 3D and AR/VR Gaming | +1.8% | National, with early adoption in West Coast and Northeast tech hubs | Long term (≥ 4 years) |
| Rapid Adoption of 4K and 8K Televisions Driving Console Upgrades | +1.5% | National, accelerating in high-income households | Short term (≤ 2 years) |
| Expansion of First-Party Exclusive Titles Fueling Hardware Sales | +2.3% | National, with platform-specific regional clusters | Medium term (2-4 years) |
| Rise of Esports Collegiate Programs Boosting Accessory Demand | +1.2% | National, concentrated in universities with varsity esports programs | Medium term (2-4 years) |
| Introduction of Modular, Repairable Console Designs Aligning With Right-to-Repair Laws | +0.9% | National, with early compliance in California and Oregon | Long term (≥ 4 years) |
| Source: Mordor Intelligence | |||
Launch of New AAA Gaming Content With High Graphic Requirements
Blockbuster releases continue to drive demand forward by setting technical floors that entry-level consoles struggle to reach. The upcoming Grand Theft Auto VI emphasizes real-time ray tracing and 60fps 4K output, which favors the PlayStation 5 Pro class of hardware.[1]Sony Group Corporation, “Consolidated Financial Results for Fiscal Year Ended March 31 2024,” sony.com Unreal Engine 5 adoption embeds Nanite geometry and Lumen lighting as baseline expectations, effectively shortening replacement cycles. Lessons from the 2016 mid-generation upgrade of the PlayStation 4 Pro show that content-driven refreshes can deliver incremental revenue without cannibalizing the existing base. Platform roadmaps now target 18- to 24-month optimization windows that align with AAA pipelines, signaling a structural linkage between engine capability and hardware cadence. This alignment strengthens the United States gaming console and accessories market by allowing publishers to justify premium hardware SKUs through tangible visual improvements.
Integration of 3D and AR/VR Gaming
Virtual reality is shifting from a niche to a mainstream market as standalone headsets from Meta prove their scalability without requiring tethered support. Sony’s PlayStation VR2 crossed the 2 million unit mark by mid-2024, validating console-attached VR when exclusive content anchors buyer motivation. Eye-tracking, foveated rendering, and haptic controllers set new immersion standards that third-party makers now aim to surpass with adaptive triggers and force-feedback gloves. Razer’s 2025 Immersive Ecosystem launch underscores multi-sensory ambitions that extend beyond visuals. Nintendo has escalated R&D efforts around augmented overlays that blend digital layers onto hybrid gameplay, signaling a deeper future convergence. Regulatory discussions at the Federal Trade Commission regarding accessory interoperability could further catalyze the adoption of open standards, creating wider addressability for accessory innovators.
Rapid Adoption of 4K and 8K Televisions Driving Console Upgrades
Households replacing legacy screens with 4K or even 8K models quickly recognize that older consoles underutilize premium displays. The Consumer Technology Association noted that 4K sets represented 85% of U.S. television shipments in 2024, a milestone that creates an installed audience eager for native high-fidelity content. Microsoft positions Xbox Series X as a 4K 120 Hz machine, aligning console refresh schedules with living-room electronics replacements. Sony’s firmware updates injected variable refresh rate support and 1440p output to broaden monitor compatibility. The August 2025 PlayStation 5 Pro launch invites display owners to unlock ray-traced visuals that match premium panels. These triggers elevate the United States gaming console and accessories market as consumers pair screen upgrades with new consoles and headsets.
Expansion of First-Party Exclusive Titles Fueling Hardware Sales
Exclusive intellectual property has become the most effective lever for hardware differentiation. Sony reported that first-party software drove 18% of total PlayStation sales in fiscal 2024 while materially lifting console attachment. Nintendo continues to exemplify this strategy, with Mario, Zelda, and Pokémon contributing 60% of its regional software revenue. Microsoft’s acquisition of Activision Blizzard brings celebrated franchises under Xbox Game Studios, yet multi-platform commitments temper exclusivity dividends. Antitrust scrutiny remains a watch point, though current case law still favors vertical integration absent demonstrable consumer harm. Persistent exclusives strengthen the United States gaming console and accessories market by locking in ecosystems and fostering long-term engagement.
Restraints Impact Analysis
| Restraint | (~) % Impact on CAGR Forecast | Geographic Relevance | Impact Timeline |
|---|---|---|---|
| High Cost of Implementation and System Integration Issues | -1.8% | National, acute in mid-market enterprises with legacy infrastructure | Short term (≤ 2 years) |
| Availability of Feature-Rich Open-Source Tools | -0.9% | National, concentrated in technology and startup sectors | Medium term (2-4 years) |
| Increasing State-Level Consumer Data-Protection Statutes | -1.4% | National, led by California, Virginia, Colorado, Connecticut, Utah | Medium term (2-4 years) |
| Talent Shortage in Advanced Analytics and Data Engineering | -1.6% | National, most severe in Midwest and South regions | Long term (≥ 4 years) |
| Source: Mordor Intelligence | |||
Increasing Threat From Cloud Gaming Services
Streaming removes hardware prerequisites by delivering console-grade experiences on commoditized devices. Xbox Cloud Gaming surpassed 100 million reachable screens by early 2025, including smart TVs, streaming sticks, and handheld devices.[2]Microsoft Corporation, “GDC 2025: Opening a Billion Doors with Xbox,” developer.microsoft.com PlayStation added PS5 streaming options for subscribers, signalling internal hedging against dedicated box erosion. Nvidia’s GeForce Now evidences traction by offering bring-your-own-library flexibility. Latency remains the chief brake, with sub-50 ms round-trips still limited to dense urban fiber nodes, easing pressure on console vendors in suburban or rural regions. Nonetheless, every incremental network improvement inches consumers toward a platform-agnostic future that could slow hardware sell-through within the United States gaming console and accessories market.
Rising Demand for Mobile-Based Gaming Platforms
Smartphones command daily engagement and deliver an expanding library of controller-compatible titles that cater to casual gaming sessions. Younger demographics value convenience and social immediacy highly, resulting in reduced time allocated to large-screen play. Publishers increasingly employ cross-progression systems that let users pick up achievements anywhere, diminishing the perceived need for a dedicated console. Accessory makers respond with mobile grips and clip-on controllers, yet average selling prices remain below those of console equivalents, mitigating the revenue impact. The trend siphons discretionary entertainment spend that might otherwise flow into the United States gaming console and accessories market.
Segment Analysis
By Type: Accessories Outpace Hardware on Recurring Upgrade Cycles
Accessories delivered 33.42% of value in 2025 and are projected to climb at 12.31% through 2031, outstripping console hardware. Gamepads, headsets, and VR add-ons reach obsolescence sooner than the base device because wear, competitive standards, and gift cycles renew purchase intent. Sony reported an average 2.3 peripheral attach rate per PlayStation 5 in fiscal 2024, rising from 1.9 the prior year. Logitech and Razer each posted double-digit segment gains despite flat broader revenue, confirming the impulse-buy dynamic. The United States gaming console and accessories market registers enthusiastic uptake when branded colorways or esports tie-ins appear, which keeps accessory refresh churn high.
Premiumization also bolsters accessory revenue as enthusiasts pay for low-latency connections, magnet-trigger modules, and spatial audio. Custom design labs on official Xbox storefronts monetize willingness to personalize. Third-party vendors exploit gaps by offering modular paddles, hot-swap sticks, or adaptive kits for players with disabilities. This layered product regime provides sustainable growth even if console unit sales plateau, making accessories the structural growth driver inside the United States gaming console and accessories market.
Note: Segment shares of all individual segments available upon report purchase
By Console Type: Hybrid Architectures Blur Form-Factor Boundaries
Home systems still held a 71.86% share in 2025, thanks to the dominance of the PlayStation 5 and Xbox Series X. However, hybrid and VR-ready models are climbing at a rate of 12.55% annually. Nintendo Switch pioneered the docked-portable schema and surpassed 143 million global units by fiscal 2024, with the United States as its largest single territory. Switch 2 debuted in June 2025 and moved 3.5 million units in four days worldwide, underscoring the appetite for portability without performance sacrifice. Sony’s rumored handheld aims to extend the PlayStation ecosystem in a similar vein.
Handheld growth also hinges on remote play streams that convert phones into thin clients. VR-ready consoles experience an uplift from improved PlayStation VR2 attach rates, with software per headset increasing to 3.2 titles. These shifts diversify the United States gaming console and accessories market by placing capable hardware in both living rooms and travel bags while widening the funnel for complementary gear.
By Accessories Type: VR Peripherals Surge as Content Libraries Mature
Gamepads held a 37.85% revenue share in 2025 and remain indispensable; however, VR accessories are the fastest-growing segment at a 12.07% CAGR. Sony’s DualSense adaptive triggers triggered an industry-wide tactile race, spurring SCUF and Razer's premium variants, which retail above USD 200. Headsets continue to shift from wired to wireless and integrate active noise cancellation, lifting average selling prices. Steering wheels and flight sticks have pockets of strength tied to simulation titles and esports racing broadcasts, proving that the niche can be lucrative.
VR peripherals extend beyond controllers into haptic vests and floor pads. Razer’s Sensa HD ecosystem debuted in January 2025, featuring alliances with 50 lighting brands, transforming player environments into interactive surfaces. As content breadth grows, the United States gaming console and accessories market will see a rising share for these high-margin experiential products.
By Distribution Channel: Direct-to-Consumer Models Reshape Retail Economics
Online storefronts captured 54.88% of turnover in 2025, a trend expected to continue at a rate of 12.29% through 2031. Sony’s PlayStation Direct and Microsoft’s webshops cut out middlemen, reclaim full gross margin, and harvest first-party customer data. Amazon’s expedited shipping reinforces its role in providing broad purchase comfort, while specialty retailers like GameStop lean into trade-in credit and collectibles to remain relevant. Walmart and Target still facilitate impulse buys, yet their share erodes.
Brick-and-mortar retains an experiential edge for high-touch categories, including VR demos and racing rigs. Partnerships with campus esports programs drive on-site activations. Omnichannel tactics such as Nintendo’s GameTruck roadshows amplify new hardware visibility and funnel online orders afterward. These blended models help the United States gaming console and accessories market maintain its resilience even as shopping habits continue to digitize.
Note: Segment shares of all individual segments available upon report purchase
By Price Range: Premium Segment Captures Enthusiast Wallet Share
The USD 300-499 ticket range generated 45.76% of the revenue in 2025 and remains the mass-market sweet spot, encompassing base PlayStation 5, Xbox Series X, and mid-tier bundles. Yet the above-USD 500 class is rising 12.22% CAGR as the PlayStation 5 Pro, Switch 2 premium bundles, and USD 1,499 racing wheels push spending ceilings. Enthusiasts accept higher entry barriers for tangible performance boosts or build pride.
Sub-USD 300 equipment, including Switch Lite and budget headsets, grows more slowly amid saturation. Licensed third-party brands target that value segment with aggressive pricing but concede margin to achieve volume. The clear bifurcation underscores that the United States gaming console and accessories market is now segmented into bargain seekers who delay refreshes and power users who chase peak fidelity.
Geography Analysis
The United States accounted for the largest single-country share of global console expenditure in 2025, underpinned by 183 million active players and widespread broadband. West Coast hubs, such as Los Angeles and San Francisco, adopt VR devices the earliest, aided by proximity to studio clusters and fiber investments. Midwest and Southern consumers lean into sports simulations that lift steering wheel sell-through. Entertainment Software Association data confirms a near-even gender split among gamers; however, accessory sales skew male, indicating a design and marketing bias that leaves revenue on the table.
State regulation now shapes development roadmaps. California’s right-to-repair language, though temporarily exempting game consoles, inspired Oregon SB 1596, which explicitly includes them, compelling national compliance. The Federal Trade Commission’s policy statement supports these moves, foreshadowing eventual federal harmonization. The U.S. Copyright Office extension of DMCA exemptions for preservation sustains secondary markets and smooths lifecycle handoffs.
5G rollout removes bandwidth ceilings in metro corridors, a prerequisite for meaningful cloud substitution. T-Mobile reached 330 million POPs by late 2024, while Verizon covered 230 million, shrinking the latency gap. Simultaneously, CHIPS and Science Act funds diversify foundry locations. Intel and TSMC fabs opening in Arizona and Ohio from 2026 will add local wafer capacity that, once online, should dampen geopolitical risk. Nintendo’s November 2025 forecast lift from 15 million to 19 million Switch 2 units for fiscal 2026 illustrates that innovative form factors re-energize even a mature base. These vectors collectively keep the United States gaming console and accessories market on its double-digit trajectory despite substitution threats.
Competitive Landscape
Sony, Microsoft, and Nintendo form a tight oligopoly at the platform level, while peripheral makers create a fragmented arena below. Microsoft logged USD 21.5 billion in gaming revenue for fiscal 2024, driven by a 35 million global Game Pass membership and growth in Xbox services. Sony lifted operating margins via digital attach and accessory expansion, highlighted by the September 2025 Midnight Black and Chroma lines. Nintendo solidifies defensibility with backward compatibility and a first-party software ratio exceeding 60%.
Accessory specialists refine latency and explore modularity. Razer’s immersion stack syncs audio, haptics, and RGB across partner devices. Logitech’s McLaren co-branded wheel underscores premiumization. Corsair projects stream-deck modules into OEM channels, pursuing creator workflows as an adjacency. Regulatory pressure for interoperability could confer an advantage on cross-platform designs, an area where third-party brands lead.
Adaptive controllers and inclusive gear serve the estimated 46 million Americans with disabilities, a segment Microsoft courts proactively. Patents filed in 2024 reveal configurable shell systems that may become mainstream. Competition thus balances between vertical ecosystem control and open accessory innovation, collectively sustaining vibrancy in the United States gaming console and accessories market.
United States Gaming Console And Accessories Industry Leaders
Sony Interactive Entertainment LLC
Microsoft Corporation
Nintendo of America Inc.
Logitech International SA
Turtle Beach Corporation
- *Disclaimer: Major Players sorted in no particular order
Recent Industry Developments
- November 2025: Nintendo raised its Switch 2 fiscal 2026 unit forecast to 19 million, citing stronger-than-expected demand and maintaining that supply shortages persist in some regions.
- September 2025: Sony expanded its PlayStation 5 accessory catalog with Midnight Black and Chroma collections, plus licensed storage drives up to 8 TB.
- August 2025: Sony has launched the PlayStation 5 Pro, targeting high-fidelity gamers and extending the console's lifecycle.
- June 2025: Nintendo Switch 2 debuted at USD 449.99, moving 3.5 million units in four days and introducing magnetic Joy-Con 2 controllers with GameChat functionality.
United States Gaming Console And Accessories Market Report Scope
The United States Gaming Console and Accessories market covers the sales value of gaming consoles and related accessories across various product categories and price ranges. It includes market dynamics by console type, accessory type, and distribution channel, reflecting consumer spending patterns and technological advancements.
The United States Gaming Console and Accessories Market Report is Segmented by Type (Gaming Console, and Accessories), Console Type (Home Console, Handheld Console, and Hybrid Console), Accessories Type (Controller Gamepads, Headsets, and More), Distribution Channel (Online Stores, and Offline Retail), and Price Range (Below USD 300, USD 300-499, Above USD 500). The Market Forecasts are Provided in Terms of Value (USD).
| Gaming Console |
| Accessories |
| Home Console |
| Handheld Console |
| Hybrid Console |
| Controller Gamepads |
| Headsets |
| Steering Wheels and Flight Sticks |
| VR Accessories |
| Others |
| Online Stores |
| Offline Retail |
| Below USD 300 |
| USD 300-499 |
| Above USD 500 |
| By Type | Gaming Console |
| Accessories | |
| By Console Type | Home Console |
| Handheld Console | |
| Hybrid Console | |
| By Accessories Type | Controller Gamepads |
| Headsets | |
| Steering Wheels and Flight Sticks | |
| VR Accessories | |
| Others | |
| By Distribution Channel | Online Stores |
| Offline Retail | |
| By Price Range | Below USD 300 |
| USD 300-499 | |
| Above USD 500 |
Key Questions Answered in the Report
What is the projected value of the United States gaming console and accessories market in 2031?
It is expected to reach USD 26.05 billion by 2031 on an 11.48% CAGR trajectory.
Which accessory category is growing the fastest?
VR peripherals are forecast to expand at a 12.07% CAGR through 2031 as content libraries mature.
How big is the above-USD 500 price tier?
The segment is growing at 12.22% CAGR and is fueled by products such as PlayStation 5 Pro and high-end racing wheels.
Why are hybrid consoles gaining traction?
Devices like Nintendo Switch 2 allow seamless transition between handheld and docked modes, which appeals to users seeking flexibility without performance sacrifice.
How does cloud gaming affect console demand?
Cloud services reduce dependence on dedicated hardware in fiber-rich metros, trimming CAGR potential by an estimated 1.4 percentage points in the medium term.


