North America Gaming Hardware And Accessories Market Size and Share
Market Overview
| Study Period | 2020 - 2031 |
|---|---|
| Forecast Data Period | 2026 - 2031 |
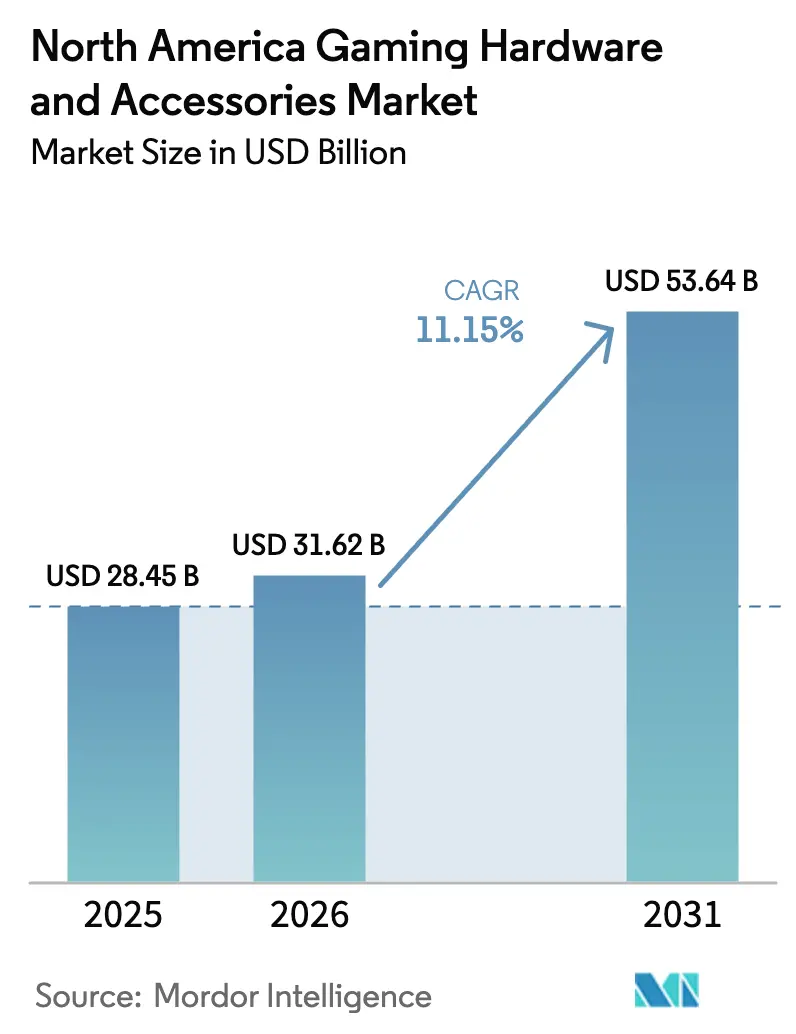
| Base Year Market Size (2025) | USD 28.45 Billion |
| Market Size (2026) | USD 31.62 Billion |
| Market Size (2031) | USD 53.64 Billion |
| Growth Rate (2026 - 2031) | 11.15% CAGR |
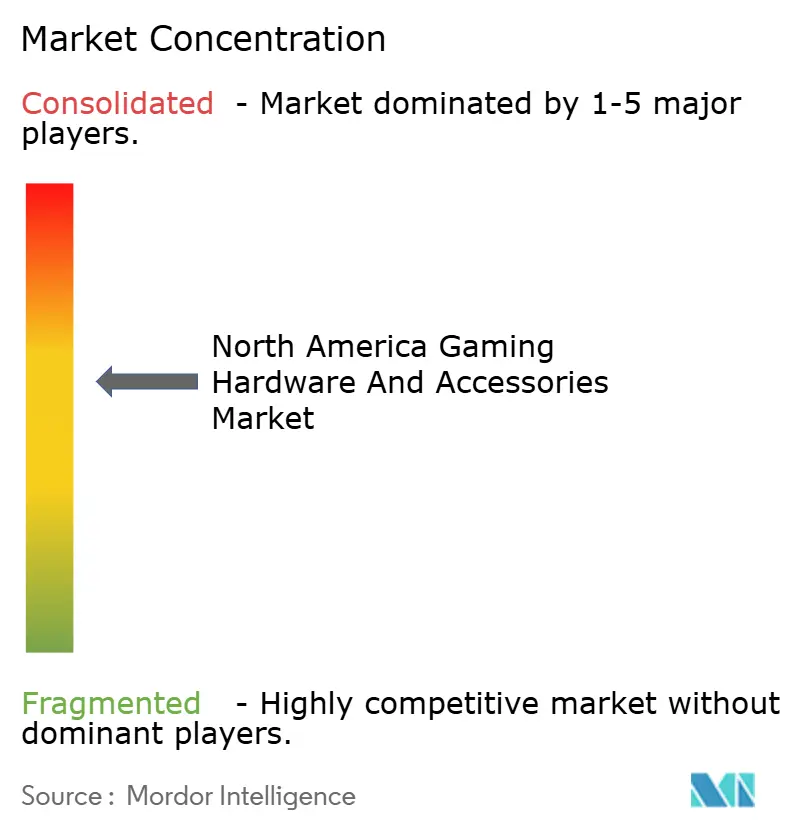
| Market Concentration | Medium |
Major Players *Disclaimer: Major Players sorted in no particular order Image © Mordor Intelligence. Reuse requires attribution under CC BY 4.0. | |
North America Gaming Hardware And Accessories Market Analysis by Mordor Intelligence
The North America Gaming Hardware And Accessories Market size was valued at USD 28.45 billion in 2025 and estimated to grow from USD 31.62 billion in 2026 to reach USD 53.64 billion by 2031, at a CAGR of 11.15% during the forecast period (2026-2031).
Strong demand for next-generation consoles, professional-grade peripherals and virtual-reality systems is sustaining double-digit growth even as supply constraints for GPUs and memory linger. The United States commands the lion’s share of spending, while Canada is expanding faster on the back of large esports infrastructure builds and targeted provincial incentives. Component vendors are adapting to semiconductor shortages by reallocating limited high-performance chips among gaming, data-center and AI clients. At the same time, wireless connectivity has shifted from a premium feature to an expectation, supporting cross-device ecosystems that boost attach rates for accessories.
Key Report Takeaways
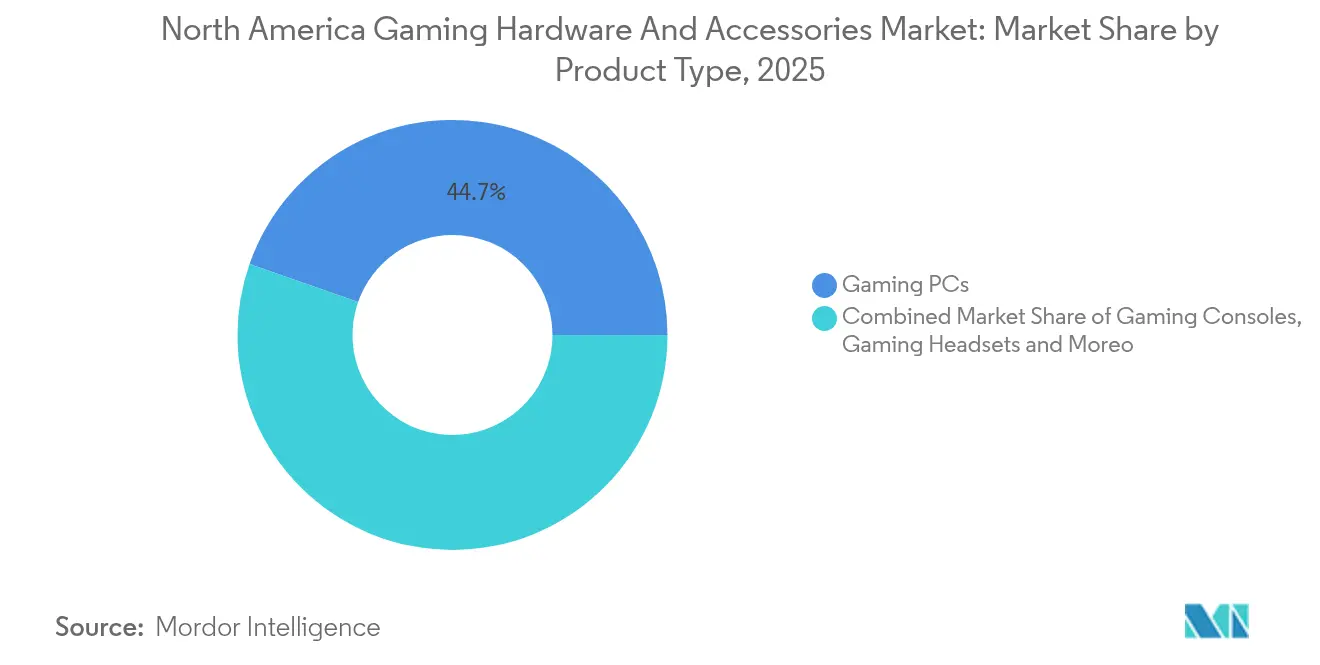
- By product category, Gaming PCs led with 44.65% of the North American gaming hardware market share in 2025, whereas Virtual Reality Devices are projected to grow at a 18.74% CAGR to 2031.
- By component, Peripherals & Accessories accounted for 54.40% share of the North American gaming hardware market size in 2025 and are forecast to expand at 9.45% CAGR through 2031.
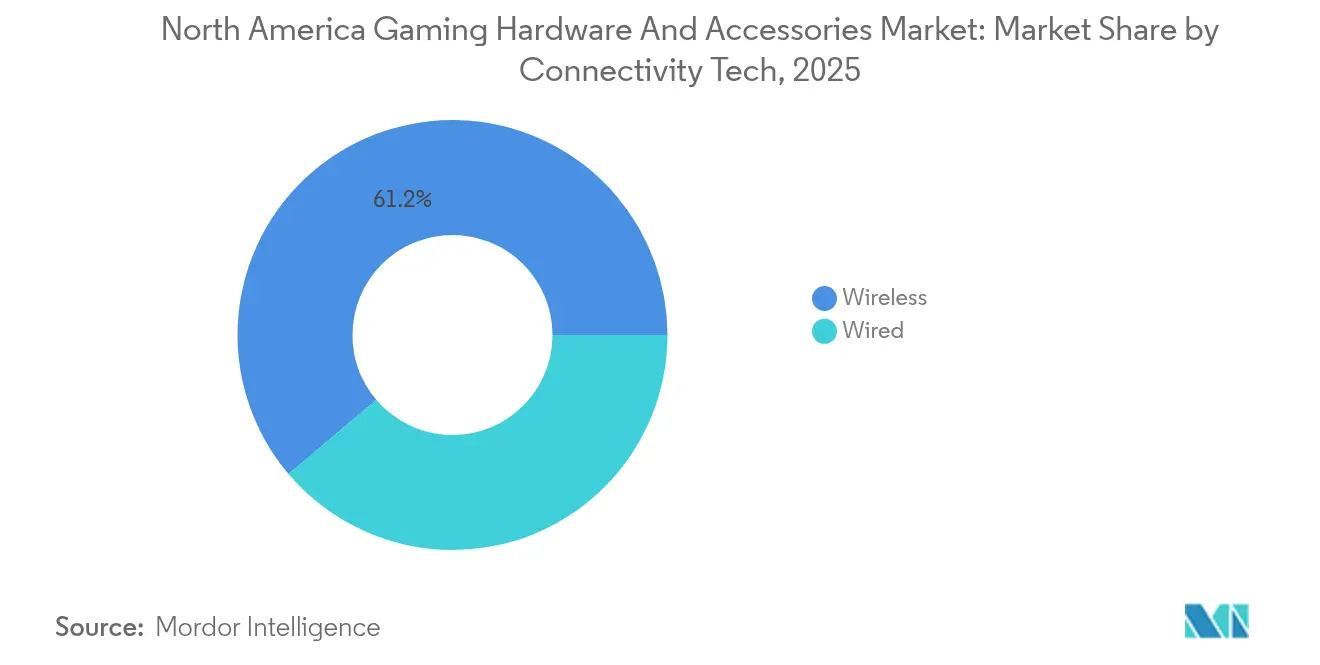
- By connectivity, wireless technologies captured 61.20% revenue share in 2025 and will advance at an 10.95% CAGR over the forecast period.
- By end user, casual gamers held 68.25% of 2025 spending, while the professional and competitive cohort is set to grow at 13.25% CAGR to 2031.
- By geography, the United States contributed 91.85% of 2025 revenue; Canada is the fastest-growing country at 15.05% CAGR during 2026-2031.
Note: Market size and forecast figures in this report are generated using Mordor Intelligence’s proprietary estimation framework, updated with the latest available data and insights as of 2026.
North America Gaming Hardware And Accessories Market Trends and Insights
Drivers Impact Analysis*
| Driver | (~) % Impact on CAGR Forecast | Geographic Relevance | Impact Timeline |
|---|---|---|---|
| Esports facility expansion | +1.8% | United States & Canada | Medium term (2-4 years) |
| Next-generation console refresh cycles | +2.1% | North America-led | Short term (≤ 2 years) |
| AAA PC titles raising GPU demand | +1.5% | U.S. gaming hubs | Medium term (2-4 years) |
| Growing VR/AR-ready system adoption | +1.9% | Early adopter clusters | Long term (≥ 4 years) |
| Surge in direct-to-consumer accessory sales | +1.2% | Rural & suburban areas | Short term (≤ 2 years) |
| U.S. semiconductor tax incentives | +0.9% | United States | Long term (≥ 4 years) |
| Source: Mordor Intelligence | |||


Expansion of Professional & Collegiate Esports Infrastructure Across U.S. & Canada
Purpose-built esports arenas, collegiate training facilities and broadcast studios are multiplying throughout North America. OverActive Media is spending USD 500 million on a 7,000-seat venue in Toronto that will host more than 200 live events annually from 2025 onward overactivemedia.com[1]OverActive Media, “Toronto Esports Venue Project Overview,” overactivemedia.com . Similar initiatives at U.S. universities place gaming hardware procurement inside core IT budgets, ensuring steady orders for high-refresh-rate monitors, latency-optimized networking gear and tournament-grade peripherals. Facility operators bundle sponsorship rights with hardware procurement contracts, creating longer visibility on demand compared with cyclical consumer refreshes. Suppliers benefit from multi-year agreements that specify minimum performance thresholds, driving premium tiers of GPUs and CPUs. In effect, esports infrastructure investment contributes a measurable uplift to the North American gaming hardware market by institutionalizing spending that once relied on discretionary funds.
Transition to Next-Gen Consoles Driving Accessory Refresh Cycles
The PlayStation 5 family continues to out-sell Xbox Series systems across North America, giving Sony leverage to define new accessory standards such as the DualSense Edge controller playstation.com. Sony’s release of the PS5 Pro in late 2024 already accounts for 19% of PS5 unit sales in November 2024, underlining buyers’ willingness to pay for incremental performance sonyinteractive.com. Each console in circulation triggers an expanded attach-rate opportunity for headsets, rechargeable docks and adaptive triggers tailored to Sony’s haptic APIs. Microsoft’s cloud-centric pivot partially offsets hardware softness by cultivating cross-platform accessory ecosystems that still require high-bandwidth Wi-Fi chipsets. Together, these shifts lengthen the life cycle of premium accessories, keeping the North American gaming hardware market on a stable growth path despite semiconductor headwinds.
Growth of AAA PC Gaming Titles Requiring High-Performance GPUs in North America
Flagship PC releases such as “Cyberpunk 2078” and “StellarFront” specify ray-tracing at 4K120 as the recommended baseline, pushing gamers toward Nvidia RTX 50-series or equivalent GPUs. Dell’s Alienware desktops, refreshed in March 2025 with Intel Core Ultra processors and next-gen Nvidia silicon, start at USD 3,749.99 and adopt standard ATX layouts for easier future upgrades delltechnologies.com. GPU vendors co-market with publishers to certify frame-rate targets, creating performance tiers that nudge enthusiasts into earlier upgrade cycles. Although overall PC shipments fluctuate, revenue is increasingly concentrated in the upper-end SKUs that deliver tangible advantages in latency-sensitive esports. The combination of blockbuster titles and competitive aspiration is therefore a structural demand driver within the North American gaming hardware market.
Rising Adoption of VR/AR-Ready Systems Fueled by Meta Quest & Apple Vision Pro Ecosystem
Virtual reality hardware moves faster than legacy platforms, yet adoption hurdles around comfort, price and killer content persist. Meta’s Quest 3S missed 2024 holiday sales targets as app downloads fell 27% year over year on Christmas Day meta.com. Even so, VR-ready PCs and peripherals carry meaningful premiums, explaining why the segment is tracking a 19.29% CAGR through 2030. Apple’s Vision Pro launch signals growing mainstream interest in spatial computing, prompting GPU and memory suppliers to tune components for dual-use between immersive gaming and productivity. VR growth also lifts demand for low-latency wireless protocols and higher-resolution display pipelines, which spin off innovations that later permeate the broader North American gaming hardware market.
Restraints Impact Analysis*
| Restraint | (~) % Impact on CAGR Forecast | Geographic Relevance | Impact Timeline |
|---|---|---|---|
| GPU and memory supply tightness | -1.4% | North America | Medium term (2-4 years) |
| Mobile / cloud gaming cannibalization | -1.1% | Younger demographics | Long term (≥ 4 years) |
| E-waste regulation cost pressures | -0.8% | Canada-led | Medium term (2-4 years) |
| Inflation-driven price sensitivity | -0.9% | U.S. middle-income users | Short term (≤ 2 years) |
| Source: Mordor Intelligence | |||
Ongoing GPU & Memory Supply Tightness Despite U.S. CHIPS Act Build-Outs
Nvidia has warned that demand for Blackwell GPUs will exceed supply through at least 2026, partly because hyperscale AI clusters book capacity years in advance nvidia.com. Memory specialist SK Hynix projects constrained output for premium GDDR7 chips during 2024-2025 as AI servers consume available inventories skhynix.com. The CHIPS and Science Act has unlocked USD 52.7 billion in incentives, yet new fabs break ground faster than they yield production volumes commerce.gov. For gaming OEMs, the shortage manifests in staggered product launches, higher bill-of-materials costs and selective SKU cancellations. These factors shave points off the forecast CAGR for the North American gaming hardware market until domestic capacity ramps sufficiently.
Intensifying Preference for Mobile & Cloud Gaming Curtailing High-End Hardware Spend
Game pass subscriptions from Microsoft, Nvidia and Sony allow flagship titles to stream on smartphones and low-spec PCs at 60 fps, reducing the urgency for costly local upgrades. Consumers allocate a larger share of wallets toward monthly content libraries, resulting in flatter replacement cycles for top-tier GPUs. Accessory sales do not decline, however, as players still buy controllers and headsets to improve the experience on thin-client devices. Hardware brands, responding to this shift, adopt modular approaches that let users upgrade controllers, thumb sticks or audio drivers without replacing entire rigs. Over time the convenience of cloud access caps the addressable premium hardware base and applies mild downward pressure on the North American gaming hardware market’s overall growth trajectory.
*Our forecasts treat driver/restraint impacts as directional, not additive. The impact forecasts reflect baseline growth, mix effects, and variable interactions.
Segment Analysis
By Product Type: VR Devices Accelerate While Gaming PCs Retain Scale
The North American gaming hardware market size for product categories shows Gaming PCs commanding USD 12.7 billion revenue in 2025, equal to 44.65% of total spending mordorintelligence.com. Revenue in this segment is expanding at a mid-single-digit pace as enthusiasts chase ATX-based towers that promise easier GPU swaps. Dell’s 2025 Area-51 revival features RTX 50-series graphics and top-bin Intel processors, validating demand for uncompromised performance among PC gamers delltechnologies.com. OEMs improve gross margins by offering factory overclock options that command triple-digit price uplifts relative to base SKUs. The integration of Wi-Fi 7 chipsets and PCIe 5.0 storage across mid-range builds also sustains higher average selling prices, supporting the broader North American gaming hardware market despite unit volatility.
Virtual Reality Devices contribute a smaller base today but are forecast to post a 18.74% CAGR to 2031, adding nearly USD 5 billion incremental revenue in that window mordorintelligence.com. The steep trajectory ties to falling headset prices, improved comfort profiles and first-party platform support from Meta and Apple. System requirements for VR titles differ from traditional setups, pushing users toward balanced CPU-GPU builds and high-bandwidth USB-C display outputs. Content bundling strategies, such as six-month subscriptions to VR fitness apps, sweeten the value proposition and help headsets cross into lifestyle expenditure. The influx of AAA hybrid titles that work in both flat-screen and VR modes reduces the perception of platform risk, further widening the addressable base within the North American gaming hardware market.


By Component: Peripherals Sustain Recurring Cash Flows
Peripherals & Accessories generated 54.40% of total revenue in 2025, equal to USD 15.48 billion of the North American gaming hardware market size logitech.com. Short replacement windows, fashion-driven colorways and frequent esports endorsements underpin a 9.45% CAGR outlook to 2031. Logitech’s 7% year-over-year revenue gain to USD 300.5 million in Q2 FY 2025 demonstrates resilience even during semiconductor crunches because accessories rely on less complex chipsets logitech.com. Portfolio breadth now spans low-latency wireless mice, hot-swappable keyboards and tournament-spec headsets, each commanding premium price points. This repeat-purchase behavior buffers the North American gaming hardware market from cyclical console and PC sales.
Core hardware systems—consoles, desktops and laptops—grow more slowly at 8.7% CAGR as longer product generations and supply shortages constrain volume. Vendors mitigate by launching mid-cycle “Pro” refreshes that reprice the stack upward. Strategic component commonality across models simplifies inventory management, achieving cost savings that offset higher silicon prices. Close alliances with semiconductor foundries secure wafer starts for critical chipsets, ensuring that flagship SKUs reach store shelves during peak demand windows. These tactics stabilize revenue streams even when the peripherals segment leads expansion.
By Connectivity Technology: Wireless Becomes the New Baseline
Wireless solutions held 61.20% revenue in 2025, translating to USD 17.41 billion of the North American gaming hardware market share as demand for clutter-free setups surged logitech.com. Wi-Fi 6/7 routers, 2.4 GHz low-latency dongles and Bluetooth LE Audio packets narrow the performance gap with wired connections to single-digit milliseconds, satisfying esports tolerance thresholds. Premium gear uses adaptive frequency hopping to avoid crowded channels, ensuring stable input registration at competitive frame rates. Consequently, wireless peripherals often retail 25–40% higher than their wired counterparts, lifting blended margins across the ecosystem.
Wired devices still resonate among budget buyers and LAN-center operators who favor deterministic latencies and simpler maintenance. Manufacturers protecting this segment introduce braided, ultra-flexible cables that mimic wireless drag profiles. Meanwhile, firmware-upgradable receivers future-proof current purchases for upcoming standards, which elongates product life and indirectly supports sustainable consumption goals. The dual-track approach positions connectivity as a choice rather than a compromise within the North American gaming hardware market.
By End User: Professionals Spark Hardware Arms Race
Casual gamers accounted for 68.25% of 2025 expenditure, equal to USD 19.42 billion of the North American gaming hardware market size. Their purchases concentrate in all-in-one consoles and mid-range headsets that balance price with experience quality. Family-oriented cloud bundles lower the barrier to entry, but they also create pull-through demand for licensed controllers featuring cartoon franchises or sports teams. Casual segment growth mellows toward mid-single-digits as saturation rises, yet absolute spend remains crucial to volume economies of scale.
Professional and competitive gamers, though smaller in headcount, exhibit outsized wallet share and are projected to expand at 13.25% CAGR through 2031. Tournament circuits reward marginal gains in click latency or display response, inspiring an arms race in optical switches, 360 Hz monitors and sub-25 g ultralight mice. Logitech’s ASTRO A40 Tournament Ready headset refresh in June 2024 underscores the commercial logic: pro-grade specs trickle into mainstream demand once influencer streamers validate real-world gains logitech.com . The trickle-down dynamic accelerates technology diffusion across the entire North American gaming hardware market.
Geography Analysis
The United States anchors the North American gaming hardware market with 91.85% revenue share in 2025 as domestic console manufacturing, Silicon Valley engineering talent and Hollywood IP licensing converge to form a robust value chain commerce.gov. Federal incentives worth USD 52.7 billion under the CHIPS Act aim to restore wafer production that fell from 40% of global capacity in 1990 to 12% today, with sixteen new fabs already in the proposal pipeline commerce.gov . Semiconductor self-sufficiency promises to unlock steadier component availability for console and GPU lines, supporting unit sales during peak holiday quarters and reinforcing the long-term dominance of U.S. vendors in the North American gaming hardware market.
Canada, while contributing USD 2.32 billion in 2025 sales, is charting a 15.05% CAGR to 2031 on the back of supportive tax credits, immigration-friendly labor policies and landmark infrastructure like Toronto’s USD 500 million arena scheduled for completion in 2025 overactivemedia.com . Provincial grants under programs such as Ontario’s Interactive Digital Media Fund lower entry barriers for startups developing VR content and specialized peripherals. Cross-border proximity enables rapid distribution into U.S. e-tail channels, amplifying reach without duplicating logistics footprints. As Canadian events attract international audiences, hardware sponsorship rotations drive brand visibility and incremental demand that circulates capital within the region, thus elevating the broader North American gaming hardware market.
Cross-border trade harmonization under USMCA maintains negligible tariffs on finished gaming devices and most sub-assemblies, preserving cost competitiveness. Joint cybersecurity protocols streamline firmware certification, enabling same-day over-the-air updates across both countries. Government agencies also collaborate on standards for accessibility and digital wellness, nudging OEMs to integrate eye-strain mitigation and parental controls at hardware level. These converging regulatory frameworks shorten product development cycles and strengthen the unified appeal of the North American gaming hardware market to global investors.
Competitive Landscape
Sony leads the console arena after shipping 9.5 million PlayStation 5 units in the 2024 holiday quarter, bringing cumulative sales to 74.9 million since launch sony.com. Its portfolio extension with PS5 Pro positions the brand at multiple price tiers and fuels accessory cross-sales, cementing influence across the North American gaming hardware market. Microsoft’s hardware volume trails yet the company leverages Xbox Game Pass to secure engagement and data for service-led monetization. Nintendo retains a distinct demographic with the evergreen Switch platform, which surpassed PlayStation 2 lifetime U.S. sales in late 2024 nintendo.com.
PC hardware leadership remains contested. Dell’s Alienware doubled down on user-serviceable architectures with the 2025 Area-51 relaunch, aiming to regain share from boutique integrators that have long championed open standards delltechnologies.com. Component suppliers AMD, Intel and Nvidia underpin this tier through rapid cadence of process-node transitions, albeit tempered by wafer allocation toward AI server chips. Peripherals are dominated by Logitech, which posted USD 300.5 million in gaming revenue for Q2 FY 2025, ahead of Razer, Corsair and HyperX logitech.com.
Strategic M&A focuses on filling capability gaps in haptics, low-power wireless ICs and cross-platform software suites. Logitech’s historical acquisitions of Blue Microphones and ASTRO Gaming showcase the playbook, while newcomers pursue defensive patent buys to deter litigation. Semiconductor scarcity shapes go-to-market sequencing: firms with guaranteed chip supply bring products to shelf first, capturing early adopter margins. The CHIPS Act’s guardrails prevent subsidy recipients from materially expanding in countries of concern for a decade, nudging OEMs toward North American or allied fabs nist.gov. Overall, the competitive landscape balances entrenched scale players with nimble specialists, keeping innovation velocity high across the North American gaming hardware market.
North America Gaming Hardware And Accessories Industry Leaders
Sony Group Corp.
Microsoft Corp. (Xbox)
Nintendo Co., Ltd.
Logitech International S.A.
Dell Technologies Inc. (Alienware)
- *Disclaimer: Major Players sorted in no particular order

Recent Industry Developments
- March 2025: Dell reintroduced its Alienware Area-51 lineup featuring Intel Core Ultra processors and Nvidia RTX 50-series GPUs, with desktops starting at USD 3,749.99
- March 2025: Alienware launched the AW2725D 27-inch QD-OLED gaming monitor at USD 549
- February 2025: Sony recorded 9.5 million PlayStation 5 sales in the 2024 holiday quarter, lifting cumulative units to 74.9 million
- January 2025: Meta Quest 3S underperformed with app downloads dropping 27% on Christmas Day 2024 versus 2023


North America Gaming Hardware And Accessories Market Report Scope
A video game accessory is a distinct piece of hardware required to use a video game console or one that enriches the gaming experience. Gaming hardware accessories comprise all devices besides hardware in a gaming system. The scope of the study focuses on the market analysis of gaming accessories and hardware, and market size encompasses the demand for gaming hardware products and accessories offered by various market players in North America. The study also tracks the key market parameters, underlying growth influencers, and major vendors operating in the industry, which supports market estimations and growth rates over the forecast period.
The North American gaming hardware and accessories market is segmented by product type (gaming PCs, gaming consoles, gaming headsets [PC headsets, console headsets], gaming keyboards, gaming mice, gaming controllers/joysticks/gamepads, virtual reality devices, other gaming accessories), by country (United States, Canada). The report offers market forecasts and size in value (USD) for all the above segments.
| Gaming PCs | |
| Gaming Consoles | |
| Gaming Headsets | PC Headsets |
| Console Headsets | |
| Gaming Keyboards | |
| Gaming Mice | |
| Gaming Controllers / Joysticks / Gamepads | |
| Virtual Reality Devices | |
| Streaming and Capture Hardware | |
| Other Gaming Accessories |
| Hardware (Core Systems) |
| Peripherals and Accessories |
| Wired |
| Wireless (2.4 GHz, Bluetooth, Wi-Fi 6/7) |
| Casual Gamers |
| Professional and Competitive Gamers |
| Gaming Cafes and Esports Arenas |
| Others |
| United States |
| Canada |
| By Product Type | Gaming PCs | |
| Gaming Consoles | ||
| Gaming Headsets | PC Headsets | |
| Console Headsets | ||
| Gaming Keyboards | ||
| Gaming Mice | ||
| Gaming Controllers / Joysticks / Gamepads | ||
| Virtual Reality Devices | ||
| Streaming and Capture Hardware | ||
| Other Gaming Accessories | ||
| By Component | Hardware (Core Systems) | |
| Peripherals and Accessories | ||
| By Connectivity Technology | Wired | |
| Wireless (2.4 GHz, Bluetooth, Wi-Fi 6/7) | ||
| By End User | Casual Gamers | |
| Professional and Competitive Gamers | ||
| Gaming Cafes and Esports Arenas | ||
| Others | ||
| By Country | United States | |
| Canada | ||


Key Questions Answered in the Report
What is the current value of the North American gaming hardware market?
The North America Gaming Hardware And Accessories Market size is estimated at USD 31.62 billion in 2026, and is expected to reach USD 53.64 billion by 2031, at a CAGR of 11.15% during the forecast period (2026-2031).
Which country is expanding fastest within the North American gaming hardware market?
Canada is projected to grow at a 15.05% CAGR between 2026 and 2031, outpacing the United States.
Which product segment shows the highest forecast growth?
Virtual Reality Devices are expected to grow at 18.74% CAGR, driven by next-gen headsets from Meta and Apple.
How significant are peripherals in overall spending?
Peripherals & Accessories represent 54.40% of 2025 revenue and maintain the strongest recurring sales patterns.
Page last updated on:


