Market Overview
| Study Period | 2021 - 2031 |
|---|---|
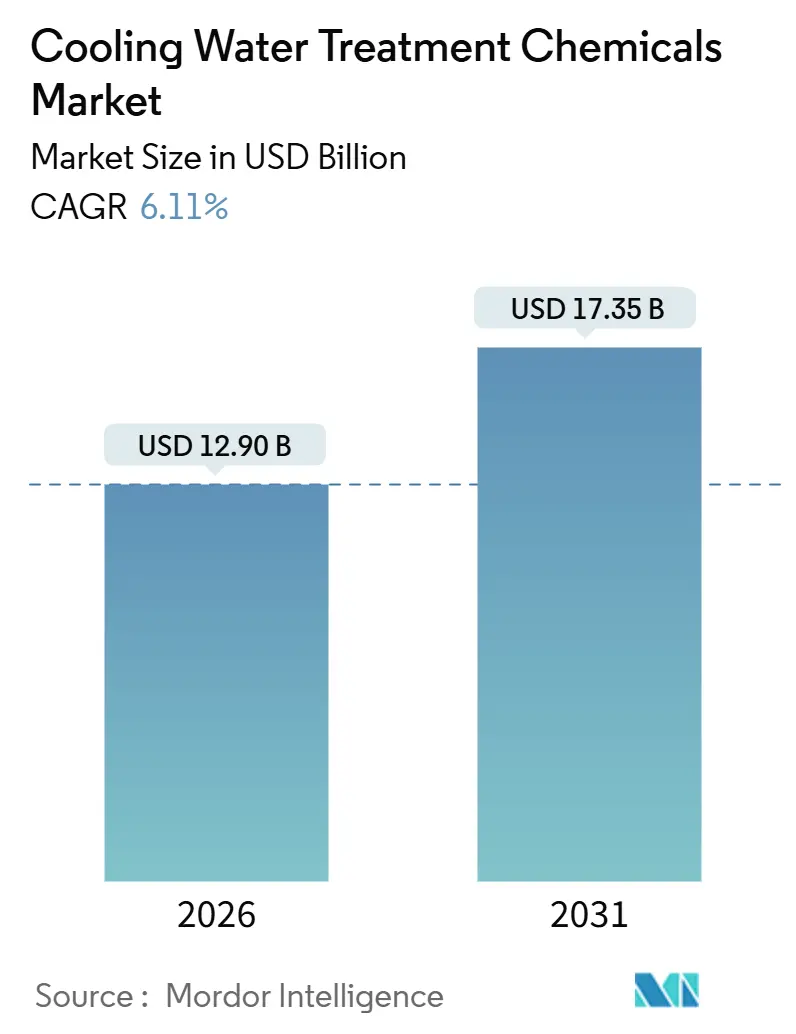
| Market Size (2026) | USD 12.90 Billion |
| Market Size (2031) | USD 17.35 Billion |
| Growth Rate (2026 - 2031) | 6.11% CAGR |
| Fastest Growing Market | Asia Pacific |
| Largest Market | Asia Pacific |
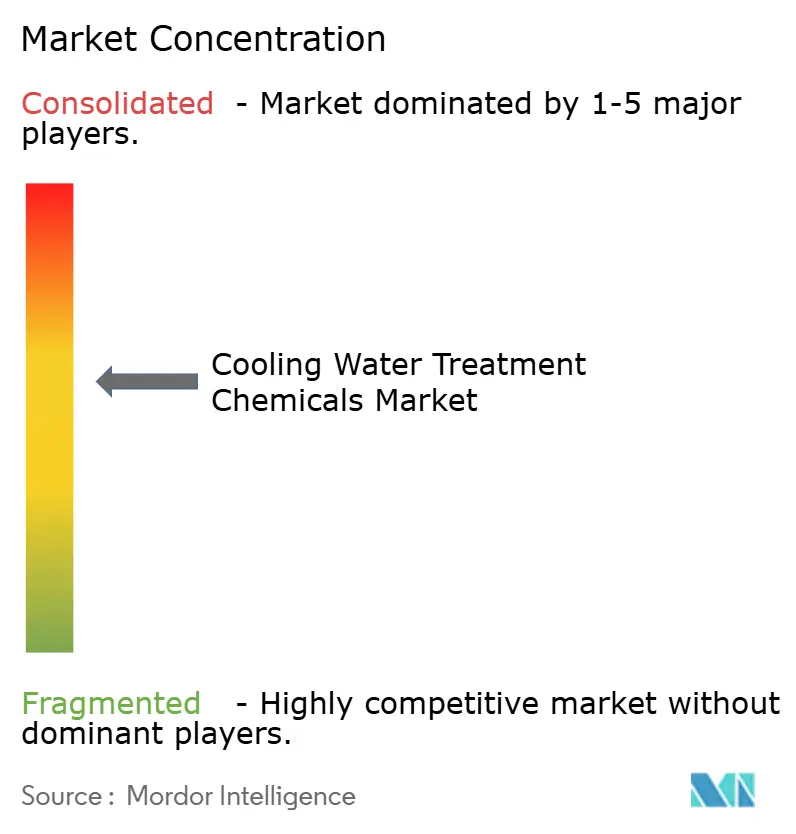
| Market Concentration | Medium |
Major Players *Disclaimer: Major Players sorted in no particular order Image © Mordor Intelligence. Reuse requires attribution under CC BY 4.0. | |
Cooling Water Treatment Chemicals Market Analysis by Mordor Intelligence
The Cooling Water Treatment Chemicals Market size is estimated at USD 12.90 billion in 2026, and is expected to reach USD 17.35 billion by 2031, at a CAGR of 6.11% during the forecast period (2026-2031). Strong sovereign-level infrastructure mandates, the rapid scale-up of data-intensive industries, and stricter water-reuse rules are the primary forces expanding the Cooling Water Treatment Chemicals market. Asia-Pacific is the focal point of manufacturing relocation from China to Vietnam, Indonesia, and Bangladesh, a transition that lifts chemical demand for corrosion, scale, and microbial control in new industrial parks. Power-generation build-outs in China, India, and Indonesia alone add 250 gigawatts of cooling-intensive capacity that must run reliably at higher cycles of concentration, amplifying sales of premium phosphonate inhibitors. Data-center operators pursuing closed-loop liquid cooling raise microbial risk in compact water volumes, accelerating uptake of fast-acting biocides and smart-dosing platforms that curb overfeed and conserve water. Meanwhile, price swings exceeding 30% for acrylic acid and phosphorus intermediates encourage formulators to develop bio-derived alternatives that stabilize margins and help buyers hedge raw-material shocks.
Key Report Takeaways
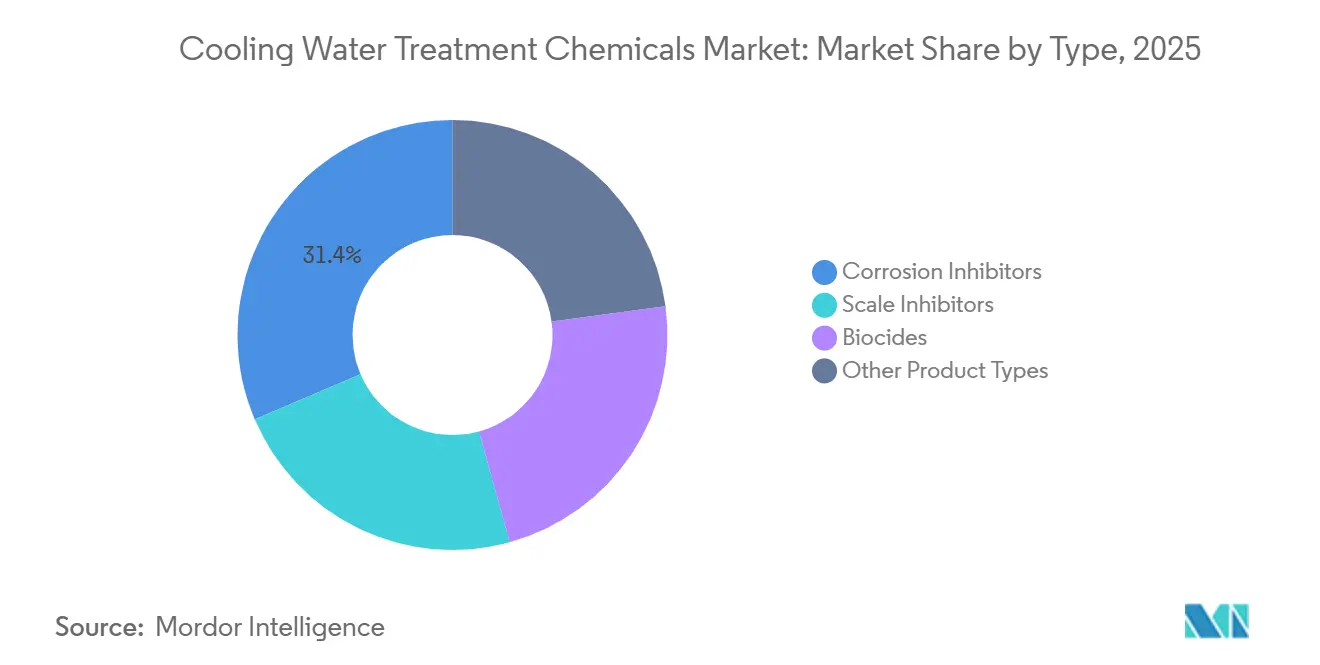
- By type, corrosion inhibitors led with 31.43% revenue share in 2025; biocides are forecast to expand at a 7.21% CAGR to 2031.
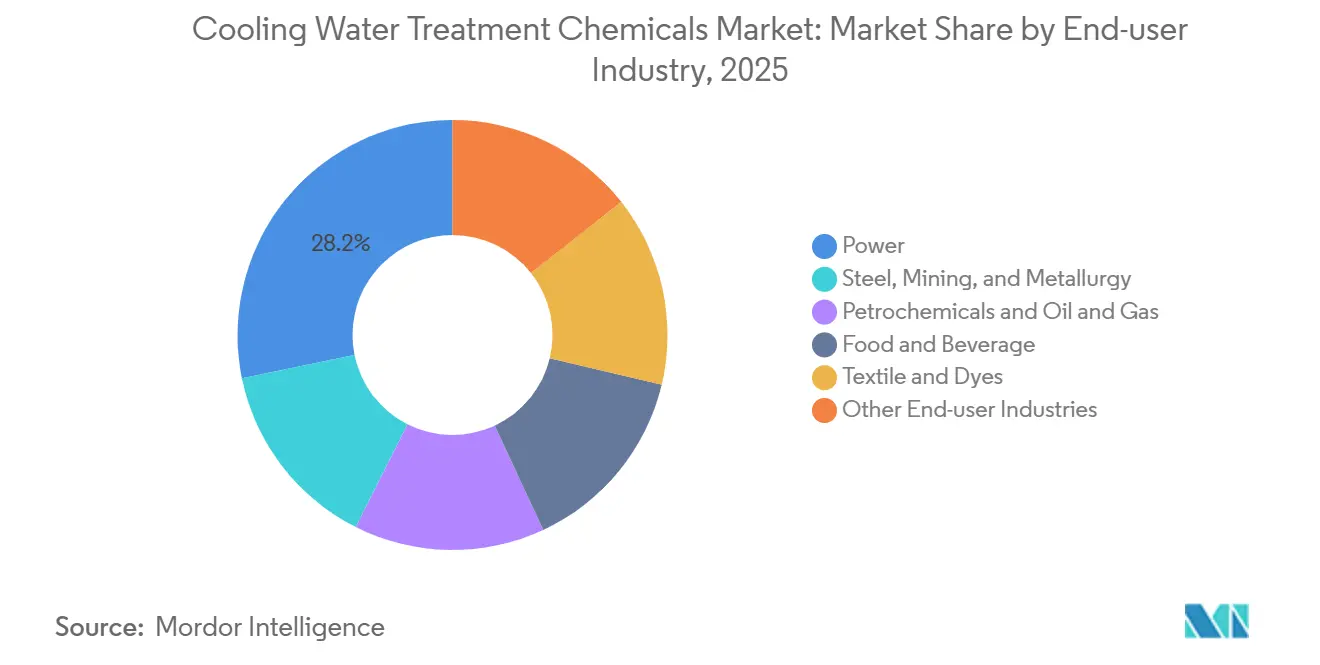
- By end-user industry, the power segment held 28.22% of the Cooling Water Treatment Chemicals market share in 2025, while the power industry is forecast to highest projected CAGR at 7.41% through 2031.
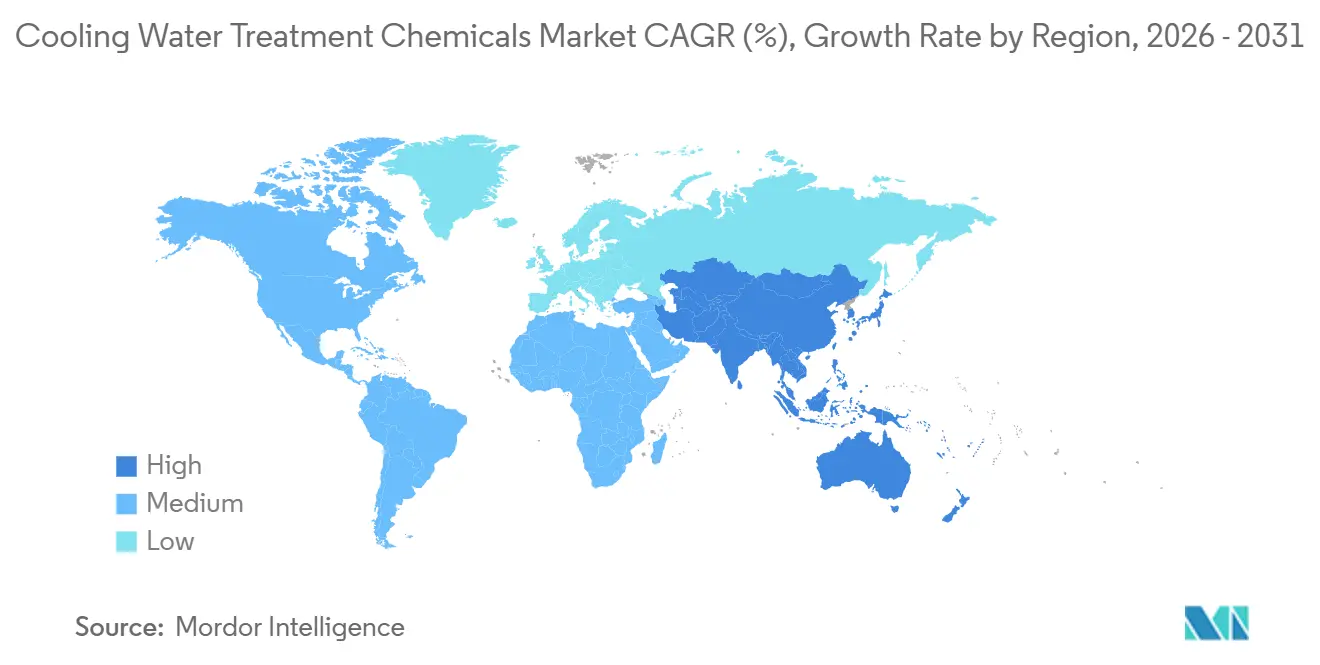
- By geography, Asia-Pacific accounted for 43.70% of global revenue in 2025 and is advancing at a 7.49% CAGR through 2031.
Note: Market size and forecast figures in this report are generated using Mordor Intelligence’s proprietary estimation framework, updated with the latest available data and insights as of January 2026.
Global Cooling Water Treatment Chemicals Market Trends and Insights
Drivers Impact Analysis
| Drivers | (~) % Impact on CAGR Forecast | Geographic Relevance | Impact Timeline |
|---|---|---|---|
| Accelerating growth of the power industry | +1.8% | Global, concentrated in APAC and Middle East | Medium term (2-4 years) |
| Stringent environmental and water-reuse regulations | +1.5% | North America and EU, spillover to APAC | Long term (≥ 4 years) |
| Industrial expansion across the Asia-Pacific | +1.4% | APAC core, spillover to MEA | Medium term (2-4 years) |
| Rising digital and AI-driven smart-dosing adoption | +0.9% | Global, early gains in North America and EU | Short term (≤ 2 years) |
| Data-center cooling demand surge | +0.6% | North America, Western Europe, Singapore | Short term (≤ 2 years) |
| Source: Mordor Intelligence | |||
Accelerating Growth of the Power Industry
Between 2024 and 2028, global baseload capacity will rise due to ongoing coal and nuclear projects. Cooling chemistry plays a vital role in safeguarding condensers that operate above 35 °C[1]American Society of Mechanical Engineers, “Boiler and Pressure Vessel Code Updates,” asme.org. In Southeast Asia, Indonesia's power pipeline and Vietnam's revitalized nuclear programs grapple with humid, saline climates. These conditions intensify challenges like biofilm growth and calcium scaling. Meanwhile, supercritical and ultra-supercritical boilers, operating at high steam pressures, demand stringent impurity tolerances. This preference leans towards premium polymer blends, adept at curbing under-deposit corrosion[2]Electric Power Research Institute, “Advances in Supercritical Boiler Technology,” epri.com . Furthermore, mandates like closed-cycle and zero-liquid-discharge, as per ISO 14001, can escalate chemical dosages. This is a tactic operators employ to achieve elevated cycles of concentration. Together, these technical nuances and regulatory frameworks are propelling the Cooling Water Treatment Chemicals market in both established and developing nations.
Stringent Environmental and Water-Reuse Regulations
In water-stressed zones, the EU Water Reuse Regulation mandates multiple cycles of concentration for cooling towers, effectively doubling the residence time for inhibitors and biocides. California's revisions to Title 22 now permit the use of tertiary effluent for industrial cooling, provided total suspended solids remain within permissible limits. This stipulation heightens the demand for robust biocide programs. China's GB 50050-2024 mandates real-time monitoring of conductivity and pH for high-volume cooling loops, leading to a swift uptake of Ecolab's 3D TRASAR and Grundfos' iSOLUTIONS in Jiangsu and Guangdong. Meanwhile, India's revised chloride limit is steering textile and steel mills towards using lower-chloride inhibitors. Collectively, these regulations elevate the baseline chemical requirements, further entrenching the Cooling Water Treatment Chemicals market in these governed regions.
Industrial Expansion Across Asia-Pacific
In 2025, ASEAN's manufacturing value added grew significantly, surpassing China's growth as electronics and petrochemical plants migrated to Vietnam, Thailand, and Indonesia. Vietnam plans new industrial zones, each outfitted with centralized cooling water circuits that must treat diverse process streams. India’s Production-Linked Incentive schemes attracted substantial greenfield investment, with zero-liquid-discharge cooling systems boosting chemical intensity. Japan’s TSMC Kumamoto and Rapidus Hokkaido fabs revive ultra-pure water demand requiring non-ionic dispersants that will not foul sub-7 nm lithography lines. These developments collectively elevate the Cooling Water Treatment Chemicals market across the wider Asia-Pacific corridor.
Rising Digital and AI-Driven Smart-Dosing Adoption
Across towers globally, Ecolab’s 3D TRASAR employs machine learning to monitor fluorescent tracers, reducing chemical overfeed. Grundfos iSOLUTIONS harnesses cloud analytics to align variable-speed pumps, predicting scale formation before it's visible. ABB’s Ability platform, by modeling cooling-tower chemistry under varying loads, empowers steel mills to fine-tune blowdown and chemical consumption. At a Belgian pharmaceutical site, Waterleau SmartDose reduced biocide usage by correlating ATP readings with dosing actuators. Programs like the U.S. DOE Better Plants award recognize digital adopters, fostering peer pressure that amplifies market adoption. These advancements not only bolster the Cooling Water Treatment Chemicals market but also integrate chemical sales into enduring service contracts.
Restraints Impact Analysis
| Restraints | (~) % Impact on CAGR Forecast | Geographic Relevance | Impact Timeline |
|---|---|---|---|
| Lack of awareness among SMEs | -0.5% | South Asia, Southeast Asia, Latin America, Africa | Medium term (2-4 years) |
| Increasing use of non-chemical chlorine alternatives | -0.7% | North America, Western Europe | Medium term (2-4 years) |
| Raw-material price volatility for specialty polymers | -0.5% | Global | Short term (≤ 2 years) |
| Source: Mordor Intelligence | |||
Increasing Use of Non-Chemical Chlorine Alternatives
In 2025, ultraviolet, ozone, and on-site electrochlorination systems accounted for a notable share of new cooling-tower installations, a significant increase from their 2022 share. This surge comes as operators seek to sidestep hazardous-material reporting mandated by OSHA and the EPA's Tier II. A power plant in Texas reduced its biocide costs with the installation of an electrochlorination skid. However, this came at a capital expense higher than that of conventional feed units. Food processors, aiming for organic certification—which prohibits halogenated compounds—are now testing ozone. Despite the advantages, UV and ozone systems present a financial hurdle for SMEs, with costs being a significant factor for mid-size towers. Meanwhile, the EPA's Safer Choice certification bolsters the credibility of non-halogen biocides, pushing chemical suppliers to either innovate or face obsolescence. These dynamics collectively dampen the growth trajectory of the Cooling Water Treatment Chemicals market.
Raw-Material Price Volatility for Specialty Polymers
In January 2024, acrylic acid prices increased significantly by October 2025, driven by outages in Gulf Coast propylene and shutdowns at BASF. In 2025, costs for phosphorus pentoxide rose after Yunnan and Guizhou limited their energy-intensive production. This led to a shift towards blends with lower phosphorus content. Since 2023, mid-tier formulators have experienced margin declines, prompting industry consolidation and extended tolling agreements with monomer suppliers in Asia. SNF revealed that part of its cooling portfolio now incorporates corn-starch polymers. These polymers not only fetch a premium but also provide a buffer against fluctuations in petrochemical prices. The EU's Carbon Border Adjustment Mechanism imposes additional costs by taxing phosphorus imports from jurisdictions that don't comply. While these challenges slightly restrain the Cooling Water Treatment Chemicals market, they also drive a push towards greener innovations.
Segment Analysis
By Type – Biocides Gain Momentum While Corrosion Inhibitors Retain Scale
The Cooling Water Treatment Chemicals market size for corrosion inhibitors is equal to 31.43% of the overall revenue. Their entrenched role in safeguarding carbon-steel exchangers secures steady demand even as users migrate to higher cycles of concentration. Biocides, however, are projected to deliver a 7.21% CAGR to 2031, the fastest among all product classes, since closed-loop liquid cooling in data centers concentrates microbial risk in compact volumes. EU removal of eight legacy actives under BPR rules forces formulators to roll out hydrogen peroxide and bromine products that command higher unit prices. Scale inhibitors gain share in arid regions as operators chase low blowdown ratios, and fluorescent tracers allow real-time dosage optimization through smart sensors. Other product groups— dispersants, defoamers, and pH adjusters—innovate around non-ionic surfactants that minimize foam at high velocities, supporting incremental value creation within the Cooling Water Treatment Chemicals market.
Rapid regulatory churn shapes the chemistry mix. Phosphonate-free blends help European buyers comply with tightening phosphorus discharge norms, while amino-acid derivatives meet sustainability metrics for multinational firms under Science-Based Targets. Suppliers with agile research and development pipelines secure specification wins, reinforcing the Cooling Water Treatment Chemicals market share of companies that commercialize compliant solutions swiftly.
Note: Segment shares of all individual segments available upon report purchase
Get Detailed Market Forecasts at the Most Granular Levels
Download PDF
By End-User Industry – Power Sector Remains Anchor Customer
The Cooling Water Treatment Chemicals market size for the power sector, accounting for 28.22% of total revenue and registers the highest segmental CAGR of 7.41% forecast to 2031. Coal, nuclear, and combined-cycle plants all run large condenser circuits that demand multi-functional chemistries. Supercritical units operating above 25 MPa adopt polymer-phosphonate blends resistant to high-temperature hydrolysis. Steel, mining, and metallurgy require inhibitors that tolerate 80 °C closed loops, while petrochemicals seek non-oxidizing biocides stable in hydrocarbon-laden water. Food-and-beverage processors deploy peracetic acid to remove halogen residues prohibited by hygiene codes, and textile mills in South Asia exhibit chronic under-dosing gaps that smart-dosing contracts aim to close.
Demand diversification underlines market resilience. Semiconductor fabs in Japan and Taiwan require ultra-low conductivity to protect sub-7 nm lithography, driving uptake of highly pure dispersants. Data centers impose narrow silica and hardness limits to meet ASHRAE TC 9.9 standards, boosting advanced scale-control packages. Together, these varied needs broaden the Cooling Water Treatment Chemicals market footprint across multiple customer verticals.
Note: Segment shares of all individual segments available upon report purchase
Get Detailed Market Forecasts at the Most Granular Levels
Download PDF
Geography Analysis
Asia-Pacific generated 43.70% of global revenue in 2025 and is expected to grow at a 7.49% CAGR to 2031. China leads the charge, adding nuclear power, establishing new industrial parks, and enforcing mandatory smart-dosing for systems exceeding specific thresholds as per GB 50050-2024. Meanwhile, India is channeling investments into greenfield plants, mandating zero-liquid-discharge cooling, which could amplify chemical intensity. Japan is witnessing a semiconductor revival, and South Korea is bolstering its petrochemical sector with substantial investments, both contributing to heightened regional consumption.
In North America, the U.S. EPA's effluent guideline limits total dissolved solids, driving the adoption of higher cycles and robust inhibitor programs. The clustering of hyperscale data centers in Virginia, Oregon, and Texas is amplifying the demand for non-oxidizing biocides and silica dispersants. Additionally, Canada's oil sands and Mexico's near-shoring ventures in the automotive and electronics sectors are fueling incremental growth. Europe's market is influenced by EU regulations on water reuse and biocides, which limit active substance choices and steer users towards premium offerings.
South America witnesses expansions in pulp, paper, and petrochemicals in Brazil. At the same time, Argentina's Vaca Muerta shale is increasing cooling-water demands for hydraulic fracturing. In Chile and Peru, copper and lithium mines are implementing advanced scale inhibitors to handle high-TDS water in electrowinning circuits. The Middle East and Africa are bolstering their petrochemical and power sectors; for instance, Saudi Aramco's Jafurah gas project requires corrosion control in saline environments, and South Africa's Eskom refurbishments are opting for zero-liquid-discharge solutions. These regional activities collectively bolster the demand for Cooling Water Treatment Chemicals.
Get Analysis on Important Geographic Markets
Download PDF
Competitive Landscape
The water treatment chemicals market is moderately segmented. Technology is the key differentiator. Suppliers offering AI-enabled dosing command price premiums, locking in multi-year contracts that reduce churn. Bio-based innovators launch amino-acid inhibitors and plant-extract biocides that help buyers meet Science Based Targets emissions goals. Procurement officers in steel, petrochemical, and food plants pursue dual-sourcing to hedge raw-material shocks, allowing regional players like Thermax and Chemtex to win localized contracts with bundled chemicals, equipment, and remote monitoring. Together, these strategic moves shape competition within the Cooling Water Treatment Chemicals market.
Cooling Water Treatment Chemicals Industry Leaders
Ecolab Inc.
Veolia
Solenis
Kemira
Nouryon
- *Disclaimer: Major Players sorted in no particular order
Need More Details on Market Players and Competitors?
Download PDF
Recent Industry Developments
- September 2025: Kemira agreed to acquire Nebraska-based Water Engineering for about USD 150 million, aiming to double water revenue before the 2026 close.
- April 2024: Nalco Water, an Ecolab company, launched the Premium Cooling Water Program, combining digital intelligence with low-phosphorus chemistries to optimize uptime for power and metals customers.
Global Cooling Water Treatment Chemicals Market Report Scope
Cooling Water Treatment Chemicals are chemical agents that remove bacteria from cooling systems. Cooling water treatment chemicals are primarily used for cleaning water during power generation.
The Cooling Water Treatment Chemicals market is segmented by type, end-user industry, and geography. By type, the market is segmented into corrosion inhibitors, scale inhibitors, biocides, and other product types. By end-user industry, the market is segmented into power, steel, mining, and metallurgy, petrochemicals and oil and gas, food and beverage, textile and dyes, and other end-user industries. The report also covers the market size and forecasts in 15 countries across major regions. For each segment, the market sizing and forecasts have been done on the basis of revenue (USD).
By Type
| Corrosion Inhibitors |
| Scale Inhibitors |
| Biocides |
| Other Product Types (Oil and Organic Dispersant, Biodispersants, Biopenetrants, Defoamers, pH adjusters, and Others) |
By End-user Industry
| Power |
| Steel, Mining, and Metallurgy |
| Petrochemicals and Oil and Gas |
| Food and Beverage |
| Textile and Dyes |
| Other End-user Industries (Chemical Manufacturing (incl. specialty chemicals), Pulp and Paper, HVAC systems in large buildings, Data Centers, Electronics and Semiconductors, Pharmaceuticals and others) |
By Geography
| Asia-Pacific | China |
| India | |
| Japan | |
| South Korea | |
| Rest of Asia-Pacific | |
| North America | United States |
| Canada | |
| Mexico | |
| Europe | Germany |
| United Kingdom | |
| France | |
| Italy | |
| Rest of Europe | |
| South America | Brazil |
| Argentina | |
| Rest of South America | |
| Middle-East and Africa | Saudi Arabia |
| South Africa | |
| Rest of Middle-East and Africa |
| By Type | Corrosion Inhibitors | |
| Scale Inhibitors | ||
| Biocides | ||
| Other Product Types (Oil and Organic Dispersant, Biodispersants, Biopenetrants, Defoamers, pH adjusters, and Others) | ||
| By End-user Industry | Power | |
| Steel, Mining, and Metallurgy | ||
| Petrochemicals and Oil and Gas | ||
| Food and Beverage | ||
| Textile and Dyes | ||
| Other End-user Industries (Chemical Manufacturing (incl. specialty chemicals), Pulp and Paper, HVAC systems in large buildings, Data Centers, Electronics and Semiconductors, Pharmaceuticals and others) | ||
| By Geography | Asia-Pacific | China |
| India | ||
| Japan | ||
| South Korea | ||
| Rest of Asia-Pacific | ||
| North America | United States | |
| Canada | ||
| Mexico | ||
| Europe | Germany | |
| United Kingdom | ||
| France | ||
| Italy | ||
| Rest of Europe | ||
| South America | Brazil | |
| Argentina | ||
| Rest of South America | ||
| Middle-East and Africa | Saudi Arabia | |
| South Africa | ||
| Rest of Middle-East and Africa | ||
Need A Different Region or Segment?
Customize Now
Key Questions Answered in the Report
How large is the Cooling Water Treatment Chemicals market in value terms?
The market was valued at USD 12.90 billion in 2026 and is projected to reach USD 17.35 billion by 2031, registering a 6.11% CAGR.
Which segment shows the fastest growth in Cooling Water Treatment Chemicals?
Biocides are expected to record the highest 7.21% CAGR through 2031 as closed-loop data-center cooling intensifies microbial control needs.
Which end-user accounts for the largest share of chemical demand?
Power-generation facilities held 28.22% of 2025 revenue and remain the anchor customer group amid 250 GW of new baseload capacity additions.
Why is Asia-Pacific pivotal for future sales?
Asia-Pacific commands 43.70% of global revenue and is expanding at a 7.49% CAGR thanks to manufacturing shifts, power projects, and new industrial parks.
How are suppliers differentiating in a fragmented competitive arena?
Leading vendors bundle AI-enabled dosing platforms with performance guarantees, while niche players launch bio-based inhibitors to meet sustainability targets.


