Ballast Water Treatment Market Size and Share
Market Overview
| Study Period | 2021 - 2031 |
|---|---|
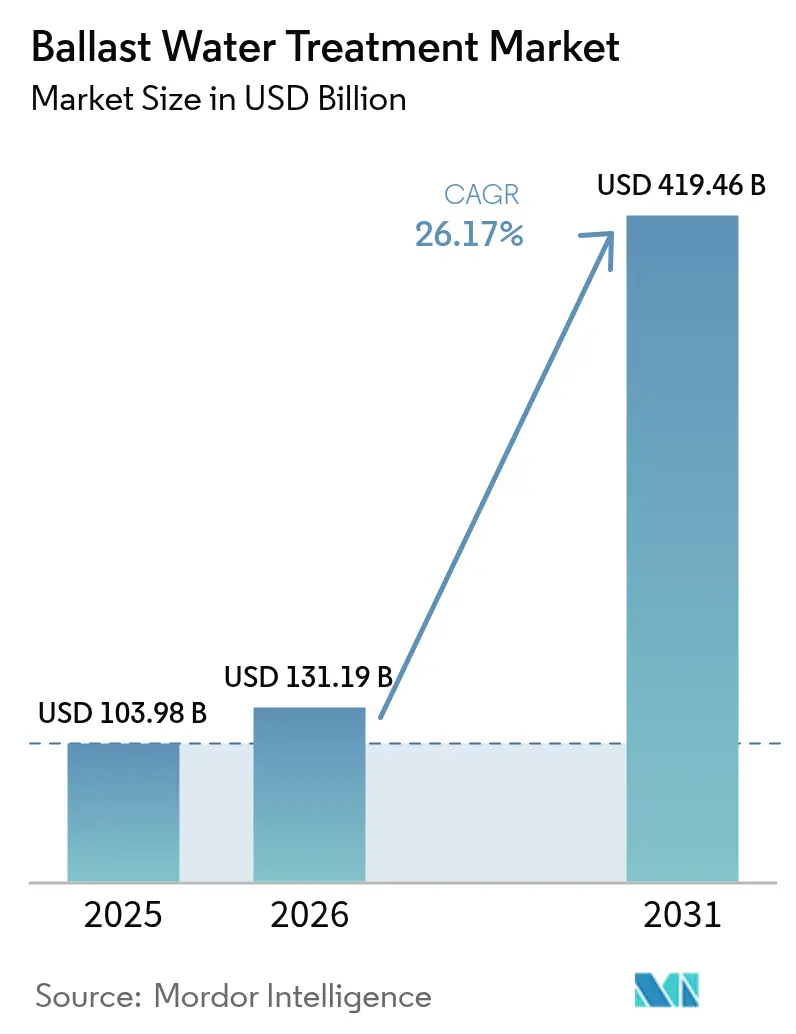
| Market Size (2026) | USD 131.19 Billion |
| Market Size (2031) | USD 419.46 Billion |
| Growth Rate (2026 - 2031) | 26.17% CAGR |
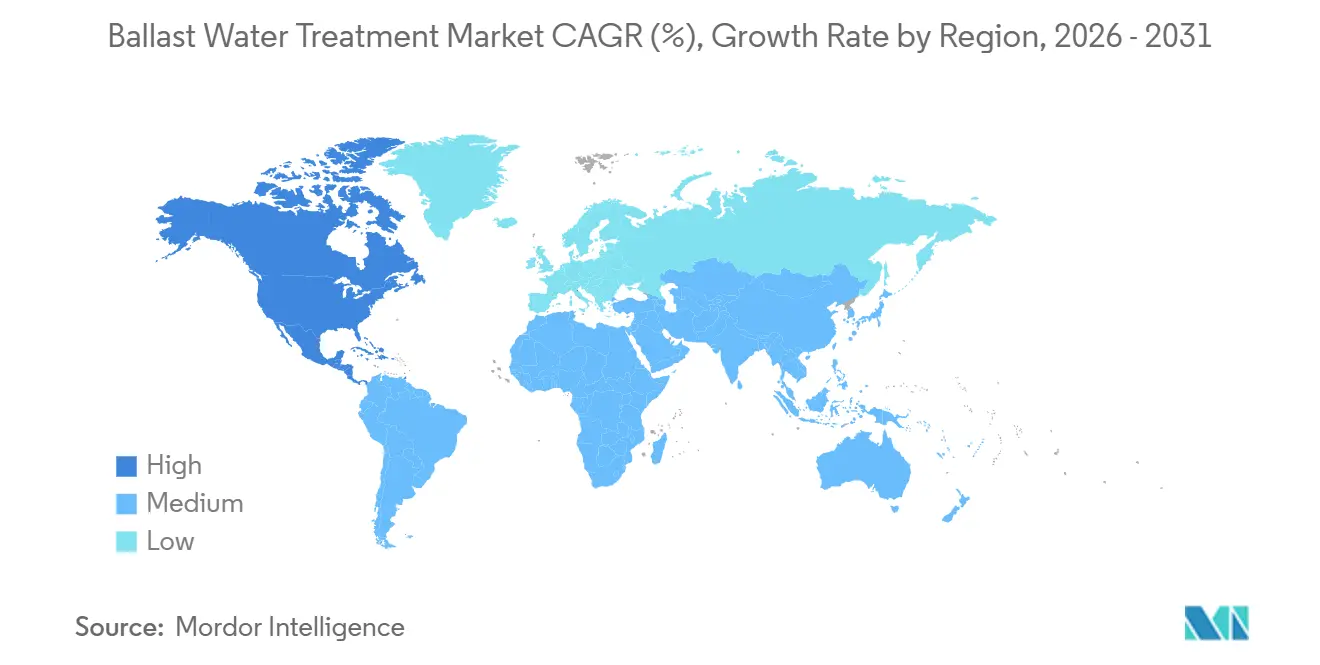
| Fastest Growing Market | North America |
| Largest Market | Asia Pacific |
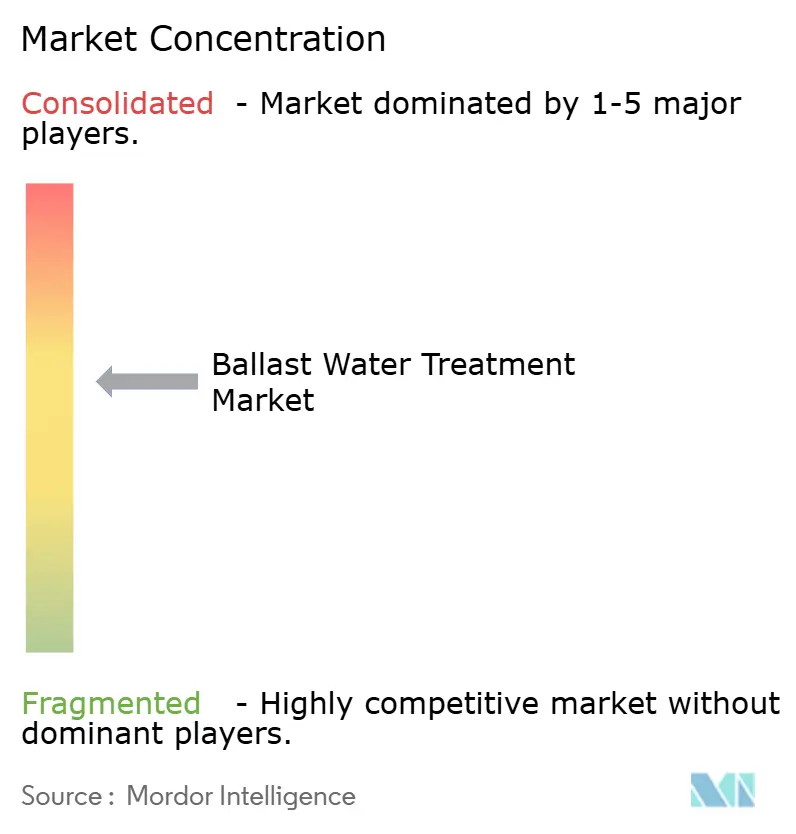
| Market Concentration | Medium |
Major Players *Disclaimer: Major Players sorted in no particular order Image © Mordor Intelligence. Reuse requires attribution under CC BY 4.0. | |
Ballast Water Treatment Market Analysis by Mordor Intelligence
The Ballast Water Treatment Market size is expected to increase from USD 103.98 billion in 2025 to USD 131.19 billion in 2026 and reach USD 419.46 billion by 2031, growing at a CAGR of 26.17% over 2026-2031. Regulatory pressures from the International Maritime Organization's D-2 biological standard, coupled with deadlines for type-approval set by the United States Coast Guard, are tightening the retrofit schedule for active vessels. This urgency ensures that capital-expenditure pipelines remain robust. Starting in October 2025, new mandates for digital record-keeping will heighten audit requirements. This shift amplifies the demand for Internet-of-Things-ready systems capable of transmitting real-time compliance data. At the same time, the Carbon Intensity Indicator framework is incentivizing vessel owners to adopt energy-efficient disinfection methods. This trend is giving ultraviolet platforms a distinct advantage in operating costs compared to their electrolytic counterparts. Additionally, as the costs of ultraviolet lamps decrease and their lifespan extends, these savings become even more pronounced, altering the total-cost-of-ownership dynamics in favor of physical systems.
Key Report Takeaways
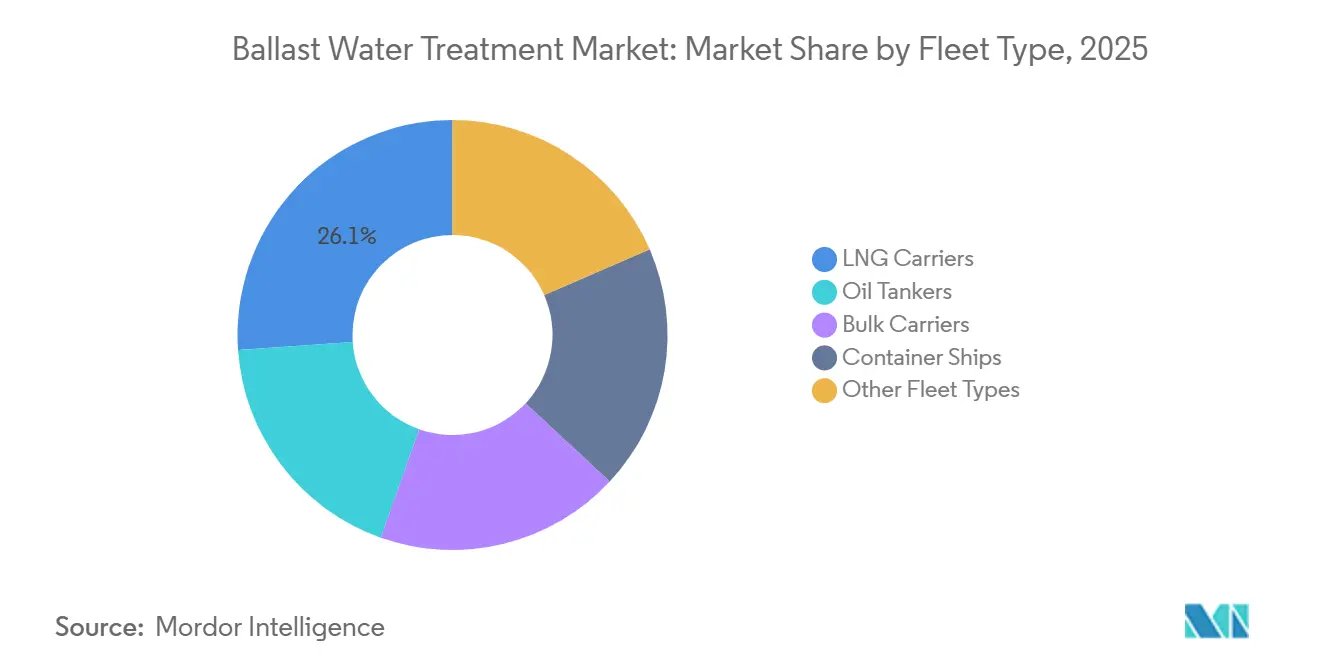
- By fleet type, LNG carriers captured 26.12% of the ballast water treatment market share in 2025; oil tankers are projected to expand at a 26.27% CAGR through 2031.
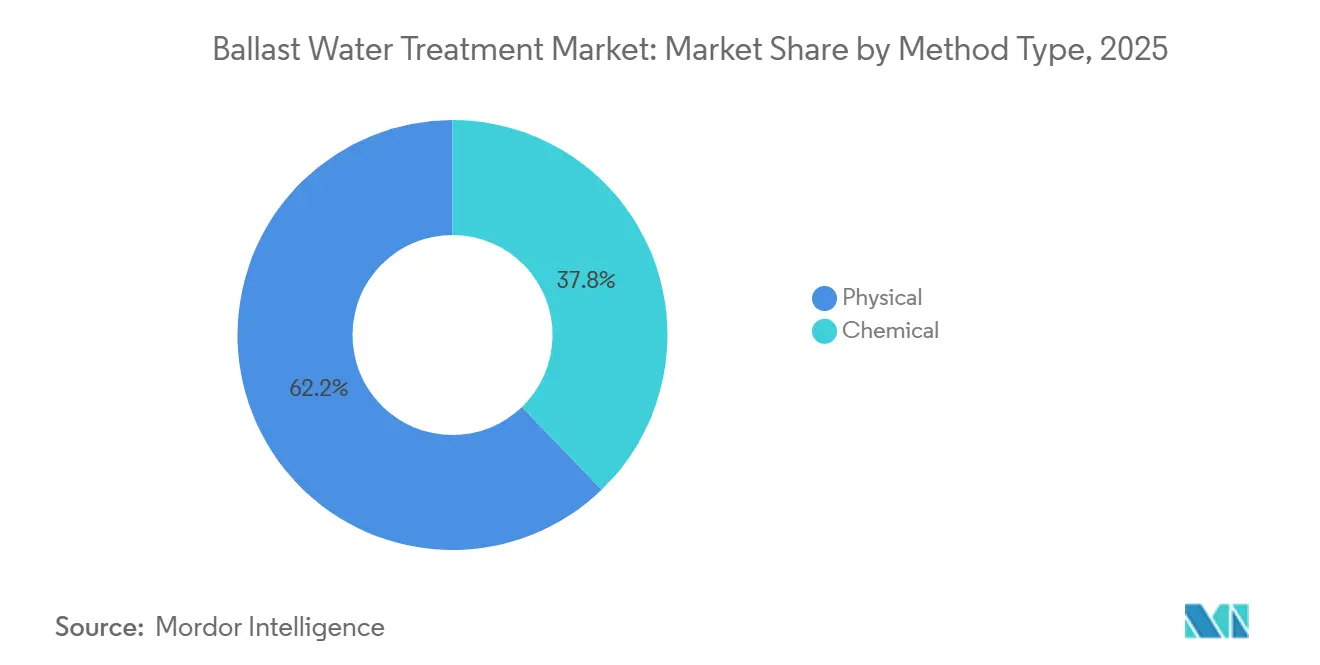
- By method type, physical systems led with 62.22% revenue share in 2025 and show a 26.58% CAGR outlook to 2031.
- By geography, Asia-Pacific held 83.66% share of the ballast water treatment market size in 2025, while North America is advancing at a 28.10% CAGR to 2031.
Note: Market size and forecast figures in this report are generated using Mordor Intelligence’s proprietary estimation framework, updated with the latest available data and insights as of 2026.
Global Ballast Water Treatment Market Trends and Insights
Drivers Impact Analysis*
| Drivers | (~) % Impact on CAGR Forecast | Geographic Relevance | Impact Timeline |
|---|---|---|---|
| Stringent IMO and USCG Compliance Deadlines | +6.5% | Global, with North America enforcement intensity highest | Short term (≤ 2 years) |
| Expansion of Global Shipping Fleet and Retrofit Wave | +5.8% | Asia-Pacific core (China, South Korea, Japan), spill-over to Europe and North America | Medium term (2-4 years) |
| Rapid Cost-Down in UV-Based Physical Disinfection | +3.2% | Global, with early adoption in Europe and North America | Medium term (2-4 years) |
| Digital-Twin Analytics for Fleet-Wide BWTS Optimisation | +2.1% | Europe (Norway, Netherlands), expanding to Asia-Pacific | Long term (≥ 4 years) |
| Carbon-Intensity Indicator (CII) Pressure on Energy-Efficient BWTS | +2.8% | Global, with EU and IMO member states leading | Long term (≥ 4 years) |
| Source: Mordor Intelligence | |||
Stringent IMO and USCG Compliance Deadlines
Starting in 2024, the full enforcement of the D-2 biological limit left vessels non-compliant due to deferred dry-docking and inconsistent oversight from flag states. The USCG's stringent land-based testing regime disqualified several systems approved in Europe. As a result, North American owners were compelled to undertake second-round retrofits, leading to inflation in procurement budgets. Under MEPC.383(81), electronic record-books transitioned inspection evidence from traditional handwritten logs to secure digital files, favoring platforms equipped with IoT. Port-state control actions increased, with detention rates rising at major hubs like Singapore and Long Beach. This tightening enforcement not only shortens the installation window but also hastens purchase decisions, even for operators typically sensitive to costs.
Expansion of Global Shipping Fleet and Retrofit Wave
In 2024, fleet capacity saw an uptick, with LNG carrier orders constituting a significant portion of the current fleet. Shipyard contracts now include ballast-water-treatment expenditures. While newbuild fitment has surpassed most of the fleet, vessels built between 2009 and 2017 are now undergoing mandatory work during their five-year special surveys, creating a lucrative aftermarket for turnkey providers. In 2024, Asian yards were the primary deliverers of new LNG and VLCC tonnage. Each hull came equipped with pre-installed ultraviolet units, ensuring compliance upon delivery and positioning the builders as suppliers of downstream spares. Retrofit bottlenecks in Singapore, Guangzhou, and Dubai have extended lead times, granting pricing leverage to capacity-rich Indian facilities, which benefit from the Sagarmala incentive regime. Additionally, a backlog in container ships for 2024 secures demand throughout the forecast period.
Rapid Cost-Down in UV-Based Physical Disinfection
AAfter launching in Q3 2025, Alfa Laval’s PureBallast 3 Ultra reduced power consumption for mid-range flow configurations. This innovation cuts annual operating expenses for each vessel. Meanwhile, UV-LED light sources have extended service hours, simultaneously reducing maintenance costs for each replacement cycle. Comparative studies indicate that ultraviolet systems offer an average payback period of four years, while electrolytic platforms, factoring in electrode swaps and neutralization chemicals, extend to nearly six years. These power reductions not only enhance a vessel’s Carbon Intensity Indicator rating—now a key metric for charter-party incentives—but also attract bulk-carrier and tanker owners to these physical units. This is particularly true for routes with high sediment loads, which had previously deterred UV adoption.
Digital-Twin Analytics for Fleet-Wide BWTS Optimisation
Backed by Norway, the Ocean Twin pilot has successfully applied digital twins to vessels. This initiative forecasts lamp degradation and recommends treatment parameters, resulting in a reduction in unplanned downtime and an extension in component life. Wärtsilä’s Aquarius EC, equipped with an integrated sensor suite, relays treatment logs, power draw, and electrode wear statistics to shore-side dashboards[1]Wärtsilä, “Aquarius EC Product Sheet,” wartsila.com. This capability facilitates centralized spares planning across entire fleets. Insurers are now offering premium discounts to ships that provide real-time compliance telemetry. This incentive is accelerating the retrofitting of monitoring hardware across fleets. Furthermore, operators managing large fleets are licensing their generated data back to OEMs for algorithm training. This not only adds a lucrative revenue stream but also bolsters the adoption of analytics in the industry.
Restraints Impact Analysis*
| Restraints | (~) % Impact on CAGR Forecast | Geographic Relevance | Impact Timeline |
|---|---|---|---|
| High Capex and Retrofit Dry-Dock Costs | -3.5% | Global, with acute pressure in South America and Middle East-Africa | Short term (≤ 2 years) |
| Crew-Training Complexity and Operational Downtime Risk | -2.2% | Global, with higher impact in regions with fragmented crew-training infrastructure | Medium term (2-4 years) |
| Component Supply Bottlenecks (UV Lamps, Specialty Filters) | -1.8% | Asia-Pacific and Europe, with semiconductor-dependent ballast controllers most affected | Short term (≤ 2 years) |
| Source: Mordor Intelligence | |||
High Capex and Retrofit Dry-Dock Costs
Retrofitting costs for vessels vary significantly, accounting for a small percentage of the vessel's insured value. These costs often compete with exhaust scrubber upgrades for limited capital. A dry-docking period in Singapore adds additional yard fees, while off-hire periods can result in substantial lost earnings. In South America and Africa, smaller operators face high loan rates, which extend their payback periods beyond thresholds approved by their boards. Consequently, as of early 2026, a significant percentage of vessels over a decade old in these regions remained non-compliant. This created a backlog and muted near-term revenue prospects.
Crew-Training Complexity and Operational Downtime Risk
Surveys by the International Maritime Organization revealed that chief engineers deem manufacturer training inadequate. This perceived training gap is linked to unscheduled downtime per incident, with repair bills contingent on the technology class. Offshore supply vessels and chemical tankers, facing an annual crew turnover exceeding 35%, are particularly vulnerable to knowledge gaps between crew rotations. While new 24-hour certification courses rolled out by Panama and Liberia have bolstered competence levels, completion rates have lingered low as of early 2026[2]Panama Maritime Authority, “BWTS Crew-Training Circular 2025,” amp.gob.pa . In 2024, port-state control officers in Australia detained vessels for operational deficiencies, even though these vessels were equipped with compliant hardware, highlighting the critical role of human factors.
*Our forecasts treat driver/restraint impacts as directional, not additive. The impact forecasts reflect baseline growth, mix effects, and variable interactions.
Segment Analysis
By Fleet Type: LNG Carriers Command Share, Oil Tankers Accelerate
LNG carriers secured 26.12% of 2025 installations within the Ballast Water Treatment market, while oil tankers are on track for the fastest 26.27% CAGR through 2031. The Ballast Water Treatment market size devoted to LNG newbuilds is locked in because vessels are already in yard pipelines, and each contract bundles ultraviolet equipment with hull delivery. Hudong-Zhonghua’s LNG deliveries in 2024, each fitted with UV platforms, reinforce China’s strategic pivot toward gas-carrier dominance.
Retrofits dominate oil-tanker demand, with roughly active hulls averaging 15-20 years of age. Owners synchronize BWTS installations with scrubber retrofits during mandated special surveys to minimize downtime. Ballast Water Treatment market opportunities widen because tanker preparation often requires piping changes and filter system enlargements to handle high-sediment Arabian Gulf water, adding engineering margin. Bulk carriers and container ships together represent a notable portion of 2025 installations, yet their sheer ballast volumes magnify operational savings from low-energy ultraviolet units. Maersk and CMA CGM have standardized Alfa Laval PureBallast 3 Ultra across their newbuilds, illustrating how charterer energy-efficiency clauses steer technology decisions.


By Method Type: Physical Systems Dominate Through Energy Efficiency
Physical disinfection claimed 62.22% share of the 2025 Ballast Water Treatment market and is expected to grow at 26.58% CAGR to 2031. The market's allocation for ultraviolet systems surged after the PureBallast 3 Ultra achieved dual compliance with IMO and USCG standards, all while reducing power demand. Furthermore, UV-LED retrofits introduced by Atlantium and BIO-UV extended lamp life, resulting in annual savings on spare parts for each vessel.
Chemical methods, notably electrolytic chlorination and chlorine dioxide dosing, command a significant market share. These methods are favored in highly turbid or saline port settings, like the densely trafficked Arabian Gulf, where UV light penetration is compromised. Here, Wärtsilä’s Aquarius EC has successfully clinched contracts with Very Large Crude Carriers (VLCCs). However, the competitiveness of these chemical approaches is waning. This is largely due to the high cost of electrode modules, which need replacement periodically, and the necessity of neutralization chemicals. This challenge is further amplified in crews lacking hazardous-materials certification. Meanwhile, hybrid prototypes that combine UV with advanced oxidation are on the rise, yet they remain in limbo, awaiting USCG endorsement to rival the established physical systems.
Geography Analysis
Asia-Pacific commanded 83.66% of the Ballast Water Treatment market value in 2025, a position anchored in regional shipyard hegemony. In 2024, Chinese shipbuilders launched LNG carriers and bulkers, equipping most of them with Ballast Water Treatment Systems (BWTS). Meanwhile, Korean shipyards held a significant portion of the LNG orderbook, opting for standardized ultraviolet units that comply with D-2 limits, free from active substances. Japanese shipyards, on the other hand, chose JFE Engineering’s BallastAce for their energy-efficient bulkers. However, retrofitting older Asian-flag vessels led to a year-long wait. Capitalizing on Sagarmala incentives and competitive labor rates, India secured retrofit contracts in 2024, positioning itself as a go-to hub for urgent projects.
North America recorded the swiftest 28.10% CAGR. This surge was largely due to the US Coast Guard (USCG) disqualifying systems that only met International Maritime Organization (IMO) standards by 2025, necessitating replacements on current vessels. The Great Lakes, with their unique freshwater conditions, require UV calibrations for salinity levels around 1 ppt. Additionally, winter icing shortens the retrofit window to just the summer months. On the Gulf Coast, chemical tankers showed a preference for Xylem’s Hyde Marine modules, which are designed for compatibility with coated tanks and segregated piping. Meanwhile, Arctic expansions mandated systems that can function at temperatures as low as −2 °C.
Europe took proactive steps towards compliance, with most EU-flagged ships adopting BWTS by the close of 2024. As first-generation electrolytic units near the end of their lifespan, a new wave of replacement demand is emerging. Norway’s Ocean Twin project highlights the potential of digital twin economics, while German cruise shipyards integrated BIO-UV on platforms, aiming to reduce carbon costs under the EU Emissions Trading System (ETS). The UK's expanding offshore-wind service fleet, which frequently adjusts ballast, is pushing suppliers to develop ultraviolet reactors that operate faster. While regions outside the primary markets lag in adoption, they're witnessing localized spikes, particularly in Brazil's pre-salt ventures and the UAE's LNG bunkering projects, both of which necessitate compliant vessels for export licensing.

Competitive Landscape
The market remains moderately consolidated. Peripheral innovators chase underserved niches. Ecochlor specializes in chlorine-dioxide units for high-turbidity ports, and Headway Technology’s low-cost UV line targets Chinese coasters. Component manufacturers are integrating vertically into full controller assemblies to capture more margin. Patent filings in 2024-2025 highlight hybrid UV-oxidation modules and deck-mounted retrofit packages installable alongside cargo operations, innovations that could redraw share positions once certified. Shipyard backward integration intensifies rivalry. Regional players across Asia-Pacific are also capitalizing on after-sales training contracts and spare-parts logistics that global vendors struggle to service due to time-zone gaps.
Ballast Water Treatment Industry Leaders
Alfa Laval
Wärtsilä
PANASIA CO., LTD
ERMA FIRST ESK Engineering SA
Sunrui Marine Environment Engineering Co., Ltd.
- *Disclaimer: Major Players sorted in no particular order

Recent Industry Developments
- August 2025: Kuraray Microfade II received USCG type-approval, widening options for operators needing filtration and active-substance solutions.
- September 2024: Alfa Laval won a large contract to replace aging ballast systems, confirming sustained retrofit demand into the next planning cycle.


Global Ballast Water Treatment Market Report Scope
A Ballast Water Treatment System (BWTS) removes or inactivates biological organisms from ballast water (algae, zooplankton, and bacteria). Ballast water treatment is a developing technology with a growing number of vendors. It means that the systems being offered have a bad service experience, and it is widely accepted that only some solutions are suited for all ship types.
The ballast water treatment market is segmented by fleet type, method type, and geography. By fleet type, the market is segmented into oil tankers, bulk carriers, LNG carriers, container ships, and other fleet types. By method type, the market is segmented into physical and chemical methods. The report also covers the market sizes and forecasts in 9 countries. For each segment, the market sizing and forecasts were made based on revenue (USD).
| Oil Tankers |
| Bulk Carriers |
| LNG Carriers |
| Container Ships |
| Other Fleet Types (Chemical Tankers, Ferries Ships, General Cargo, Offshore Supply Vessels, etc.) |
| Physical |
| Chemical |
| Asia-Pacific | China |
| India | |
| Japan | |
| South Korea | |
| Rest of Asia-Pacific | |
| North America | United States |
| Rest of North America | |
| Europe | Germany |
| United Kingdom | |
| France | |
| Italy | |
| Rest of Europe | |
| Rest of the World | South America |
| Middle-East and Africa |
| By Fleet Type | Oil Tankers | |
| Bulk Carriers | ||
| LNG Carriers | ||
| Container Ships | ||
| Other Fleet Types (Chemical Tankers, Ferries Ships, General Cargo, Offshore Supply Vessels, etc.) | ||
| By Method Type | Physical | |
| Chemical | ||
| By Geography | Asia-Pacific | China |
| India | ||
| Japan | ||
| South Korea | ||
| Rest of Asia-Pacific | ||
| North America | United States | |
| Rest of North America | ||
| Europe | Germany | |
| United Kingdom | ||
| France | ||
| Italy | ||
| Rest of Europe | ||
| Rest of the World | South America | |
| Middle-East and Africa | ||


Key Questions Answered in the Report
How large is the Ballast Water Treatment market in 2026?
The Ballast Water Treatment market size stands at USD 131.19 billion in 2026 and is on course to reach USD 419.46 billion by 2031, registering a CAGR of 26.17%.
Which fleet class is installing ballast systems fastest?
Oil tankers show the highest growth, advancing at 26.27% CAGR as older VLCC and Suezmax units undergo mandatory retrofits.
What technology leads current retrofit demand?
Physical ultraviolet disinfection dominates with 62.22% of 2025 installations and a 26.58% CAGR outlook, thanks to lower energy use and simpler crew operation.
Why is North America growing quicker than Asia-Pacific?
USCG’s stricter type-approval regime invalidated several earlier systems, pushing owners into second-round retrofits and driving a 28.10% regional CAGR.
Which factors most constrain installation schedules?
High retrofit capex, dry-dock downtime, and component supply bottlenecks for UV lamps and control electronics pose the largest near-term hurdles.
Page last updated on:


