Market Overview
| Study Period | 2017 - 2030 |
|---|---|
| Base Year For Estimation | 2024 |
| Forecast Data Period | 2025 - 2030 |
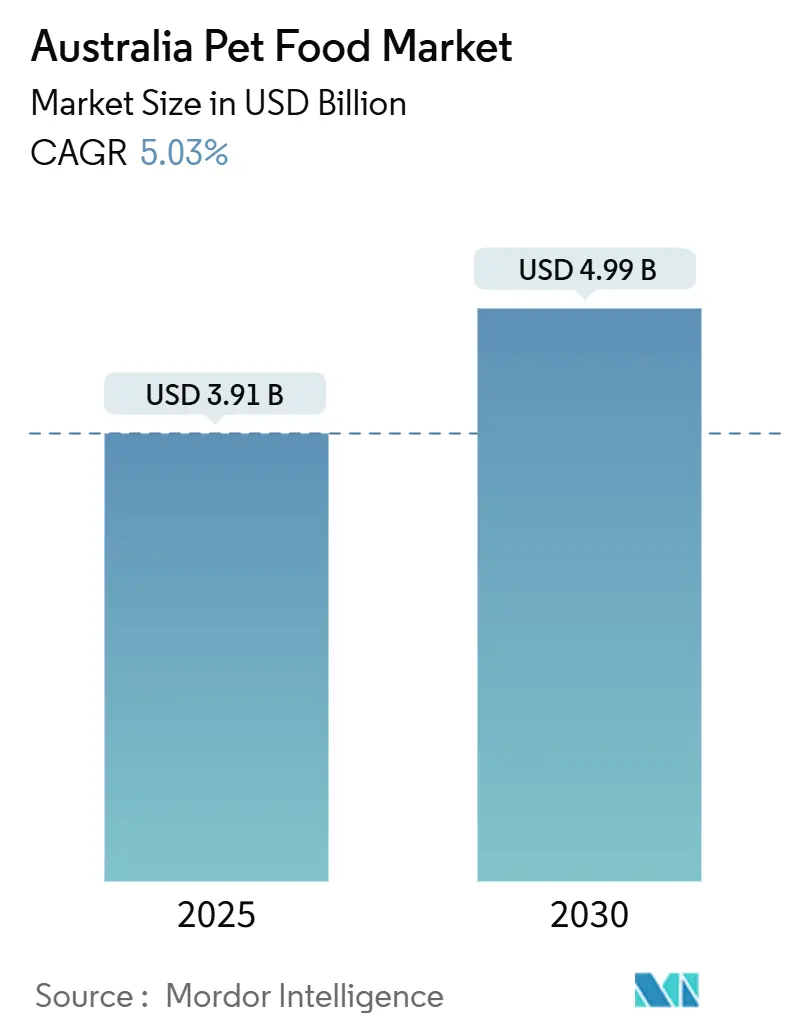
| Market Size (2025) | USD 3.91 Billion |
| Market Size (2030) | USD 4.99 Billion |
| Growth Rate (2025 - 2030) | 5.03% CAGR |
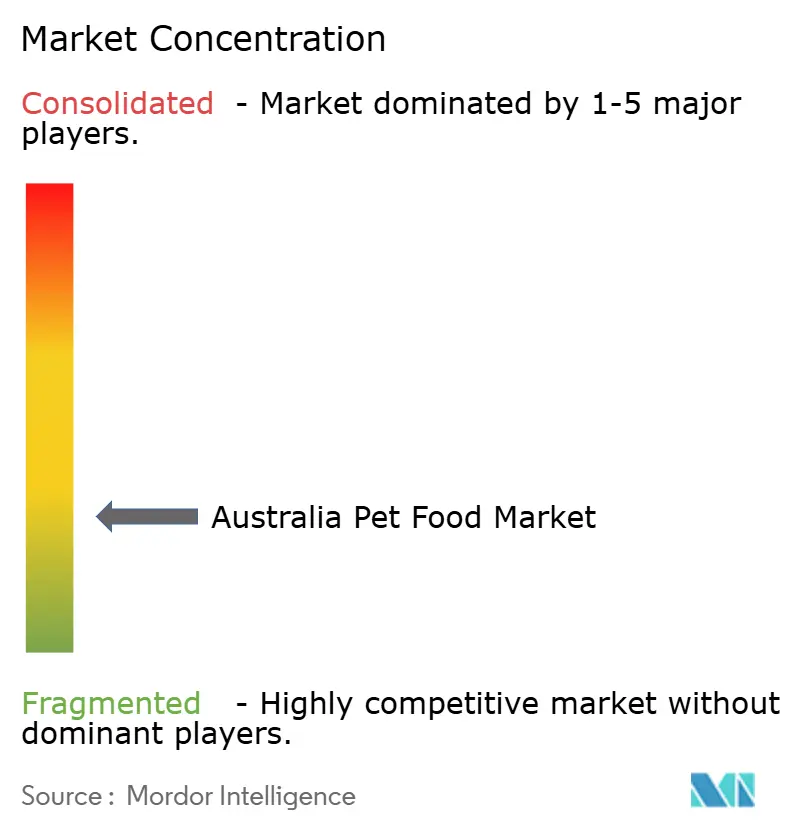
| Market Concentration | Low |
Major Players
*Disclaimer: Major Players sorted in no particular order Image © Mordor Intelligence. Reuse requires attribution under CC BY 4.0. |
|
Australia Pet Food Market Analysis by Mordor Intelligence
The Australia pet food market size stood at USD 3.91 billion in 2025 and is projected to reach USD 4.99 billion by 2030, advancing at a 5.03% CAGR. Premiumization, strong pet humanization, and sustained household spending on companion animals anchor market resilience. Manufacturers are scaling domestic capacity and renewable energy integration to protect margins, while alternative proteins and functional ingredients keep innovative pipelines active. Direct-to-consumer disruptors are reshaping route-to-market economics, prompting incumbents to accelerate omnichannel investments and localized production. Macroeconomic headwinds such as meat cost inflation and supply chain volatility are being mitigated through formulation agility and supplier diversification, preserving value growth in the Australia pet food market.
Key Report Takeaways
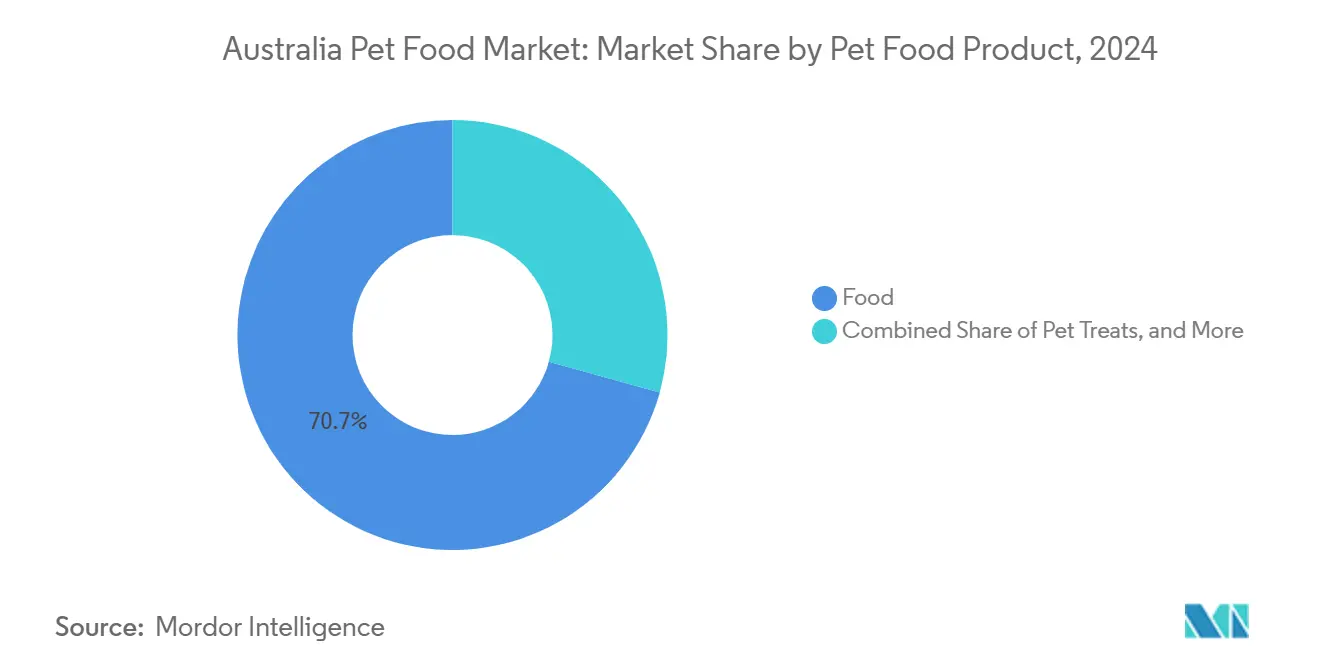
- By pet food product, food products led with 70.7% of Australia pet food market size in 2024, while pet treats are forecast to expand at a 6.2% CAGR through 2030.
- By pet, dogs accounted for 44.0% of the Australia pet food market size in 2024, while the cat segment is projected to grow at a 4.9% CAGR through 2030.
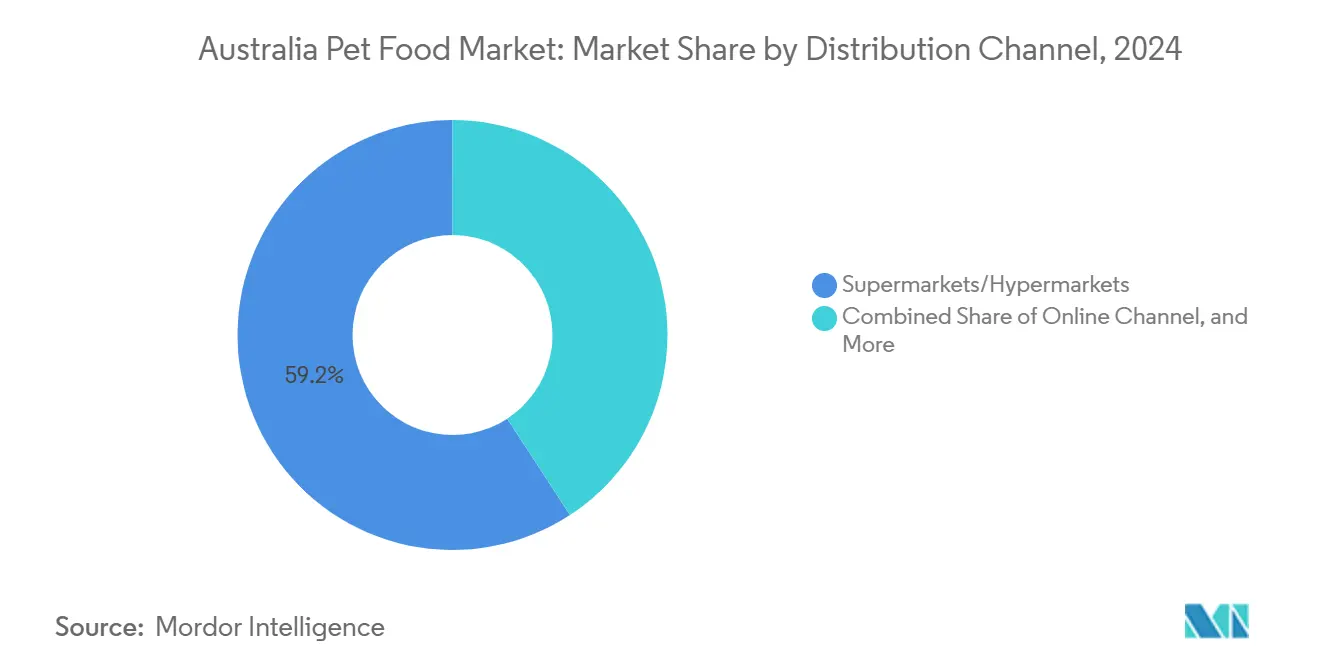
- By distribution channel, supermarkets and hypermarkets captured 59.2% of Australia pet food market size in 2024, the online channel is projected to post a 6.5% CAGR through 2030.
Australia Pet Food Market Trends and Insights
Drivers Impact Analysis
| Driver | (~) % Impact on CAGR Forecast | Geographic Relevance | Impact Timeline |
|---|---|---|---|
| Premiumization of Pet Diets | +1.8% | Australia-wide, strongest in urban centers | Medium term (2-4 years) |
| Humanization of Pets and Treat-like Feeding Behavior | +1.2% | Australia-wide, accelerated in metro areas | Short term (≤ 2 years) |
| Rise of Prescription Diet Demand via Veterinarians | +0.9% | Australia-wide, concentrated in suburban areas | Medium term (2-4 years) |
| Mainstream Adoption of Functional Ingredients | +0.7% | Australia-wide, early adoption in affluent suburbs | Long term (≥ 4 years) |
| Decentralized Fresh-Food Kitchens in Major Cities | +0.5% | Sydney, Melbourne, Brisbane, Perth metro areas | Short term (≤ 2 years) |
| Alternative Protein Inclusion | +0.4% | Australia-wide, regulatory-dependent rollout | Long term (≥ 4 years) |
| Source: Mordor Intelligence | |||
Understand The Key Trends Shaping This Market
Download PDF
Premiumization of Pet Diets
Premium positioning has become the primary value creation lever as Australian pet owners increasingly prioritize ingredient quality over price sensitivity. Mars Petcare's investment in renewable energy at its Wodonga facility demonstrates how manufacturers are embedding sustainability credentials into premium product lines to justify higher price points [1]Source: Mars Petcare, “Mars Petcare Australia,” MARS.COM. The premiumization trend is particularly pronounced in freeze-dried and raw food categories, where companies like Freeze Dry Australia are leveraging unique protein sources, including emu, crocodile, and kangaroo, to differentiate from conventional offerings. This shift toward premium positioning is creating margin expansion opportunities for manufacturers while simultaneously raising barriers to entry for new competitors lacking sophisticated supply chain capabilities. The trend aligns with broader consumer behavior patterns where pet spending remains resilient even during economic downturns, as pet owners view nutrition as a non-discretionary expense category.
Humanization of Pets and Treat-like Feeding Behavior
The anthropomorphization of pets is driving fundamental changes in feeding patterns, with treat consumption becoming more frequent and meal-like rather than reward-based. Coles' launch of Swaggle as a dedicated pet marketplace reflects retailers' recognition that pet products require specialized curation and customer service approaches distinct from traditional grocery categories. This behavioral shift is creating new product development opportunities in the treat segment, particularly for products that bridge the gap between meals and snacks. The humanization trend is also manifesting in packaging design and marketing messaging that emphasizes family-oriented benefits rather than purely functional nutrition claims. Regulatory compliance frameworks under AS5812 standards are adapting to accommodate these human-grade ingredient claims while maintaining pet-specific nutritional requirements.
Rise of Prescription Diet Demand via Veterinarians
Veterinary channel expansion is accelerating as pet ownership surged during the pandemic, creating a larger installed base of animals requiring ongoing therapeutic nutrition management. Hill's Prescription Diet products are commanding premium pricing with specialized formulations like c/d Multicare for urinary tract health priced at AUD 120.00 (USD 80.40) for 24 cans, demonstrating the channel's ability to support higher margins through clinical validation. The prescription diet segment benefits from veterinarian recommendation authority, which reduces price sensitivity and creates switching barriers for competing brands. Subscription models are gaining traction in this channel, with veterinary clinics offering automated delivery services that improve customer retention while providing predictable revenue streams. The therapeutic focus is expanding beyond traditional conditions to include preventive nutrition for aging pets and breed-specific formulations that address genetic predispositions to certain health issues.
Mainstream Adoption of Functional Ingredients
Functional ingredient integration is transitioning from niche premium products to mainstream formulations as manufacturing costs decline and consumer awareness increases. Probiotics, omega-3 fatty acids, and collagen are becoming standard inclusions rather than premium differentiators, forcing manufacturers to identify next-generation functional ingredients to maintain competitive advantages. The regulatory environment under APVMA (Australian Pesticides and Veterinary Medicines Authority) oversight is creating approval pathways for novel functional ingredients while ensuring safety standards are maintained. Companies like CEN Nutrition are developing specialized supplements that combine multiple functional ingredients, such as their joint health formula featuring hydrolyzed collagen peptides and organic turmeric priced at AUD 59.95 (USD 40.17). This mainstream adoption is creating economies of scale that benefit both manufacturers and consumers while establishing functional nutrition as a baseline expectation rather than a premium feature.
Restraints Impact Analysis
| Restraint | (~) % Impact on CAGR Forecast | Geographic Relevance | Impact Timeline |
|---|---|---|---|
| Supply-side Pressure from Meat Inflation | -1.1% | Australia-wide, acute in regional processing areas | Short term (≤ 2 years) |
| Regulatory Delay on Novel Ingredient Approval | -0.8% | Australia-wide, affecting innovation-focused companies | Medium term (2-4 years) |
| Sustainability-Heritage Mismatch in Rural Areas | -0.4% | Rural and regional Australia | Long term (≥ 4 years) |
| Intensifying Competition from Direct-to-Consumer Start-ups | -0.6% | Metro areas, expanding to regional centers | Short term (≤ 2 years) |
| Source: Mordor Intelligence | |||
Supply-side Pressure from Meat Inflation
Meat price volatility is compressing manufacturer margins and forcing difficult decisions between maintaining profitability and preserving market share through pricing discipline. The cost pressures are particularly acute for premium brands that emphasize high meat content, as ingredient costs can represent 60-70% of total production expenses. Manufacturers are responding through reformulation strategies that maintain protein levels while incorporating alternative protein sources and functional ingredients that justify premium positioning despite higher input costs. The inflationary environment is creating opportunities for private label expansion as retailers leverage their purchasing power to offer competitive alternatives to national brands. Supply chain diversification is becoming critical as manufacturers seek to reduce dependence on single-source protein suppliers and develop relationships with alternative protein producers to hedge against future price volatility.
Regulatory Delay on Novel Ingredient Approval
The regulatory approval process for novel ingredients is creating competitive disadvantages for Australian manufacturers relative to international markets, where approval pathways are more established. FSANZ's (Food Standards Australia New Zealand) cautious approach to novel food approvals, while ensuring safety, is delaying market introduction of innovative ingredients that could differentiate Australian products in export markets. The regulatory uncertainty is particularly challenging for startups and smaller manufacturers who lack the resources to navigate complex approval processes or absorb the costs of regulatory delays. Companies are adapting by focusing product development on ingredients with established regulatory pathways while building regulatory affairs capabilities to accelerate future approvals. The delay in novel ingredient approvals is also creating first-mover disadvantages for Australian companies in emerging categories like cell-cultured proteins, where international competitors may establish market positions before Australian regulatory approval is achieved.
Segment Analysis
By Pet Food Product: Food Dominance Faces Treat Disruption
Food products account for a dominant 70.7% market size in 2024, reflecting their essential nature and high purchase frequency among Australian pet owners. Dry pet food remains a significant market presence due to its convenience and shelf stability. Wet pet food is gaining market share, driven by its premium positioning and palatability, which align with the growing trend of pet humanization. The substantial market share of pet food in Australia is primarily attributed to the increasing shift among pet owners from home-cooked meals to commercial pet food products. This segment's growth is further supported by rising awareness among dog owners about pet nutrition, greater adoption of commercial products, and the increasing emphasis on pet humanization. Additionally, the availability of diverse brands and product types, including dry and wet pet food enriched with functional ingredients, has further strengthened the segment's market position.
Pet treats are emerging as the fastest-growing segment, with a 6.2% CAGR through 2030, driven by increased feeding frequency and humanization trends that position treats as meal supplements rather than occasional rewards. The pet treats segment is particularly benefiting from the growing trend of premium and functional treats, while the veterinary diets segment is expanding due to the increasing focus on specialized nutrition for pets with health issues. The regulatory framework under AS5812 standards ensures product safety while allowing innovation in functional ingredient incorporation, creating opportunities for differentiation through science-backed nutritional claims [2]Source: Senate Committee Report, “Regulatory approaches to ensure the safety of pet food,” APH.GOV.AU .
Note: Segment shares of all individual segments available upon report purchase
Get Detailed Market Forecasts at the Most Granular Levels
Download PDF
By Pet Type: Dogs Lead While Cats Accelerate
Dogs maintain the largest segment at 44.0% of Australia pet food market size in 2024, reflecting their higher food consumption per animal and the established culture of dog ownership in Australian households. This significant market share is attributed to the country's large dog population, with dogs being the most popular companion animals among Australian households. The segment's dominance is further reinforced by higher expenditure patterns among dog owners, particularly on premium and specialized food products. Australian dog owners are increasingly focusing on high-quality nutrition, with a growing preference for products containing natural ingredients and specialized formulations.
Cats are experiencing faster growth at 4.9% CAGR through 2030, driven by urbanization trends and apartment living preferences that favor lower-maintenance pets. The cat segment's growth is particularly pronounced in metropolitan areas, where housing constraints and lifestyle factors favor feline companions over larger pets that require more space and exercise. The cat segment is characterized by specialized nutritional requirements and a growing trend toward premium and therapeutic diets, particularly among urban pet owners. The other pets segment, which includes birds, fish, and small mammals, represents a diverse market with specialized dietary needs and varying product formulations.
By Distribution Channel: Online Disrupts Traditional Retail
Supermarkets/Hypermarkets retain their dominant distribution position, with a 59.2% Australia pet food market size in 2024, leveraging their convenience and one-stop shopping advantages for routine pet food purchases. This channel's dominance is primarily attributed to its one-stop shopping convenience, allowing pet owners to purchase pet food alongside their regular household items. Major chains like Woolworths, Coles, and Aldi maintain dedicated pet sections offering comprehensive product ranges across various categories, including food, treats, and veterinary diets. The channel's strength is further reinforced by its extensive network of 1,108 supermarkets across 956 cities in Australia, ensuring widespread accessibility.
Online channels are experiencing the fastest growth at 6.5% CAGR through 2030, accelerated by subscription models and direct-to-consumer brands that offer personalized nutrition and delivery convenience. The online channel reached USD 211.6 million in 2024, representing significant growth from the 1% penetration rate observed in earlier years [3]Source: Port Macquarie Veterinary Hospital, “Port Vet Online Shop,” PORTVET.COM.AU . This channel's accelerated growth is driven by increasing digital adoption among pet owners, offering unprecedented convenience through home delivery services and subscription-based models. The segment's expansion is further supported by the comprehensive product information available online, enabling pet owners to make informed decisions through detailed ingredient lists, nutritional information, and customer reviews.
Note: Segment shares of all individual segments available upon report purchase
Get Detailed Market Forecasts at the Most Granular Levels
Download PDF
Geography Analysis
Australia represents a concentrated market with distinct regional variations in pet ownership patterns and purchasing behaviors. Metropolitan areas including Sydney, Melbourne, Brisbane, and Perth drive the majority of market value through higher pet ownership rates and greater willingness to purchase premium products. Urban consumers demonstrate stronger adoption of direct-to-consumer models and fresh food delivery services, with companies like Lyka achieving significant penetration in major cities through same-day delivery capabilities and personalized nutrition offerings. The geographic concentration creates advantages for fresh food models that require delivery density to achieve economic viability while presenting challenges for national brands seeking consistent distribution coverage.
Regional and rural areas maintain different consumption patterns, with greater emphasis on traditional dry food products and resistance to premium positioning based solely on sustainability or novel ingredient claims. The rural market represents opportunities for brands that emphasize performance benefits and value positioning rather than environmental messaging, as demonstrated by the geographic relevance scores for various market drivers. Pet ownership rates remain high across all regions, but spending per pet varies significantly between urban and rural areas, creating market segmentation opportunities for companies with diverse product portfolios.
The regulatory environment under APVMA (Australian Pesticides and Veterinary Medicines Authority) and FSANZ (Food Standards Australia New Zealand) oversight applies consistently across all geographic regions, though enforcement and compliance monitoring may vary in remote areas. Export opportunities are emerging as Australian manufacturers leverage their disease-free status and quality reputation to access international markets, with companies like Real Pet Food Company and Freeze Dry Australia developing export capabilities to diversify revenue sources beyond the domestic market.
Competitive Landscape
The Australian pet food market exhibits a fragmented competitive landscape with a balanced mix of global conglomerates and local specialists. Global players like Mars, Incorporated, Nestle (Purina), Colgate-Palmolive Company (Hill's Pet Nutrition, Inc.), Clearlake Capital Group, L.P. (Wellness Pet Company, Inc.), and Schell & Kampeter, Inc. (Diamond Pet Foods) are leveraging their international expertise and extensive research capabilities to maintain market positions. The competitive intensity is increasing as direct-to-consumer startups challenge traditional distribution models, forcing incumbents to develop omnichannel capabilities and invest in digital customer acquisition strategies.
The Australian pet food market is characterized by companies actively pursuing product innovation and strategic expansion initiatives. Major players are focusing on developing premium and specialized pet food products, including natural ingredients, grain-free options, and functional foods targeting specific health conditions. Operational agility is demonstrated through investments in local manufacturing facilities and distribution networks, with several companies establishing or expanding production sites across Australia.
Strategic moves predominantly involve partnerships with research institutes, veterinary clinics, and local distributors to strengthen market presence and enhance product development capabilities. Companies are also expanding their reach through multi-channel distribution strategies, combining traditional retail presence with growing e-commerce capabilities to meet evolving consumer preferences. This dynamic environment is led by leaders in pet food who are setting benchmarks in innovation and distribution.
Australia Pet Food Industry Leaders
-
Mars, Incorporated
-
Nestle (Purina)
-
Colgate-Palmolive Company (Hill's Pet Nutrition, Inc.)
-
Clearlake Capital Group, L.P. (Wellness Pet Company, Inc.)
-
Schell & Kampeter, Inc. (Diamond Pet Foods)
- *Disclaimer: Major Players sorted in no particular order
Need More Details on Market Players and Competitors?
Download PDF
Recent Industry Developments
- July 2023: Hill's Pet Nutrition introduced its new MSC (Marine Stewardship Council) certified pollock and insect protein products for pets with sensitive stomachs and skin lines. They contain vitamins, omega-3 fatty acids, and antioxidants.
- May 2023: Nestle Purina launched new cat treats under the Friskies "Friskies Playfuls - treats" brand. These treats are round in shape and are available in chicken and liver and salmon and shrimp flavors for adult cats.
- April 2023: Mars Incorporated opened its first pet food research and development center in Asia-Pacific. This new facility, called the APAC pet center, will support the company's product development.
Australia Pet Food Market Report Scope
Food, Pet Nutraceuticals/Supplements, Pet Treats, Pet Veterinary Diets are covered as segments by Pet Food Product. Cats, Dogs are covered as segments by Pets. Convenience Stores, Online Channel, Specialty Stores, Supermarkets/Hypermarkets are covered as segments by Distribution Channel.
Pet Food Product
| Food | By Sub Product | Dry Pet Food | By Sub Dry Pet Food | Kibbles |
| Other Dry Pet Food | ||||
| Wet Pet Food | ||||
| Pet Nutraceuticals/Supplements | By Sub Product | Milk Bioactives | ||
| Omega-3 Fatty Acids | ||||
| Probiotics | ||||
| Proteins and Peptides | ||||
| Vitamins and Minerals | ||||
| Other Nutraceuticals | ||||
| Pet Treats | By Sub Product | Crunchy Treats | ||
| Dental Treats | ||||
| Freeze-dried and Jerky Treats | ||||
| Soft and Chewy Treats | ||||
| Other Treats | ||||
| Pet Veterinary Diets | By Sub Product | Diabetes | ||
| Digestive Sensitivity | ||||
| Oral Care Diets | ||||
| Renal | ||||
| Urinary tract disease | ||||
| Other Veterinary Diets |
Pets
| Cats |
| Dogs |
| Other Pets |
Distribution Channel
| Convenience Stores |
| Online Channel |
| Specialty Stores |
| Supermarkets/Hypermarkets |
| Other Channels |
| Pet Food Product | Food | By Sub Product | Dry Pet Food | By Sub Dry Pet Food | Kibbles |
| Other Dry Pet Food | |||||
| Wet Pet Food | |||||
| Pet Nutraceuticals/Supplements | By Sub Product | Milk Bioactives | |||
| Omega-3 Fatty Acids | |||||
| Probiotics | |||||
| Proteins and Peptides | |||||
| Vitamins and Minerals | |||||
| Other Nutraceuticals | |||||
| Pet Treats | By Sub Product | Crunchy Treats | |||
| Dental Treats | |||||
| Freeze-dried and Jerky Treats | |||||
| Soft and Chewy Treats | |||||
| Other Treats | |||||
| Pet Veterinary Diets | By Sub Product | Diabetes | |||
| Digestive Sensitivity | |||||
| Oral Care Diets | |||||
| Renal | |||||
| Urinary tract disease | |||||
| Other Veterinary Diets | |||||
| Pets | Cats | ||||
| Dogs | |||||
| Other Pets | |||||
| Distribution Channel | Convenience Stores | ||||
| Online Channel | |||||
| Specialty Stores | |||||
| Supermarkets/Hypermarkets | |||||
| Other Channels | |||||
Need A Different Region or Segment?
Customize Now
Market Definition
- FUNCTIONS - Pet foods are usually intended to provide complete and balanced nutrition to the pet but are primarily used as functional products. The scope includes the food and supplements consumed by pets including veterinary diets. Supplements/nutraceuticals that are directly supplied to pets are considered within the scope.
- RESELLERS - Companies engaged in reselling of pet food without value addition have been excluded from the market scope, in order to avoid double counting.
- END CONSUMERS - Pet owners are considered to be the end-consumers in the market studied.
- DISTRIBUTION CHANNELS - Supermarkets/hypermarkets, specialty stores, convenience stores, online channels and other channels are considered within the scope. The stores which are exclusively providing pet related basic and custom products are considered within the scope of specialty stores.
| Keyword | Definition |
|---|---|
| Pet Food | The scope of pet food includes the food that is eatable by pets including food, treats, veterinary diets, and nutraceuticals/supplements. |
| Food | Food is animal feed intended for consumption by pets. It is formulated to provide essential nutrients and meet the dietary needs of various types of pets, including dogs, cats, and other animals. These are generally segmented into dry and wet pet foods. |
| Dry Pet Food | Dry pet foods may be extruded/baked (kibbles) or flaked. They have a lower moisture content, typically around 12-20%. |
| Wet Pet Food | Wet pet food, also known as canned pet food or moist pet food, generally has a higher moisture content compared to dry pet food, often ranging from 70-80%. |
| Kibbles | Kibbles are dry, processed pet food in small, bite-sized pieces or pellets. They are specifically formulated to provide balanced nutrition for various domestic animals, such as dogs, cats, and other animals. |
| Treats | Pet Treats are special food items or rewards given to pets, to show affection, and encourage good behavior. They are especially used during training. Pet treats are made from various combinations of meat or meat-derived materials with other ingredients. |
| Dental Treats | Pet dental treats are specialized treats that are formulated to promote good oral hygiene in pets. |
| Crunchy Treats | It is a type of pet treat that has a firm and crispy texture which can be a good source of nutrition for pets. |
| Soft and chewy treats | Soft and Chewy pet treats are a type of pet food product that is formulated to be easy to chewy and digest. They are usually made from soft and pliable ingredients, such as meat, poultry, or vegetables, that have been blended and formed into bite-sized pieces or strips. |
| Freeze-dried & Jerky Treats | Freeze-dried and jerky treats are snacks given to pets, that are prepared through a special preservation process, without damaging the nutritional content, resulting in long-lasting, nutrient-rich treats. |
| Urinary Tract Disease Diets | These are commercial diets that are specifically formulated to promote urinary health and reduce the risk of urinary tract infections and other urinary problems. |
| Renal Diets | These are specialized pet foods formulated to support the health of pets with kidney disease or renal insufficiency. |
| Digestive Sensitivity Diets | Digestive-sensitive diets are specially formulated to meet the nutritional needs of pets with digestive issues such as food intolerances, allergies, and sensitivities. These diets are designed to be easily digestible and to reduce the symptoms of digestive problems in pets. |
| Oral Care Diets | Oral care diets for pets are specially formulated diets produced to promote oral health and hygiene in pets. |
| Grain-Free Pet Food | Pet food that does not contain common grains like wheat, corn, or soy. Grain-free diets are often preferred by pet owners seeking alternative options or if their pets have specific dietary sensitivities. |
| Premium Pet Food | High-quality pet food formulated with superior ingredients often offers additional nutritional benefits compared to standard pet food. |
| Natural Pet Food | Pet food made from natural ingredients, with minimal processing and without artificial preservatives. |
| Organic Pet Food | Pet food is produced using organic ingredients, free from synthetic pesticides, hormones, and genetically modified organisms (GMOs). |
| Extrusion | A manufacturing process used to produce dry pet food, where ingredients are cooked, mixed, and shaped under high pressure and temperature. |
| Other Pets | Other pets include birds, fish, rabbits, hamsters, ferrets, and reptiles. |
| Palatability | The taste, texture, and aroma of pet food influence its appeal and acceptance by pets. |
| Complete and Balanced Pet Food | Pet food that provides all essential nutrients in appropriate proportions to meet the nutritional needs of pets without additional supplementation. |
| Preservatives | These are the substances that are added to pet food to extend its shelf life and prevent spoilage. |
| Nutraceuticals | Food products that offer health benefits beyond basic nutrition, often contain bioactive compounds with potential therapeutic effects. |
| Probiotics | Live beneficial bacteria that promote a healthy balance of gut flora, supporting digestive health and immune function in pets. |
| Antioxidants | Compounds that help neutralize harmful free radicals in the body, promoting cellular health and supporting the immune system in pets. |
| Shelf-Life | The duration of which pet food remains safe and nutritionally viable for consumption after its production date. |
| Prescription diet | Specialized pet food formulated to address specific medical conditions under veterinary supervision. |
| Allergen | A substance that can cause allergic reactions in some pets, leading to food allergies or sensitivities. |
| Canned food | Wet pet food that is packed in cans and contains higher moisture content than dry food. |
| Limited ingredient diet (LID) | Pet food formulated with a reduced number of ingredients to minimize potential allergens. |
| Guaranteed Analysis | The minimum or maximum levels of certain nutrients present in pet food. |
| Weight management | Pet food designed to help pets maintain a healthy weight or support weight loss efforts. |
| Other Nutraceuticals | It includes prebiotics, antioxidants, digestive fiber, enzymes, essential oils and herbs. |
| Other Veterinary Diets | It includes weight management diets, skin and coat health, cardiac care, and joint care. |
| Other Treats | It includes rawhides, mineral blocks, lickables, and catnips. |
| Other Dry Foods | It includes cereal flakes, mixers, meal toppers, freeze-dried foods, and air-dried foods. |
| Other Animals | It includes birds, fish, reptiles, and small animals (rabbits, ferrets, hamsters). |
| Other Distribution Channels | It includes veterinary clinics, local unregulated stores, and feed and farm stores. |
| Proteins and Peptides | Proteins are large molecules composed of basic units called amino acids which help in the growth and development of pets. Peptides are the short string of 2 to 50 amino acids. |
| Omega-3 fatty acids | Omega-3 fatty acids are essential polyunsaturated fats that play a crucial role in the overall health and well-being of Pets |
| Vitamins | Vitamins are the essential organic compounds that are essential for vital physiological functioning. |
| Minerals | Minerals are naturally occurring inorganic substances that are essential for various physiological functions in pets. |
| CKD | Chronic Kidney Disease |
| DHA | Docosahexaenoic Acid |
| EPA | Eicosapentaenoic Acid |
| ALA | Alpha-linolenic Acid |
| BHA | Butylated Hydroxyanisol |
| BHT | Butylated Hydroxytoluene |
| FLUTD | Feline Lower Urinary Tract Disease |
Need More Details on Market Definition?
Ask a Question
Research Methodology
Mordor Intelligence follows a four-step methodology in all our reports.
- Step-1: IDENTIFY KEY VARIABLES: In order to build a robust forecasting methodology, the variables and factors identified in Step-1 are tested against available historical market numbers. Through an iterative process, the variables required for market forecast are set and the model is built on the basis of these variables.
- Step-2: Build a Market Model: Market-size estimations for the forecast years are in nominal terms. Inflation is not a part of the pricing, and the average selling price (ASP) is kept constant throughout the forecast period.
- Step-3: Validate and Finalize: In this important step, all market numbers, variables and analyst calls are validated through an extensive network of primary research experts from the market studied. The respondents are selected across levels and functions to generate a holistic picture of the market studied.
- Step-4: Research Outputs: Syndicated Reports, Custom Consulting Assignments, Databases & Subscription Platforms

Get More Details On Research Methodology
Download PDF


