
Butter Market Size and Share
Market Overview
| Study Period | 2021 - 2031 |
|---|---|
| Market Size (2026) | USD 49.17 Billion |
| Market Size (2031) | USD 61.99 Billion |
| Growth Rate (2026 - 2031) | 4.74 % |
| Fastest Growing Market | Asia Pacific |
| Largest Market | Europe |
| Market Concentration | Medium |
Major Players
*Disclaimer: Major Players sorted in no particular order Image © Mordor Intelligence. Reuse requires attribution under CC BY 4.0. |
|
Butter Market Analysis by Mordor Intelligence
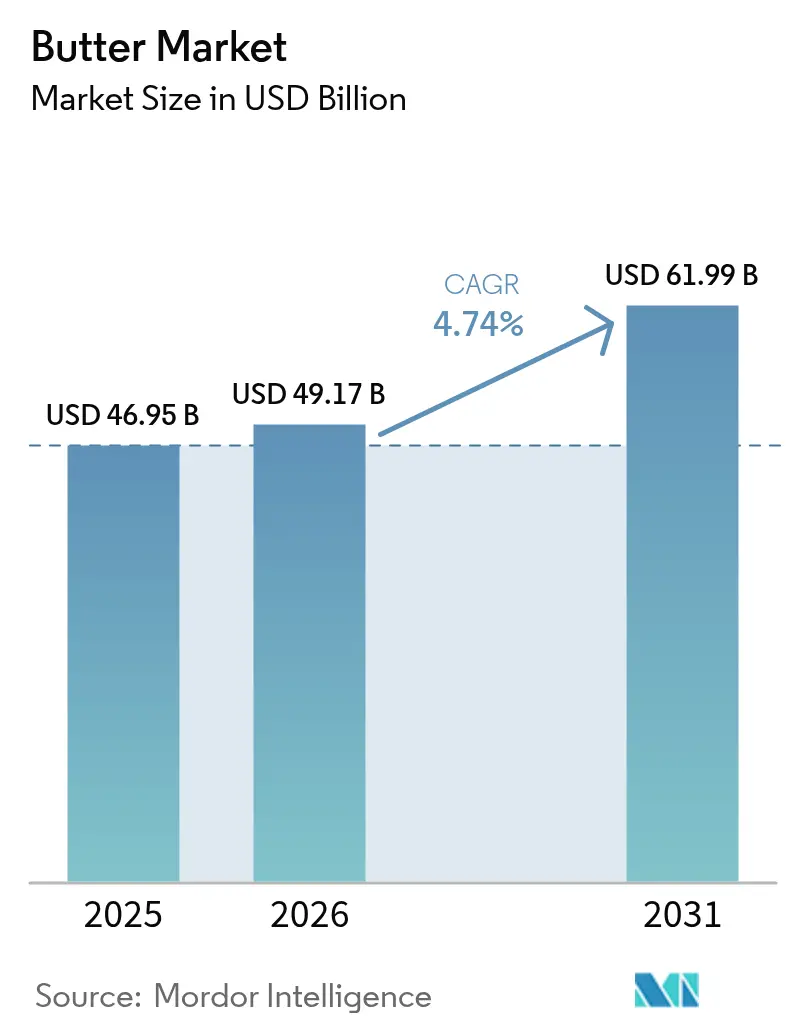
The global butter market size was valued at USD 46.95 billion in 2025 and estimated to grow from USD 49.17 billion in 2026 to reach USD 61.99 billion by 2031, at a CAGR of 4.74% during the forecast period (2026-2031). The butter market exhibits steady growth driven by traditional household demand and new premium product segments, enabling it to maintain stability compared to the price fluctuations seen in other dairy commodities. Also, major cooperatives continue to channel milk fat away from bulk cream and toward higher-margin butter SKUs, thereby strengthening processor pricing power and justifying fresh capacity investments. Besides, premiumisation further supports value creation, as origin-specific stories and small-batch claims move butter from an anonymous pantry staple to a product that signals craftsmanship at retail. Alongside these shifts, the butter market benefits from home-baking enthusiasm and long-term supply contracts between dairies and commercial bakeries, which collectively shield processors from short-term input volatility and encourage stable capital allocation within the butter market.
Key Report Takeaways
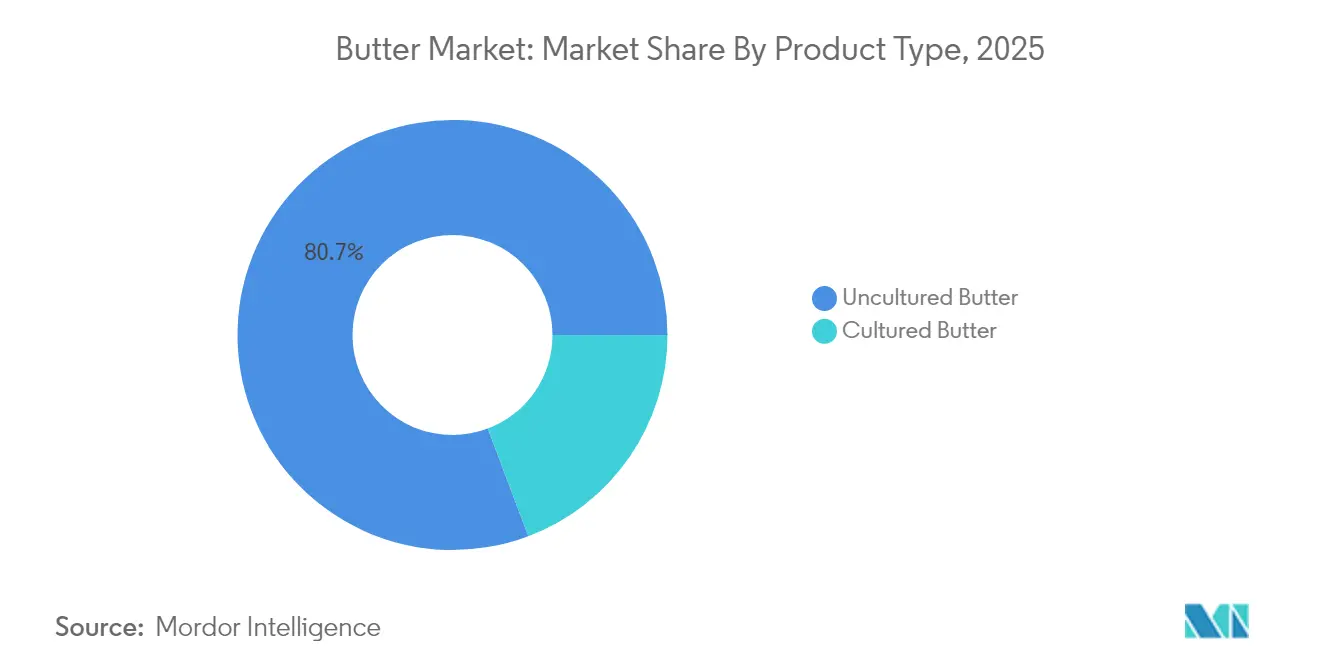
- By product type, uncultured butter accounted for 80.74% revenue share in 2025, and cultured butter is forecast to expand at a 5.69% CAGR through 2031.
- By source, animal-based held a 91.85% butter market share in 2025, and plant-based butter analogs are projected to grow at a 9.15% CAGR to 2031.
- By salt content, salted butter captured 63.72% of the butter market size in 2025, and unsalted butter is forecast to expand at a 4.86% CAGR between 2026 and 2031.
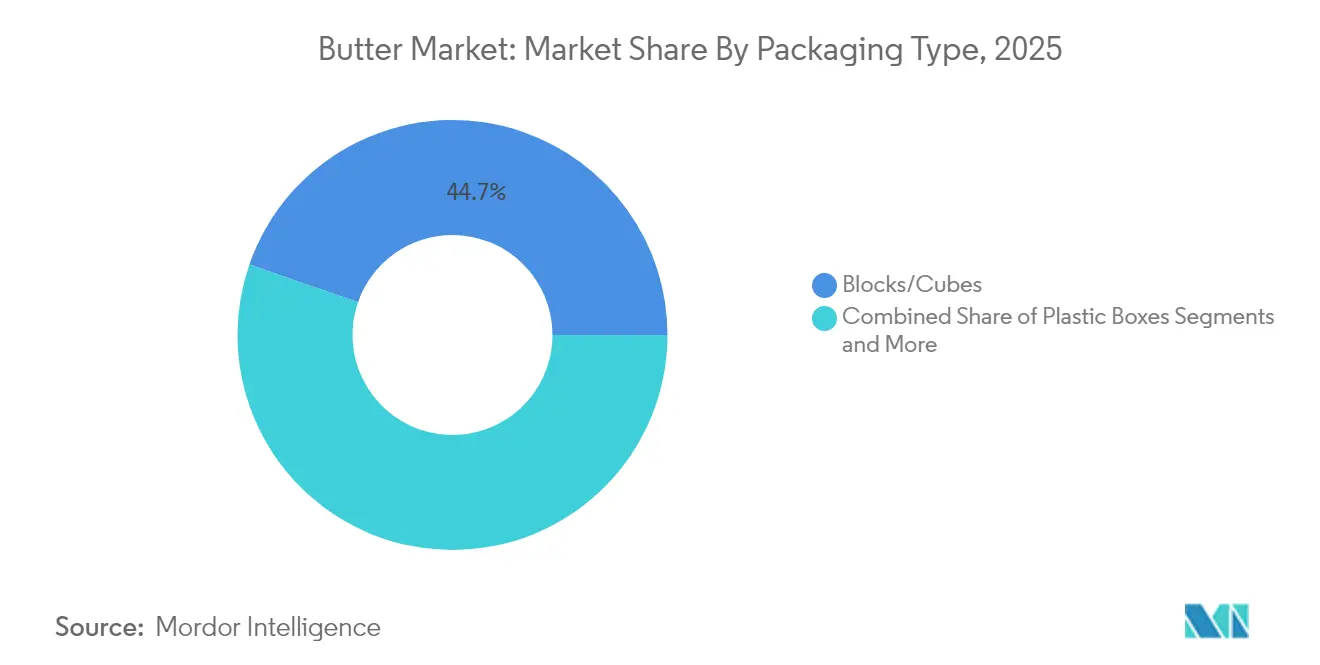
- By packaging type, blocks and cubes led with 44.68% butter market share in 2025, while plastic boxes are slated to grow at 4.88% CAGR over the forecast horizon.
- By distribution channel, off-trade channels represented 77.05% of global revenue in 2025, while on-trade channels are positioned to expand at a 5.12% CAGR through 2031, reflecting shifting access patterns in the butter market.
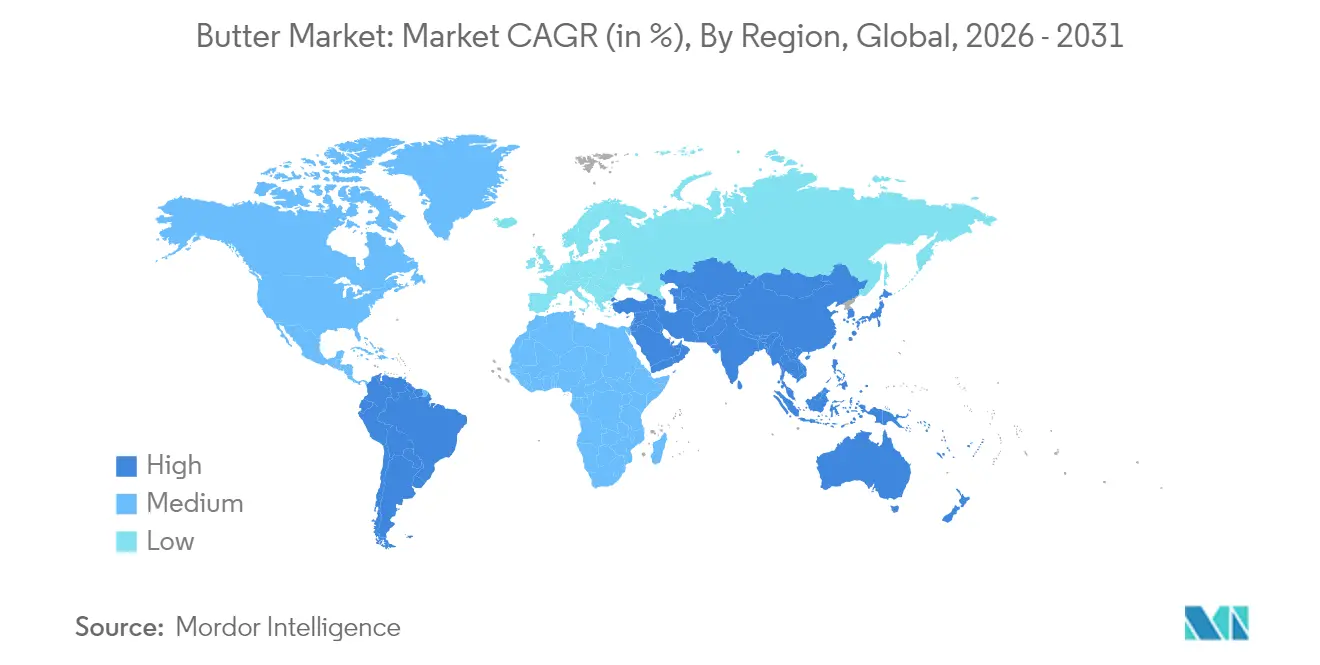
- By geography, Europe commanded 34.10% of global revenue in 2025, whereas Asia-Pacific is projected to post the fastest regional CAGR at 5.49% to 2031.
Note: Market size and forecast figures in this report are generated using Mordor Intelligence’s proprietary estimation framework, updated with the latest available data and insights as of 2026.
Market Trends and Insights
Drivers Impact Analysis of Butter Market*
| Driver | (~) % Impact on CAGR Forecast | Geographic Relevance | Impact Timeline |
|---|---|---|---|
| Premium Artisanal Butter Demand in the Bakery Channel | +1.2% | North America, Europe, Australia | Medium term (2-4 yrs) |
| Surge in Product Innovation and Packaging Efforts | +0.8% | Global; strongest in North America & Europe | Medium term (2-4 yrs) |
| Rising Demand for Natural and Organic Food Products | +1.0% | Global; led by developed markets | Long term (≥4 yrs) |
| Menu-innovation Push by QSR’s | +0.6% | Global urban centers | Short term (≤2 yrs) |
| Growing Popularity of Home Baking and Cooking | +0.5% | Global, with emphasis on developed markets | Medium term (2-4 yrs) |
| Growing Culinary Tourism and Globalization of Cuisines | +0.4% | Global, with strongest impact in tourist destinations | Medium term (2-4 yrs) |
| Source: Mordor Intelligence | |||


Premium Artisanal Butter Demand in the Bakery Channel
Artisanal butter products command substantial price premiums, often several multiples above mainstream offerings, yet bakery buyers continue to absorb the higher cost because flavor differentiation boosts product value downstream. Both independent and chain bakeries report that customers request information about the butter source used in pastries, demonstrating that butter origin has evolved into a key differentiator rather than an undisclosed ingredient. Manufacturers have responded by producing small-batch cultured variants, rolling out laminated formats optimised for croissant production, and highlighting single-breed or pasture-specific claims. The improved demand visibility for high-fat, low-moisture butter has enabled dairies to plan their production schedules more efficiently. The companies are offering new artisan butter products in the butter market to cater to the rising demand. For instance, Chef Nuno Bergonse and his wife Raquel established Manteiga Boua, an artisanal butter manufacturing operation, in Almancil. The product portfolio encompasses diverse flavor variants.
Rising Demand for Natural and Organic Food Products
The butter market is experiencing significant changes due to increasing consumer demand for clean-label products, with natural and organic varieties growing at double-digit rates compared to conventional products. This transformation aligns with broader food market trends where consumers actively seek products with clear ingredient transparency and minimal processing methods. Organic Valley's strategic expansion through the addition of more than 100 new family farms to its cooperative in 2024 directly addresses this increased market demand while emphasizing the fundamental relationship between sustainable farming practices and superior product quality. The continuous growth in the premium segment reflects consumers' increasing willingness to pay higher prices for products they perceive as healthier and environmentally sustainable. This consumer behavior trend is particularly prominent among younger demographic groups and higher-income households, creating substantial opportunities for product development and positioning that emphasize comprehensive health benefits and environmental sustainability credentials, driving premium growth in the butter market.
Menu-Innovation Push by QSRs
Quick-service restaurants are expanding butter usage in their menus beyond basic applications to include premium varieties as key differentiators. This creates opportunities for butter manufacturers to develop specialized foodservice formulations that maintain consistency while helping restaurants distinguish their offerings. The trend is particularly prominent in breakfast and bakery segments, where butter quality significantly influences customer perceptions of the final products. High-quality butter enhances the taste, texture, and overall appeal of baked goods, making it a crucial ingredient for foodservice operations. For instance, KFC Japan offers Premium Biscuits incorporating fermented butter from Hokkaido, aligning with its market expansion strategy and Japan's evolving butter market dynamics. The company maintains 1,200 stores across Japan and aims to increase its market presence. This strategic shift demonstrates the increasing recognition of foodservice as a key driver of value and innovation in the butter market.
Growing Popularity of Home Baking and Cooking
The increased adoption of home baking and cooking activities has driven global butter consumption. Consumer migration toward home-prepared meals has generated higher butter demand. This trend persists as consumers select home cooking due to health advantages and cost efficiency. According to the Agriculture and Horticulture Development Board, in 2024, 11% of survey respondents in the United Kingdom engaged in baking activities weekly, while 20% participated in baking monthly, demonstrating consistent consumer engagement in home baking [1]Agriculture and Horticulture Development Board, "Baking Trends in 2024", ahdb.org.uk. Additionally, social media platforms, specifically TikTok's "butter board" trend, have increased butter's market penetration and influenced consumer behavior toward butter-based food preparation. Manufacturers have implemented product innovations, including Land O'Lakes' butter balls, to address consumer demand for cooking efficiency. The sustained consumer engagement in home baking and cooking activities continues to drive butter market growth. This trend further strengthens the butter market.
Restraints Impact Analysis of Butter Market*
| Restraint | (~) % Impact on CAGR Forecast | Geographic Relevance | Impact Timeline |
|---|---|---|---|
| Competition from Other Alternatives | -0.9% | North America, Europe, Australia | Long term (≥4 yrs) |
| Climate-driven Milk-Supply Volatility | -1.1% | Global; acute in Oceania & Europe | Long term (≥4 yrs) |
| Saturated-fat Labeling Tightening Laws Hinder its Growth | -0.6% | North America, Europe | Medium term (2-4 yrs) |
| Environmental and Sustainability Issues | -0.8% | Global, with strongest impact in developed markets | Long term (≥4 yrs) |
| Source: Mordor Intelligence | |||
Climate-driven Milk-Supply Volatility
Weather-related disruptions in global milk production are significantly affecting butter availability and prices worldwide. The impact is particularly evident in butter prices across the European Union, which increased by 19% from October 2023 to October 2024. These substantial price fluctuations create operational challenges for food manufacturers and bakeries that depend on stable butter supplies and predictable prices for their production planning and cost management. The supply constraints are further intensified by reduced milk production in major exporting regions, creating additional market pressure. For instance, Australia has reached "peak milk," indicating a structural decline in production capacity, which has substantially increased its reliance on dairy imports to meet domestic demand. The persistent supply-demand imbalance in the global butter market presents strategic opportunities for producers with established milk supply chains and robust price management systems to maintain butter market stability.
Environmental and Sustainability Issues
Environmental and sustainability factors impact the butter market operations, primarily through dairy farming's carbon emissions, water consumption, and soil quality deterioration. Consumer awareness regarding the environmental effects of dairy products has increased monitoring of butter production processes. Manufacturers have implemented sustainable operations, including procurement from grass-fed cattle, adoption of recyclable packaging, and reduction of methane output. The market demonstrates increased demand for plant-based butter substitutes, indicating a shift toward environmentally efficient products. In developed markets, companies implementing sustainability measures demonstrate market growth. For instance, Fonterra, one of the world's largest dairy exporters, has committed to reducing on-farm emissions by 30% by 2030 through investments in low-emission farming technologies.
*Our forecasts treat driver/restraint impacts as directional, not additive. The impact forecasts reflect baseline growth, mix effects, and variable interactions.
Butter Market Segment Analysis
By Product Type:
Cultured Butter Gains Premium EdgeUncultured butter holds a dominant market share of 80.74% in 2025, driven by consumer familiarity and its wide use across retail and foodservice sectors. Cultured butter is experiencing rapid growth with a projected CAGR of 5.69% (2026-2031). This premium segment's expansion stems from its distinct tangy flavor and traditional production methods, which appeal to culinary enthusiasts and health-conscious consumers in developed markets who are willing to pay higher prices. The growth of cultured butter aligns with increasing consumer interest in fermented foods and their potential probiotic properties.
Moreover, manufacturers emphasize traditional production processes and extended fermentation times to differentiate their products. Premium packaging that maintains product quality while emphasizing high-end positioning has become a key competitive factor. As cultured butter transitions from specialty to premium mainstream status, both established manufacturers and artisanal producers can benefit from enhanced profit margins.


By Source:
Plant-based Disrupts Traditional DominanceAnimal-based butter holds 91.85% market share in 2025, supported by established production infrastructure and widespread consumer acceptance across global markets. Plant-based butter alternatives represent the fastest-growing segment, with a projected CAGR of 9.15% during 2026-2031, significantly outpacing the overall market growth rate. This growth stems from increasing consumer focus on health, sustainability, and animal welfare, particularly among younger consumers and in environmentally conscious markets.
Moreover, the plant-based segment continues to evolve through technological advancement, as demonstrated by companies like Savor, which has developed methods to produce fats using carbon dioxide, hydrogen, and oxygen without animal or plant inputs. For instance, in May 2025, French luxury pastry brand Maison Linotte launched Purely, a plant-based butter alternative. This product, designed for professional chefs and home bakers, features organic ingredients and excludes palm oil, additives, and common allergens.
By Salt Content:
Unsalted Captures Health-Conscious SegmentThe salted butter segment holds a 63.72% market share in 2025, maintaining its dominant position due to its versatile applications and flavor enhancement properties. The unsalted segment is projected to grow at a CAGR of 4.86% during 2026-2031, significantly outpacing the overall market growth rate. This growth stems from consumer preferences for products with lower sodium content and specific culinary applications, especially in baking, where salt content control is crucial. The expansion is supported by increased awareness of recommended sodium intake levels and their relationship to heart health.
The unsalted butter segment shows significant growth in health-conscious markets where butter serves primarily as a cooking ingredient. Manufacturers have adapted by introducing premium unsalted products with specific flavor characteristics developed through specialized cultures and production methods. The segment's minimal ingredient composition aligns with clean label preferences. This sustained growth pattern indicates a lasting change in consumer behavior, presenting opportunities for manufacturers to expand their unsalted butter product lines.
By Packaging Type:
Innovation Drives Consumer ConvenienceBlocks/cubes packaging format holds a dominant 44.68% market share in 2025, driven by its manufacturing efficiency and widespread acceptance across the retail and foodservice sectors. Plastic boxes are experiencing the highest growth rate with a projected CAGR of 4.88% during 2026-2031, exceeding the butter market's overall growth rate. The format's market expansion results from its product protection capabilities, shelf life extension features, and ease of use, particularly for premium butter products requiring flavor preservation.
In addition, sheets/slabs and carton formats maintain substantial market presence, catering to specific usage requirements and regional market preferences. Packaging developments are becoming key market differentiators. Fonterra introduced Anchor Squeezy in June 2024, featuring a butter and rapeseed oil blend in a squeezable bottle format designed for baking applications. In parallel, sustainability initiatives influence packaging decisions, as demonstrated by Cabot Creamery's implementation of packaging containing 30% post-consumer recycled film for its dairy products.
By Distribution Channel:
Off-Trade Reshapes Market AccessOff-trade holds a dominant 77.05% market share in 2025, supported by its extensive retail presence and established cold chain infrastructure for butter distribution. The on-trade is experiencing significant growth, with a projected CAGR of 5.12% during 2026-2031, exceeding the overall market growth rate. This expansion stems from pandemic-influenced shopping behavior changes, enhanced cold chain logistics, and the ability to offer diverse premium and specialty butter products. Online retail stores are gaining share as internet penetration. For instance, globally, 6 billion people were using the internet in 2025, according to the International Telecommunication Union .
Convenience stores, specialty stores, and other retail channels maintain their market positions by targeting specific consumer segments. Dairy manufacturers are increasingly implementing direct-to-consumer (D2C) strategies to enhance brand control and customer relationships. This shift responds to digitally-influenced consumer behavior changes and pandemic-driven shopping preferences. Companies adopt D2C approaches to improve profitability and expand market reach by removing intermediaries and reducing distribution costs. While logistics management and competition from plant-based alternatives present challenges, the industry continues to invest in e-commerce and direct sales channels to optimize operations and enhance customer service.
Geography Analysis
Europe Butter Market
Europe holds a 34.10% market share in 2025, supported by traditional butter consumption patterns and advanced dairy infrastructure. The region experiences supply challenges due to climate-related milk production fluctuations, resulting in increased butter prices. In response, European producers continue to expand capacity, as evidenced by Arla Foods' USD 300 million investment across five United Kingdom sites in May 2024. The investment includes upgrades to the Taw Valley site for export enhancement and improvements at Stourton, Aylesbury, and Westbury facilities.
APAC Butter Market
Asia-Pacific shows the highest growth potential with a projected CAGR of 5.49% during 2026-2031, exceeding global market growth rates. This growth stems from increased disposable incomes, urbanization, and Western dietary influence. The expansion of modern retail and e-commerce platforms improves product availability in non-urban areas. Fonterra's expansion of foodservice operations in Asia, particularly in China, indicates the region's strategic importance.
The Americas and MEA Butter Market
North American butter consumption is increasing as consumers transition to natural, full-fat dairy products, influenced by taste preferences and health perceptions. According to the International Dairy Foods Association data from 2024, 6.5 pounds of butter were consumed per capita in the United States . Also, the region faces supply challenges as dairy producers prioritize cheese production, affecting milk fat availability. The impact of avian influenza on dairy herds has contributed to reduced milk output and higher butter prices. The market continues to develop in premium and specialty butter categories. Moreover, South America and the Middle East & Africa represent emerging markets, with Brazil's food sector benefiting from updated regulations aimed at improving efficiency and competitiveness.

Regulatory Landscape
Butter is shaped by compositional identity and safety rules that influence labeling, import approvals, and how product claims are handled across countries. At the international level, Codex Alimentarius Standard for Butter (CXS 279-1971, amended) defines butter as a water-in-oil emulsion derived exclusively from milk, with composition anchors including a minimum 80% milkfat and limits on milk solids-not-fat, which many countries use when aligning domestic standards and trade documentation.
National updates add country-specific compliance layers. China implemented GB 19646-2025 (National Food Safety Standard for Cream, Butter, and Anhydrous Milk Fat) effective March 16, 2026, replacing the 2010 version and updating definitions, sensory requirements, and microbial limits, affecting both domestic producers and exporters. In parallel, WTO SPS/TBT notification activity for HS 0405 (including butter) during 2024 to 2026 underscores recurring scrutiny around dairy import procedures, health certification, and labeling or registration measures, making ongoing monitoring important alongside country programs such as Global Affairs Canada import controls and European Commission food safety campaign activity in 2026.
Value Chain Analysis
The butter value chain starts with milk production and collection, then moves through cream separation and standardization, pasteurization, churning or continuous butter-making, working and moisture control, packing, cold storage, and distribution into off-trade retail and on-trade foodservice or industrial bakery channels. Within processing, cooperatives and large dairies increasingly manage milk-fat allocation across butter, cream, and other dairy outputs, using long-term contracts and production scheduling to stabilize throughput and protect margins when farmgate milk supply fluctuates.
Logistics, input sourcing, and export dependence drive key frictions in cost-to-serve and service levels. In March 2026, the U.S. Dairy Export Council highlighted maritime supply-chain risks in Congressional testimony, citing dependence on a limited number of foreign-owned ocean carriers and disruptions such as skipped port calls and rejected bookings that can affect shipment timing for refrigerated dairy. On the supply side, 2026 also showed how production and inventory dynamics intersect in the United States, where butter production reached 916 million pounds in the first four months of 2026, while May cold storage stocks were reported at the lowest level since 2022, reinforcing the importance of cold-chain capacity, export channels, and inventory management for balancing seasonal production and demand.
Competitive Landscape
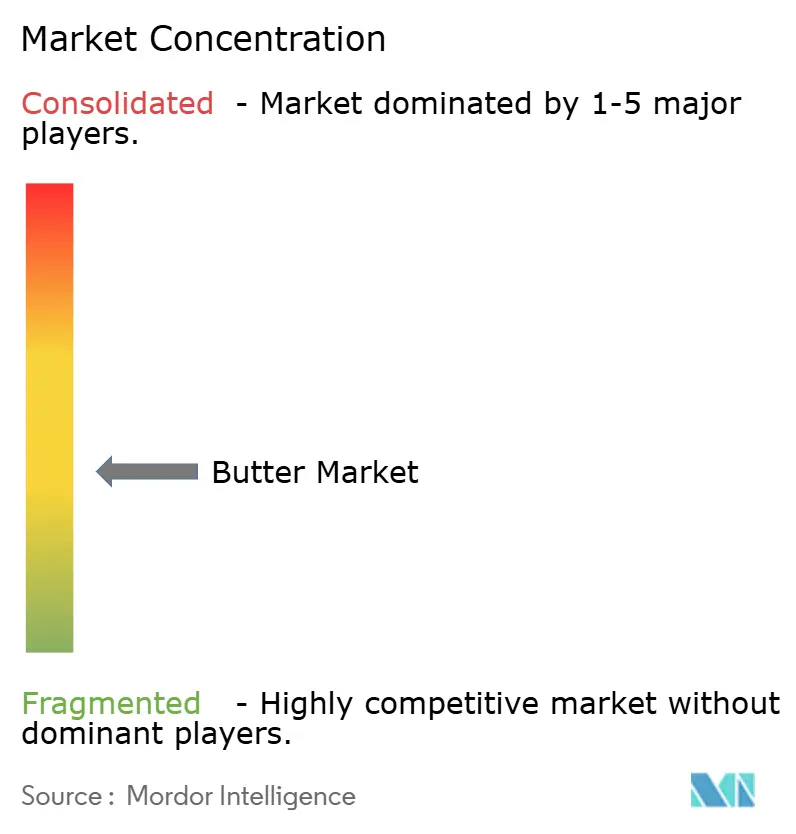
The global butter market maintains moderate concentration, with established multinational dairy cooperatives operating alongside regional producers and new market entrants. Companies in the dairy industry are increasing their manufacturing capacity through facility expansions to address the growing global butter demand and evolving consumer preferences. In October 2023, Ornua expanded its Kerrygold Park facility through a substantial EUR 40 million investment, effectively doubling its butter production capacity from 40,000 to 80,000 tonnes annually. This expansion positions the company to better address the increasing global demand for butter products and strengthens its market presence across the butter industry.
In addition, market opportunities are developing in sustainability, nutrition, and convenience segments. Companies like Savor are creating innovative butter alternatives using advanced carbon capture technology to deliver significant environmental benefits while maintaining essential product functionality and taste profiles.
Moreover, companies are gaining competitive advantages through sophisticated automated production systems that enhance product consistency and reduce operational costs, while implementing comprehensive digital supply chain solutions to effectively manage and mitigate climate-related disruptions. These technological implementations are becoming increasingly critical for maintaining market competitiveness and operational efficiency within the butter industry.
Butter Industry Leaders
-
Ornua Co-operative Ltd.
-
Land O' Lakes, Inc.
-
Arla Foods Amba
-
Fonterra Co-operative Group
-
Groupe Lactalis
- *Disclaimer: Major Players sorted in no particular order
Butter Market Companies Covered in this Report
- Fonterra Co-operative Group
- Arla Foods amba
- Ornua Co-operative Ltd
- Land O' Lakes Inc.
- Organic Valley (CROPP)
- Dairy Farmers of America
- Saputo Inc.
- Groupe Lactalis
- FrieslandCampina N.V.
- Kerry Group plc
- Valio Ltd
- Gujarat Co-operative Milk Marketing Federation (Amul)
- Upfield Group B.V.
- Almarai Company
- Westland Dairy Company
- Megmilk Snow Brand Co.
- CavinKare Pvt Ltd
- Berchtesgadener Land eG
- Emmi AG
- Ammerland eG
- Greenfields Ireland Ltd

Market Opportunities and Future Outlook
Premium and foodservice-focused capacity additions and manufacturing upgrades create near-term opportunities for suppliers that can secure milk fat and deliver consistent functionality. In Europe, FrieslandCampina commissioned new butter production capacity at its Lochem, Netherlands factory on June 18, 2026, and Lakeland Dairies announced a GBP 24.5 million upgrade at its Ballyrashane site in Northern Ireland (supported by Invest NI), both pointing to continued investment in modern butter processing and capacity for differentiated supply into retail and bakery customers.
Automation and quality-control technology remain practical levers for yield and specification compliance, especially for moisture and texture targets in laminated and artisanal applications. Continuous butter-making lines equipped with IoT sensors and PLC-based controls are being used to monitor moisture and energy in real time and reduce waste (reported at 10% to 15%), creating an opportunity for processors seeking operational efficiency, as well as for equipment suppliers offering modular retrofits and full-line installations (typically requiring capital outlays in the hundreds of thousands to over a million USD). These upgrades also align with sustainability and traceability requirements that increasingly show up in customer tenders and retailer specifications, complementing premiumization in cultured and origin-linked butter categories.
Recent Industry Developments in Butter Market
- July 2026: Land O Lakes, Inc. announced an investment at its Tulare, California dairy processing facility to expand into high-value dairy protein production. While protein-focused, the move reflects cooperative-led capital allocation toward higher-margin processing capabilities that can reshape milk component utilization strategies across the broader dairy portfolio.
- April 2025: Groupe Lactalis invested USD 50 million to ramp up cheese and butter production at its Uberlandia facility in Minas Gerais, Brazil. The capacity-focused spend supports localized supply in a large dairy-consuming market and strengthens Lactalis ability to serve retail and foodservice customers with domestically produced butter.
- November 2024: Springfield Creamery launched Nancy's Organic Butter under the Nancy's Probiotic Foods brand in Sea Salted and Unsalted variants. The launch adds new premium, organic cultured-butter choices at retail, supporting the clean-label and cultured-butter positioning that underpins higher-value segment growth.


Butter Market Report Scope and Research Methodology
Market Definition and Coverage
This market is defined as the value of dairy butter sold as a finished product across retail, foodservice, and industrial buyers, covering cultured and uncultured butter in solid and spreadable formats.
Scope exclusions: Clarified butter products (such as ghee and butter oil) and plant-based or blended fat spreads are excluded from this market size.
Segments Covered in This Report
-
By Product Type
- Cultured Butter
- Uncultured Butter
-
By Source
-
Animal Based
- Cow-milk
- Buffalo-milk
- Goat and Sheep-milk
- Other Animal Based
- Plant-based Butter Analogs
-
Animal Based
-
By Salt Content
- Salted
- Unsalted
-
By Packaging Type
- Blocks/Cubes
- Plastic Boxes
- Others (Sheet/slabs, cartons, etc.)
-
By Distribution Channel
-
Off-Trade
- Supermarkets / Hypermarkets
- Convenience and Grocery Stores
- Specialty Stores
- Online Retail Stores
- Other Distribution Channels
- On-Trade
-
Off-Trade
-
By Geography
-
North America
- United States
- Canada
- Mexico
- Rest of North America
-
Europe
- Germany
- France
- United Kingdom
- Netherlands
- Italy
- Sweden
- Poland
- Belgium
- Spain
- Rest of Europe
-
Asia-Pacific
- China
- India
- Japan
- Australia
- South Korea
- Indonesia
- Thailand
- Singapore
- Rest of Asia-Pacific
-
South America
- Brazil
- Argentina
- Chile
- Colombia
- Peru
- Rest of South America
-
Middle East and Africa
- United Arab Emirates
- South Africa
- Nigeria
- Saudi Arabia
- Egypt
- Morocco
- Turkey
- Rest of Middle East and Africa
-
North America
Data Sources, Market Sizing, and Validation
Desk Research
Desk work started by anchoring the dairy and butter supply picture using public statistics and reference tables, then mapping how butter moves through trade and consumption. Sources used for this step include, FAOSTAT and FAO dairy yearbooks, USDA dairy outlook publications, Eurostat agri food datasets, and UN Comtrade import export statistics. When definitions were not aligned (for example, butter versus broader dairy fats), we documented the mismatch and only carried forward what could be reconciled cleanly.
We also reviewed company annual reports, investor presentations, and credible press coverage to understand capacity additions, product mix changes, and demand shifts affecting food manufacturing and foodservice. For gap areas like private company revenue splits or fragmented distribution, we relied on paid subscriptions for company financials and intelligence, and on news and financial filings plus shipment-level trade checks to sense-check directionally. The desk sources named here are illustrative only, and additional public documents and datasets were also reviewed for data collection, cross-checking, and clarification.
Primary Interviews and Surveys
Primary work was used to confirm what counts as a finished butter sale in each region, and to tighten assumptions around pricing, channel mix, and industrial usage versus direct consumption. We spoke with a mix of producers, distributors, retailers, food manufacturers, and category specialists across major consuming and producing regions, so desk signals could be verified and remaining gaps could be closed before totals were finalized.
Distribution of primary research fieldwork respondents
| Company type | Respondent position | Region |
|---|---|---|
| Top tier: 25% | CXOs: 15% | APAC: 42% |
| Mid tier: 59% | Functional/Unit leaders: 30% | EMEA: 36% |
| Smaller Players: 16% | Managers: 55% | Americas: 22% |
Market-Sizing & Forecasting
Sizing began with a top-down build where dairy production, butter output indicators, and trade flows were used to reconstruct the addressable demand pool, then translated into value using region-specific price references. To keep the model practical, we leaned on repeatable inputs such as butter production and consumption trends, import export movements, per capita dairy intake signals, channel mix shifts between retail and foodservice, and observed price spreads for bulk versus packaged butter.
Those results were then cross-checked with selective bottom-up approximations, including sampled supplier revenue splits, distributor and retailer channel checks, and volume times average selling price sanity checks for key countries. When a data point was missing for a smaller market, we used proxy ratios from comparable countries (similar dairy herd economics and consumption patterns) and validated the proxy through interviews before it was accepted. For forecasting, scenario analysis was used so growth could be adjusted based on milk-fat availability, expected pricing direction, and substitution pressure from spreads, with the final path aligned to what primary respondents viewed as a realistic operating case.
Data Validation & Update Cycle
Validation was done in layers so the final number could be defended in a straightforward way. We compared modeled demand and value outputs against independent signals like trade balances, production swings, and pricing movements, then investigated outliers that did not align with what the supply chain was reporting. Before sign-off, the dataset and assumptions were reviewed in steps by another analyst, and follow-up calls were triggered when a variance could not be explained by seasonality, policy changes, or a clear market event.
The report is refreshed annually, and we also do interim checks when material developments could move butter pricing or availability. Right before delivery, a final refresh pass is completed so clients receive an updated view consistent with the latest publicly available data and interview feedback.
Mordor Intelligence's Butter Market Estimate Compared With Other Published Estimates
Published butter market estimates can vary even when they appear to measure the same category, because the product boundary and the pricing basis are not always aligned. Differences also show up when one source uses older base years or combines volume-led logic with value-led logic without clearly separating the steps.
Ghee and butter oil sit outside Mordor Intelligence's scope here, which is a common reason our 2026 value differs from figures that group multiple dairy fat products together. Other gaps typically come from counting plant-based spreads as butter, applying a single global average price without separating bulk versus packaged, and converting currencies using a different timing that does not match the base year pricing environment.
Benchmark comparison
| Source | Market Size | Gaps in Research Methodology |
|---|---|---|
| Mordor Intelligence | USD 49.17 B (2026) | |
| Global Consultancy A | USD 43.83 B (2025) | Uses a different base year and does not clearly state exclusions around clarified butter products or fat blends, which can shift what gets counted as butter value and how prices are averaged. |
| Industry Research Desk B | USD 44.00 B (2024) | Includes vegan butter as an in-scope product type and applies broader channel and application buckets, which can widen coverage beyond dairy butter sold as a finished product. |
Taken together, the spread across sources is largely explained by what is counted as butter versus adjacent fat products, plus the year and pricing basis used to value volumes. By keeping the inputs tied to observable dairy production, trade signals, and price references that can be rechecked each year, the estimate stays transparent and easier to reproduce when assumptions are updated.


Key Questions Answered in the Report
What is the projected global butter market size by 2031?
The market is expected to reach USD 61.99 billion by 2031.
How fast will the butter industry grow between 2026 and 2031?
Revenue is forecast to advance at a 4.74% CAGR over the period.
Which region will register the fastest butter market growth?
Asia-Pacific is projected to post the highest regional CAGR at 5.49% through 2031, fueled by rising incomes and Western-style baking adoption.
Why is cultured butter gaining traction with consumers?
Cultured butter delivers a tangy flavor profile and artisanal image that resonate with consumers seeking premium differentiation, underpinning its projected 5.69% CAGR to 2031.
Page last updated on:


 Your data is secure and never sold or shared.


