
Market Overview
| Study Period | 2020 - 2031 |
|---|---|
| Forecast Data Period | 2026 - 2031 |
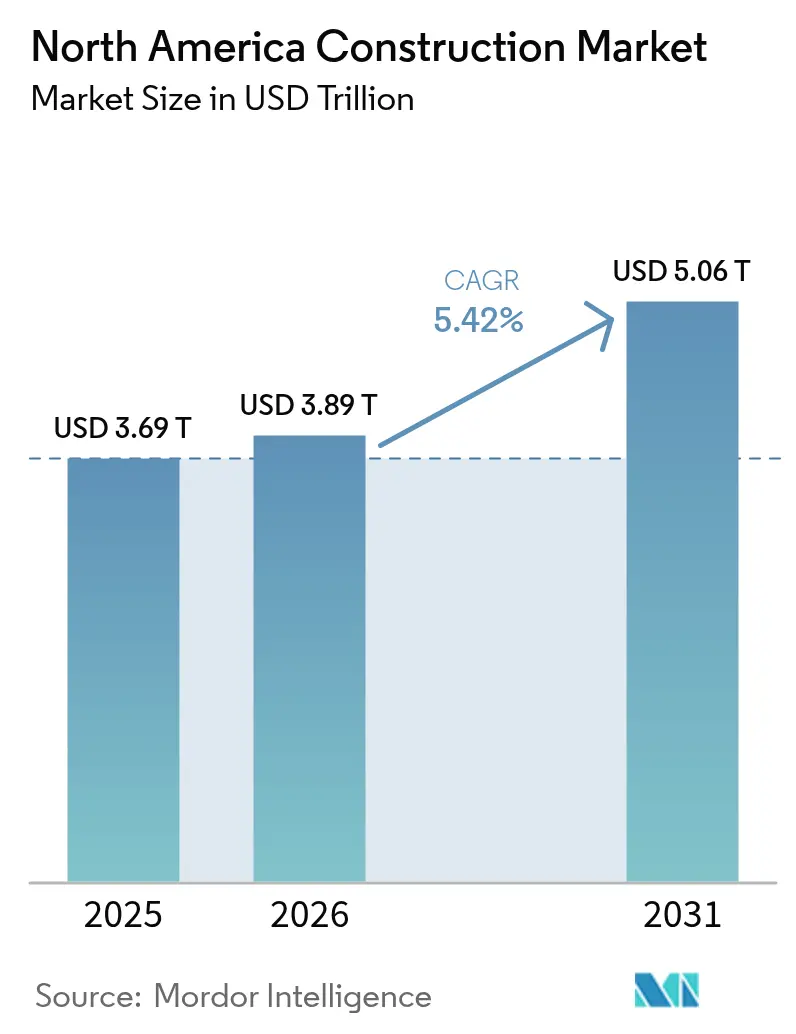
| Base Year Market Size (2025) | USD 3.69 Trillion |
| Market Size (2026) | USD 3.89 Trillion |
| Market Size (2031) | USD 5.06 Trillion |
| Growth Rate (2026 - 2031) | 5.42% CAGR |
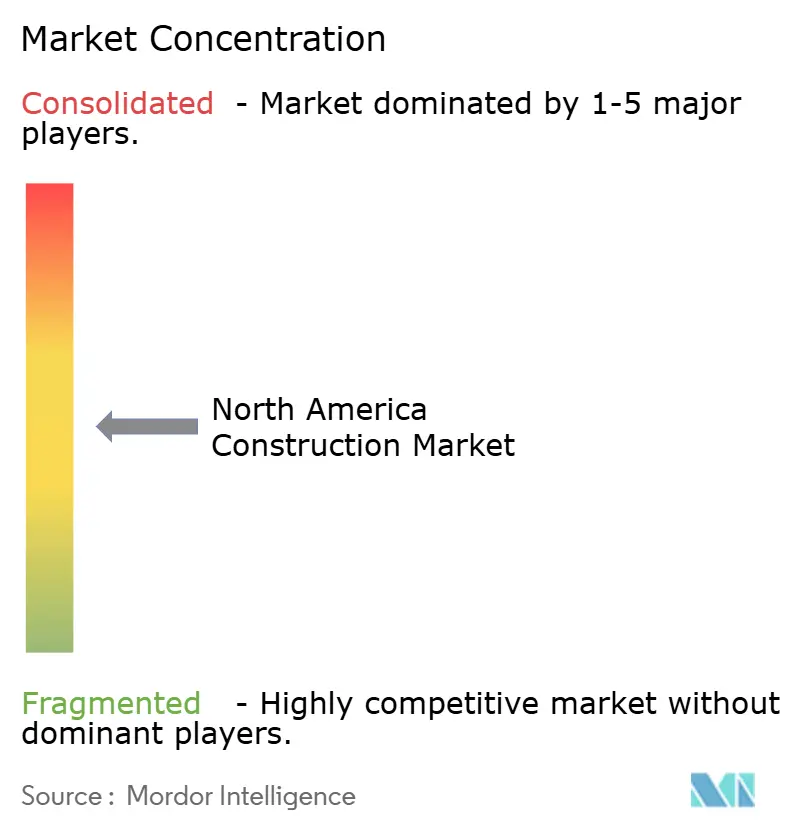
| Market Concentration | Medium |
Major Players *Disclaimer: Major Players sorted in no particular order Image © Mordor Intelligence. Reuse requires attribution under CC BY 4.0. | |
North America Construction Market Analysis by Mordor Intelligence
North America Construction Market size in 2026 is estimated at USD 3.89 trillion, growing from 2025 value of USD 3.69 trillion with 2031 projections showing USD 5.06 trillion, growing at 5.42% CAGR over 2026-2031. Public stimulus, a rebounding U.S. housing cycle, surging data-center builds, and aggressive grid-hardening mandates together redefine demand patterns, moving activity away from routine repair toward capacity-building projects that require specialized skill sets. The Flatiron-Dragados merger and similar large-scale integrations elevate competitive stakes, while prefabrication and mass-timber solutions gather momentum as contractors seek schedule certainty amid chronic skilled-labor shortages. Federal and provincial incentives linked to semiconductor manufacturing, renewable power, and resiliency upgrades multiply private co-investment, tightening supply in critical trades and inflating bid prices. At the same time, climate-linked insurance premiums and e-permitting backlogs create localized headwinds that firms must navigate to capture margin.
Key Report Takeaways
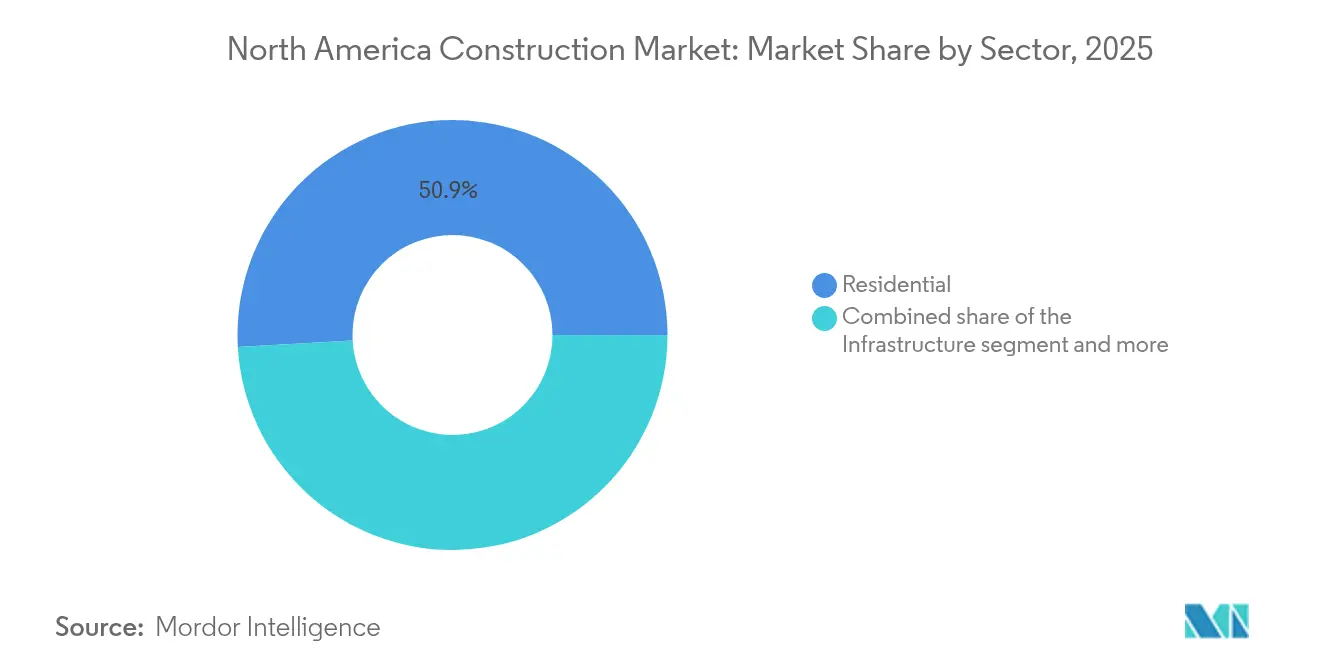
- By sector, the Residential sector controlled 50.88% of 2025 revenue, while Infrastructure is projected to lead growth at a 7.67% CAGR through 2031.
- By Construction type, the New Construction commanded a 69.35% share of the North America construction market in 2025; Renovation is advancing at a 6.44% CAGR through 2031.
- By construction method, Conventional on-site work represented 89.95% of current activity, yet Modern Methods of Construction are expanding at an 8.76% CAGR.
- By investment source, Private sources funded 75.25% of 2025 spending; Public financing is poised to grow at a 6.7% CAGR as stimulus programs roll out.
- By geography, the United States accounted for 84.05% of 2025 revenue; Canada is projected to pace the region at a 6.12% CAGR through 2031.
Note: Market size and forecast figures in this report are generated using Mordor Intelligence’s proprietary estimation framework, updated with the latest available data and insights as of 2026.
North America Construction Market Trends and Insights
Drivers Impact Analysis*
| Driver | ( ~ ) % Impact on CAGR Forecast | Geographic Relevance | Impact Timeline |
|---|---|---|---|
| Expansionary U.S. & Canadian infrastructure stimulus | +1.8% | United States & Canada, spillover to Mexico | Medium term (2-4 years) |
| Rebound in single-family housing starts on falling mortgage rates | +1.2% | United States primarily, moderate Canada impact | Short term (≤ 2 years) |
| Surging data-center builds powering industrial & utility demand | +1.0% | United States core, expanding to Canada | Medium term (2-4 years) |
| Grid-hardening & micro-grid retrofits mandated by insurers | +0.8% | U.S. wildfire regions, expanding nationally | Long term (≥ 4 years) |
| Mass-timber & modular methods shortening schedules & lowering CO₂ | +0.4% | Canada leading, U.S. adoption accelerating | Long term (≥ 4 years) |
| Near-shoring-led industrial corridors along US-CAN-MEX gateways | +0.6% | Border trade corridors | Medium term (2-4 years) |
| Source: Mordor Intelligence | |||


Expansionary U.S. & Canadian Infrastructure Stimulus (IIJA, CHIPS, IRA)
Federal laws such as the IIJA, CHIPS and Science Act, and Inflation Reduction Act are injecting hundreds of billions of dollars into transportation, semiconductor plants, and clean-energy assets, generating multi-year backlogs for heavy civil contractors. The 40,000-plus projects already awarded under IIJA alone validate a structural demand shift away from cyclical resurfacing toward transformative builds requiring advanced materials and digital project controls. Canadian provinces mirror the push with USD 231 billion in planned major projects supported by USD 58 billion in public-private partnerships, ensuring cross-border capacity constraints persist. Because every federal construction dollar is crowding in close to three private dollars in sectors like chip fabrication, the stimulus effect will echo well past initial appropriations. Contractors capable of EPC delivery and compliance reporting are best positioned to monetize the pipeline.
Rebound in Single-Family Housing Starts on Falling Mortgage Rates
Lower mortgage rates expected in 2026 underpin a modest rebound in single-family starts to 1.01 million units, adding stability to the North America construction market even as multifamily developers battle financing friction. Demand stems from a 1.5 million-unit structural housing deficit that forces buyers to new builds when resale inventory remains tight. Builders in land-constrained metros wield pricing power, whereas over-supplied regions witness discounting and margin compression. Although regulatory costs now absorb 24% of closing prices, easing credit spreads should partially offset the burden, supporting steady production. The segment’s resilience offers contractors a volume hedge as office pipelines retrench[1]Alicia Huey, “Housing Starts Forecast: 2025–2027,” National Association of Home Builders, nahb.org.
Surging Data-Center Builds Powering Industrial & Utility Demand
Artificial-intelligence workloads, edge-computing applications, and hyperscale cloud growth pushed data-center construction activity 70% higher in 2024, creating the region’s fastest-growing commercial sub-sector. Secondary metros boasting inexpensive land and robust substations—from Columbus to Calgary—are emerging as design-build hotspots. Projects require redundant 400 kV lines, precision HVAC, and electromagnetic shielding that only a narrow contractor pool can supply, driving premium margins. Utilities are investing USD 2 billion to reinforce transmission, bolstering EPC backlogs. State tax incentives linked to zero-carbon procurement further catalyze colocation retrofits, sustaining momentum through the decade.
Grid-Hardening & Micro-Grid Retrofits Mandated by Insurers
Wildfire and hurricane losses are prompting insurers to demand resilience features as a prerequisite to coverage. Programs such as PG&E’s 2025 Wildfire Mitigation Plan and California’s first community micro-grid prove that undergrounding, sectionalizing, and battery-backed islanding solutions can preserve grid uptime. Retrofit costs ranging from USD 2,000 to USD 100,000 per property create a steady specialty-construction lane. Because risk-weighted premiums now incorporate resilience scores, owners who defer upgrades face escalating coverage costs, pushing demand toward engineers and contractors versed in distributed-energy integration[2]Pacific Gas and Electric Company, “2025 Wildfire Mitigation Plan,” PG&E Investor Relations, pge.com.
Restraints Impact Analysis*
| Restraint | ( ~ ) % Impact on CAGR Forecast | Geographic Relevance | Impact Timeline |
|---|---|---|---|
| Skilled-labor shortages are inflating bid prices | -1.4% | North America-wide, acute in specialized trades | Short term (≤ 2 years) |
| High financing costs for multifamily & office developments | -0.9% | U.S. urban centers, moderate Canada impact | Medium term (2-4 years) |
| Climate-risk insurance premium volatility | -0.6% | U.S. hurricane and wildfire zones | Long term (≥ 4 years) |
| Municipal e-permitting backlogs are delaying starts | -0.4% | Major metros in the U.S. & Canada | Short term (≤ 2 years) |
| Source: Mordor Intelligence | |||
Skilled-Labor Shortages Inflating Bid Prices
A projected 501,000-worker deficit in 2024 left mechanical, electrical, and plumbing subcontractors with record overtime and soaring recruiter fees. More than 20% of the construction workforce is aged 55 or older, heightening the retirement cliff. Canada needs an additional 231,000 craft workers by 2034, mirroring U.S. constraints. Limited crews force contractors to walk away from jobs or lengthen schedules, pushing bid prices higher and eroding owner contingencies. New apprenticeship incentives may relieve pressure after 2027, yet the short-term supply gap remains acute.
High Financing Costs for Multifamily & Office Developments
While policy easing is anticipated, today’s capital stack costs still place downward pressure on debt-service coverage ratios for towers in gateway cities. Multifamily starts are projected to fall 11% in 2025 before stabilizing, partly offsetting volume gains elsewhere. Office developers struggle further as vacancy rates remain elevated; lenders are demanding higher pre-lease commitments and interest reserves. The mismatch between construction-loan origination rates and future permanent financing heightens refinancing risk, deterring speculative projects and suppressing the North America construction market pipeline in dense urban cores.
*Our forecasts treat driver/restraint impacts as directional, not additive. The impact forecasts reflect baseline growth, mix effects, and variable interactions.
Segment Analysis
By Sector: Infrastructure Drives Long-Term Growth
Infrastructure is expected to outpace all other sectors at a 7.67% CAGR, even though Residential retained the largest 2025 share. Roads, bridges, and transit projects funded under the IIJA create predictable multi-year workstreams, keeping civil crews at capacity. Energy and utility construction is buoyed by USD 2 billion in grid-hardening outlays that dovetail with battery storage mandates, while airport terminals draw USD 2.89 billion in fiscal 2025 federal grants.
Residential demand hinges on the single-family rebound and chronic inventory shortages; the North America construction market size linked to single-family housing is forecast to advance by 4% in 2026, absorbing skilled trades that might otherwise anchor infrastructure labor pools. Commercial performance is mixed: data-center floor space is rocketing, but office towers face vacancy-driven pauses. Industrial builds related to near-shoring partly offset retail footfalls, unifying a complex but generally upward trajectory for the North America construction market.


By Construction Type: Renovation Accelerates
Although new builds still capture 69.35% of 2025 revenue, renovation shows faster growth amid aging assets and sustainability retrofits. Building owners facing carbon-pricing rules prefer refurbishments that embed electrification, smart controls, and resilience features rather than raze-and-replace. Insurer-mandated wildfire hardening alone represents more than USD 4 billion in annual retrofit opportunity, lifting the North America construction market size for renovation steadily through 2031.
New Construction pipelines remain elevated thanks to semiconductor fabs and logistics hubs, but access to skilled labor and materials volatility push schedules to the right. Contractors leveraging integrated design-build platforms protect margins, yet smaller builders struggle with cash-flow gaps. Over time, owners may increasingly favor adaptive reuse and vertical extensions, balancing the North America construction market share between greenfield and brownfield activities.
By Construction Method: Modern Methods Gain Traction
Conventional on-site processes accounted for 89.95% of 2025 output, reflecting entrenched supply chains and financing norms. Yet modern methods modular, panelized, and mass-timber are rising at an 8.76% CAGR as builders seek productivity gains to counter labor shortages. Canada’s USD 19 billion financing program for modular housing plants provides scale, while U.S. federal zero-emission mandates reward offsite fabrication that meets high-performance envelopes.
Early adopters report 15-20% schedule compression and less weather downtime, translating into working-capital savings. Banks now underwrite modular draws based on factory milestones, equalizing liquidity with stick-built alternatives. Even so, the North America construction market remains deeply rooted in conventional methods, suggesting a gradual, not disruptive, transition.

By Investment Source: Public Sector Accelerates
Private capital still funds 75.25% of activity, but public spending is gaining share due to unprecedented federal appropriations. The CHIPS Act alone has earmarked USD 52.7 billion, catalyzing fabs that create a halo of supplier facilities and worker housing. Canada’s public-private partnership pipeline, worth USD 58 billion, spreads risk while ensuring shovel-ready status for transport, energy, and social projects.
Public dollars often trigger a 3:1 private co-investment ratio, magnifying the demand surge and expanding the North America construction market footprint. Yet developers reliant on private loans must navigate higher coupon rates, especially for multifamily and office properties, until interest-rate cycles normalize.
Geography Analysis
The United States generated 84.05% of 2025 revenue, powered by IIJA awards, semiconductor mega-projects, and a 70% leap in data-center capacity. Wildfire-prone western states alone will spend USD 2 billion on grid hardening and vegetation management through 2026, carving a specialized services niche. Meanwhile, Sun Belt metros capture residential inflows as remote workers favor affordable markets, reinforcing uneven regional labor dynamics across the North America construction market.
Canada is the fastest-growing geography at a 6.12% CAGR to 2031, anchored by USD 231 billion in scheduled projects that tackle a USD 208 billion infrastructure deficit. Energy dominates with more than 340 clean-power and LNG initiatives; mass-timber high-rises in Vancouver and Toronto demonstrate regulatory green lights for low-carbon materials. The USD 4.4 billion (converted) Gordie Howe International Bridge, on track for September 2025 completion, enhances bi-national freight flow. Government financing of modular plants aims to deliver 3.5 million new housing units by 2030, widening renovation and greenfield prospects.
Mexico faces a 7% contraction in government spending for 2025 under fiscal austerity, but industrial real-estate clusters in Nuevo Leon, Chihuahua, and the Bajío offer counter-cyclical opportunities tied to near-shoring. The USD 100 million CPKC rail bridge and 17 planned private industrial parks hint at underlying optimism, yet labor-skills mismatches and administrative hurdles temper immediate upside. Together, these mixed conditions keep Mexico’s contribution to the North America construction market modest in the near term.
Regulatory Landscape
The North America construction market operates under layered, decentralized rules, with federal overlays in the United States (including OSHA, ADA, and Clean Water Act obligations) above state and municipal building, zoning, and permitting regimes. These requirements directly affect project schedules, inspections, and compliance costs. In March 2026, the United States issued a federal action focused on removing regulatory barriers to affordable home construction, keeping regulatory streamlining and permitting throughput in focus for residential pipelines.
In Canada, specification and code updates continue to influence documentation, materials selection, and sustainability compliance. In April 2026, the National Research Council Canada published the 2026-04 edition of the National Master Construction Specification (NMS), adding content tied to decarbonization, digitalization, and alignment with Public Services and Procurement Canada requirements, while Ontario issued amendments to align provincial requirements with the National Building Code framework for construction, demolition, and change-of-use. Separately, the July 1, 2026 USMCA joint review led the United States to decline renewal, with the agreement staying in force through July 1, 2036 and moving to annual reviews. That change keeps ongoing monitoring of cross-border rules relevant, including potential tariff-related inputs for steel, lumber, and other construction materials.
Value Chain Analysis
The value chain runs from project origination and finance (public appropriations and private capital) to planning and design (architectural and engineering services), procurement (materials, equipment, and specialty systems), execution (general contractors, trade subcontractors, and construction management), and commissioning or operations. Demand is concentrating in complex builds such as data centers, grid upgrades, and semiconductor facilities, which increases reliance on specialized MEP, high-voltage, and controls contractors. It also elevates the need for early design coordination and long-lead procurement within EPC and design-build delivery models.
Upstream constraints are also shaping delivery and pricing. Input-cost pressure is visible in non-residential construction inputs rising 2.4% in May 2026 and 9.7% year over year, while labor availability remains a binding constraint, with hiring difficulty reported in electrical, plumbing/pipefitting, and specialist welding. Supply risk is most acute in electrical gear (switchgear, transformers), where lead times can stretch to 18 to 24 months, affecting utility interconnections and mission-critical schedules. Contractors and owners respond by locking supplier agreements earlier, standardizing designs, and increasing contingencies where tariff and commodity volatility are prominent. On the supply side, domestic capacity moves such as Nucor announcing a new Kentucky sheet mill point to efforts to reduce structural steel bottlenecks and lessen exposure to cross-border disruption.
Competitive Landscape
North American construction is moderately fragmented but consolidating. The Flatiron-Dragados integration produced the region’s second-largest civil contractor with USD 17.2 billion in backlog, signaling a race for scale in mega-project bidding. Materials producers are following suit: Quikrete’s USD 11.5 billion takeover of Summit Materials secures upstream cement and aggregates, insulating it from price swings.
Technology adoption accelerates as 44% of firms budget for AI-driven scheduling and drone-based progress verification. Modular plant operators like Nexii and Factory_OS gain mindshare despite comprising just 9.6% of activity, hinting at future share capture as lenders grow comfortable with volumetric risk. Climate-resilience specialists and zero-emission builders become acquisition targets for traditional GCs looking to enter high-margin niches.
International groups such as VINCI continue rolling up regional roadwork operators, adding USD 165 million (converted from EUR 150 million) in annual revenue through 2025 purchases. Medium-sized design-build firms that own data-center or semiconductor expertise wield negotiating leverage, driving joint-venture premiums. Overall, the North America construction market rewards scale, specialty skills, and digital fluency in equal measure, shaping a competitive chessboard in flux.
North America Construction Industry Leaders
Bechtel Corporation
Turner Construction Co.
D.R. Horton Inc.
Lennar Corporation
PCL Construction Group Inc.
- *Disclaimer: Major Players sorted in no particular order

Market Opportunities and Future Outlook
Infrastructure-linked programs and large utility and energy projects create room for contractors and suppliers that can manage long-lead electrical equipment, interconnection sequencing, and compliance-heavy delivery. A concrete signal is the June 2026 completion of the 339-mile Champlain Hudson Power Express, a 1,250 MW HVDC transmission link between Quebec and New York City, which highlights ongoing demand for transmission, converter-station, and corridor construction capabilities. It also aligns with the broader grid-hardening priorities visible in wildfire and storm-exposed regions.
Logistics and trade-corridor capacity additions broaden opportunity for heavy civil, port works, and border-adjacent industrial development. In July 2026, the Port of Vancouver selected the TerraMarine consortium as the preferred proponent for the Roberts Bank Terminal 2 container terminal expansion (about USD 3 billion), and the Gordie Howe International Bridge confirmed a July 27, 2026 opening date. Separately, the shift from pilots to scaled deployment of digital workflows, including AI-driven planning and site monitoring, is increasingly tied to owner requirements and insurance considerations. That is creating a pathway for firms that standardize reporting and embed digital controls, while using prefabrication and modular execution to reduce schedule risk amid persistent labor scarcity.
Recent Industry Developments
- June 2026: Micron Technology selected Bechtel as EPC partner for the first phase of its semiconductor manufacturing complex in Clay, New York. The award reinforces demand for contractors with cleanroom, high-purity MEP, and complex commissioning capabilities, and it extends the backlog visibility created by CHIPS-related megaproject pipelines.
- May 2026: Cheniere Partners issued Bechtel a limited notice to proceed under a USD 4.69 billion EPC contract for Train 7 of the Sabine Pass Liquefaction Expansion Project in Louisiana. The work advances a major LNG capacity build and keeps large-scale industrial construction resources concentrated in energy megaproject delivery.
- November 2024: Quikrete disclosed an agreement to acquire Summit Materials for about USD 11.5 billion. The deal reshapes North American cement, aggregates, and ready-mix supply positioning, with implications for pricing leverage and procurement strategies across large residential and infrastructure programs.


Research Methodology Framework and Report Scope
Market Definition and Coverage
For this methodology, the North America construction market is the value of construction activity delivered across the United States, Canada, and Mexico, covering work from project start through completion across buildings and other stationary structures.
Scope exclusions: It excludes off-book informal works and pure real estate transactions that do not involve construction execution.
Segmentation Overview
- By Sector
- Residential
- Apartments/Condominiums
- Villas/Landed Houses
- Commercial
- Office
- Retail
- Industrial and Logistics
- Others
- Infrastructure
- Transportation Infrastructure (Roadways, Railways, Airways, others)
- Energy & Utilities
- Others
- Residential
- By Construction Type
- New Construction
- Renovation
- By Construction Method
- Conventional On-Site
- Modern Methods of Construction (Prefabricated, Modular, etc)
- By Investment Source
- Public
- Private
- By Geography
- United States
- Canada
- Mexico
Data Sources, Market Sizing, and Validation
Desk Research
Desk research was used to set the foundation for demand signals, policy context, and consistent definitions across the region. We referenced public series and documents such as US Census construction spending releases, Statistics Canada construction and building permits tables, and Mexico statistics portals for construction output, along with central bank inflation series that guide value normalization.
To cross-check the pace of new builds versus renovation, materials and labor cost movement, and infrastructure funding visibility, sources such as transport and infrastructure agencies, energy and grid related public filings, and open trade statistics were also reviewed. Company annual reports, investor presentations, and reputable press were used to validate major project cycles and backlog direction, and a paid subscription covering company financials and news helped with consistency checks on large contractors. These examples are illustrative, and many other public sources were also reviewed for data collection, validation, and clarification.
Primary Interviews and Surveys
Primary work was used to confirm what is actually being built, how pricing is moving (especially for labor and materials), and how public and private pipelines translate into awarded work. We spoke with contractors, engineering and project management participants, materials distributors, and sector specialists across the United States, Canada, and Mexico, and then we used follow-up re-contacts when a key assumption or series did not match the on-the-ground timing.
Distribution of primary research fieldwork respondents
| Company type | Respondent position | Region |
|---|---|---|
| Top tier: 27% | CXOs: 20% | |
| Mid tier: 52% | Functional/Unit leaders: 20% | |
| Smaller Players: 21% | Managers: 60% |
Market-Sizing & Forecasting
Sizing starts with a top-down build that reconstructs construction value from official spending and output series, then aligns it to the North America boundary and the report definition of construction activity. To keep the model practical, we track a small set of inputs that explain most of the movement, such as construction spending by sector, public versus private investment momentum, permit and starts indicators, cost inflation (materials and wages), and the mix shift between new construction and renovation.
Once the regional total is formed, selective bottom-up approximations are used to check whether the total feels reasonable. This includes sampled project value benchmarks, channel checks on large material categories, and sanity checks using contractor revenue direction where disclosure allows. When a bottom-up check is incomplete for a country or subsector, the gap is handled through share-based allocation tied back to the most stable public series, and then reviewed with interview feedback.
For forecasting, scenario analysis is used because construction pipelines can shift quickly with policy, rates, and funding releases. Assumptions on infrastructure programs, housing demand, and cost progression are adjusted using expert consensus, and then the forecast is reconciled back to the same input set so year-to-year movement stays explainable.
Data Validation & Update Cycle
Validation is done by comparing the model output against independent signals, including sector level spending direction, public program disbursement timing, and observed shifts between new build and renovation work. If a variance looks too large, the assumptions are re-checked, and respondents are re-contacted when the discrepancy is linked to pricing, backlog conversion, or country-level timing.
Before sign-off, the model goes through multi-step analyst review where outliers are challenged, unit consistency is verified, and currency and inflation handling is re-tested. Reports are refreshed annually, with interim updates when a material event changes the outlook, and a final pre-delivery pass is completed so the numbers reflect the latest available releases.
Mordor Intelligence's North America Construction Market Size Versus Other Published Estimates
Published market sizes for North America construction can look far apart, even when the topic sounds the same, because the underlying scope and the way value is constructed are not always identical. Differences usually come from what gets counted as construction, which countries are fully included, and whether the estimate is tied to official spending series or to broader industry revenue proxies.
The table shows a clear spread across 2025 values, and in Mordor Intelligence's model the market reflects construction activity across the United States, Canada, and Mexico and keeps the split logic consistent across sectors, new construction versus renovation, construction method, and public versus private investment. Other estimates often shift the boundary by adding demolition as a value bucket, using narrower country coverage, or applying slower price progression, which can pull totals down even when volume trends are similar.
Benchmark comparison
| Source | Market Size | Gaps in Research Methodology |
|---|---|---|
| Mordor Intelligence | USD 3.69 T (2025) | |
| Global Consultancy A | USD 2.31 T (2025) | Uses a different market build that explicitly includes demolition alongside new construction and renovation, and its country coverage is not clearly aligned to the full United States, Canada, and Mexico set, which can compress totals. |
| Advisory Firm B | USD 2.57 T (2025) | Relies on a narrower segmentation lens and does not clearly separate public versus private investment dynamics in the sizing narrative, which can lead to more conservative value assumptions in years with strong public funding visibility. |
What this comparison mainly highlights is that the number changes when the definition shifts, not just when growth assumptions change. By anchoring the value build to consistent public indicators and then pressure-testing it with targeted bottom-up checks, we end up with a market size that is easier to trace and repeat when new data releases arrive.


Key Questions Answered in the Report
What is the current value of the North America construction market?
It is USD 3.89 trillion in 2026 and projected to reach USD 5.06 trillion by 2031.
How fast is infrastructure spending growing in the region?
Infrastructure is expected to expand at a 7.67% CAGR through 2031, making it the fastest-growing sector.
Which country is the quickest-growing geography for construction?
Canada leads with a forecast 6.12% CAGR supported by USD 231 billion in planned major projects.
What is driving adoption of modular construction methods?
Labor shortages, schedule certainty, and government financing totaling USD 19 billion are accelerating modular uptake.
How are data-center projects influencing construction demand?
A 70% surge in data-center builds is creating high-margin work for specialized contractors and spurring USD 2 billion in utility upgrades.
Page last updated on:




