
Market Overview
| Study Period | 2020 - 2031 |
|---|---|
| Forecast Data Period | 2026 - 2031 |
| Base Year Market Size (2025) | USD 13.58 Billion |
| Market Size (2026) | USD 14.29 Billion |
| Market Size (2031) | USD 18.94 Billion |
| Growth Rate (2026 - 2031) | 5.80 % |
| Market Concentration | Low |
Major Players
*Disclaimer: Major Players sorted in no particular order Image © Mordor Intelligence. Reuse requires attribution under CC BY 4.0. |
|
India Waste Management Market Analysis by Mordor Intelligence
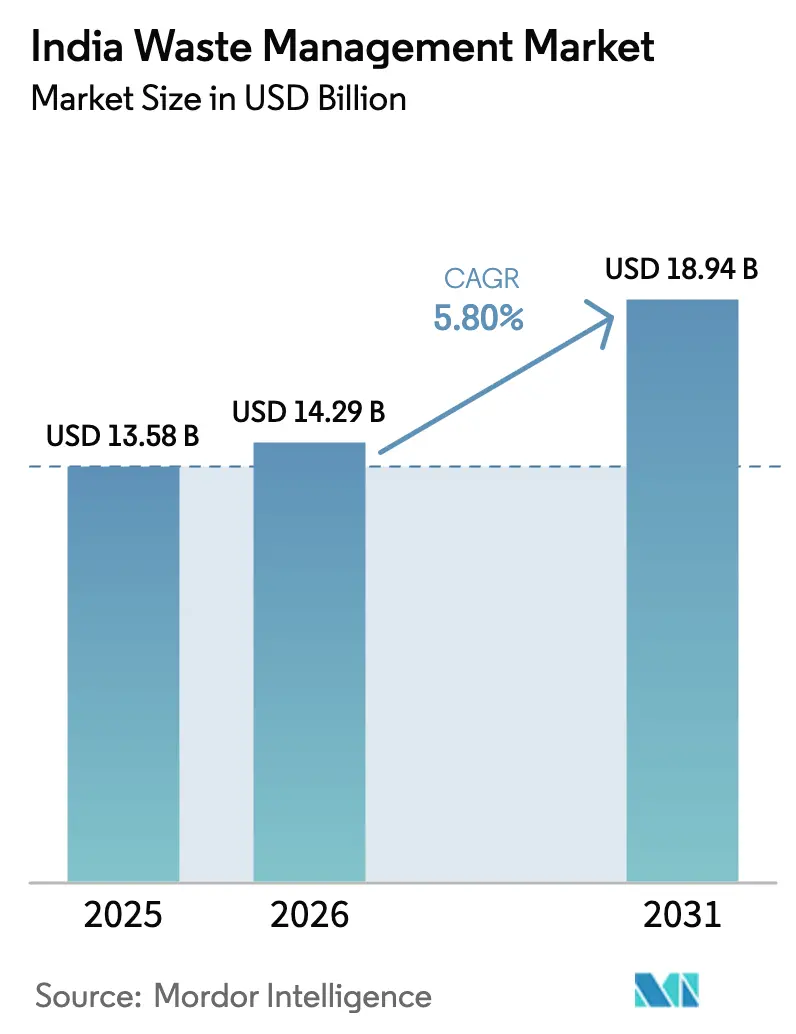
The India Waste Management Market size was valued at USD 13.58 billion in 2025 and is estimated to grow from USD 14.29 billion in 2026 to reach USD 18.94 billion by 2031, at a CAGR of 5.80% during the forecast period (2026-2031).
Strong regulatory pressure, sizable fiscal transfers to municipalities, and widening producer-responsibility mandates underpin this growth trajectory. Capital-expenditure grants released under the 15th Finance Commission are helping city governments mechanize collection fleets, while the Plastic Waste Management Amendment Rules 2024 and the National Circular Economy Framework 2025 oblige brand owners to hit hard recycling quotas[1]. Private operators are responding by shifting toward technology-enabled resource-recovery models that command higher gate fees and offtake prices. However, low source-segregation rates, litigation against waste-to-energy (WtE) plants, and volatile carbon-credit prices continue to squeeze margins and delay large-scale projects. The ability to lock in long-term municipal contracts, deploy automation at scale, and monetize secondary materials through extended-producer-responsibility (EPR) credits will ultimately decide winners across the India waste management market.
Key Report Takeaways
- By sources, the waste management market in India was led by residential waste, which accounted for 48.83% of 2025 revenue, while the commercial segment is projected to expand at an 8.6% CAGR through 2031.
- By service type, collection, transportation, sorting, and segregation held a 38.76% share in 2025; recycling and resource recovery are expected to rise at an 8.5% CAGR to 2031.
- By waste type, the waste management market in India was led by municipal solid waste, which held a 57.3% share in 2025, whereas e-waste is forecast to grow at a 7.4% CAGR during 2026-2031.
- By region, West India contributed 26.76% of 2025 revenue, and North India is set to register the fastest 6.5% CAGR through 2031.
Note: Market size and forecast figures in this report are generated using Mordor Intelligence’s proprietary estimation framework, updated with the latest available data and insights as of January 2026.
India Waste Management Market Trends and Insights
Drivers Impact Analysis*
| Drivers | (~) % Impact on CAGR Forecast | Geographic Relevance | Impact Timeline |
|---|---|---|---|
| 15th Finance Commission grants unlock INR 1.5 trn ULB capex for SWM 2025-26 | +1.3% | National, with higher disbursement in tier-1 and tier-2 cities | Short term (≤2 years) |
| National Circular Economy Framework 2025 mandates corporate recycling targets | +1.1% | National, with higher compliance in metros and industrial clusters | Long term (≥4 years) |
| Enforcement of Plastic Waste Management Amendment Rules 2024 & single-use plastic ban | +0.9% | National, with early enforcement in Maharashtra, Karnataka, Tamil Nadu | Medium term (2-4 years) |
| FAME-III battery EPR rules bring ~50 GWh end-of-life Li-ion by 2026 | +0.7% | National, concentrated in automotive hubs (Gujarat, Tamil Nadu, Haryana) | Short term (≤2 years) |
| Agri-biomass-to-bioCNG subsidies (SATAT 2.0) spur rural organic-waste valorization | +0.6% | North India (Punjab, Haryana, Uttar Pradesh), Maharashtra | Medium term (2-4 years) |
| Zero-e-waste commitments from hyperscale data-centers drive premium recycling contracts | +0.5% | National, with concentration in Hyderabad, Mumbai, Chennai, Bengaluru | Medium term (2-4 years) |
| Source: Mordor Intelligence | |||
15th Finance Commission Grants Unlock USD 18 billion for Municipal SWM
Disbursements covering collection vehicles, mechanized sweepers, and materials-recovery facilities are accelerating PPP bids in cities such as Mumbai, Delhi, and Indore[2]. Performance-linked conditions tied to segregation and landfill diversion are forcing municipalities to adopt digital monitoring. Land-acquisition delays capped first-year utilization at 58%, yet the grant program still contributes +1.3% to overall CAGR in the short term.
National Circular Economy Framework 2025 Mandates Corporate Recycling Targets
Companies with annual turnover above INR 500 crore must recycle at least 30% of packaging waste and 50% of electronic products by 2028, with even stricter 95% battery-mass recovery targets for vehicle manufacturers. Brand owners are increasingly entering multi-year offtake contracts with organized recyclers to hedge against virgin-resin price swings and to secure auditable compliance. Implementation success depends on certified capacity and timely penalties; nevertheless, the framework sets a clear compliance pathway and adds roughly +1.1% to sector CAGR over the forecast horizon.
Enforcement of Plastic Waste Management Amendment Rules 2024 & Single-Use-Plastic Ban
State pollution-control boards in Maharashtra, Karnataka, and Tamil Nadu began levying monetary penalties on non-compliant brand owners in 2025, funneling larger volumes of post-consumer plastic into formal channels. Recycled-content thresholds on PET bottles and polyolefin films have improved feedstock predictability for both mechanical and chemical recyclers. A standardized, quarterly EPR credit audit overseen by the Central Pollution Control Board is stimulating a secondary market for plastic-recycling certificates. Robust enforcement in metro areas is already nudging recycling rates upward, though rural districts still lag because of thin collection infrastructure. Over the medium term, more consistent policing and wider civic-awareness campaigns are expected to lift national recovery rates and support the +0.9% uplift to forecast CAGR.
FAME-III Battery EPR Rules Bring 50 GWh End-of-Life Li-ion by 2026
From April 2025, EV manufacturers must collect 90% of battery capacity within seven years of sale. Approximately 50 GWh of lithium-ion cells will retire by 2026, giving licensed recyclers such as Attero Recycling a large, high-value stream of nickel, cobalt, and lithium[3]. Vehicle OEMs have begun pilot take-back networks via dealerships. Fire-safety protocols and the absence of standardized pack design pose near-term bottlenecks, but the high intrinsic metal value supports profit margins and adds +0.7% to CAGR.
Restraints Impact Analysis*
| Restraints | (~) % Impact on CAGR Forecast | Geographic Relevance | Impact Timeline |
|---|---|---|---|
| Source-segregation average stuck below 35% | −0.8% | Nationwide, especially in tier-3 cities and rural areas | Long term (≥ 4 years) |
| NIMBY litigation halts 280 MW WtE capacity | −0.6% | Delhi NCR, Mumbai, Bengaluru | Medium term (2–4 years) |
| Ammonia-rich mixed food waste corrodes AD assets | −0.5% | Metro cities with high organic volumes | Medium term (2–4 years) |
| Carbon-credit slump (< INR 600/tCO₂e) | −0.4% | Cement corridors of Rajasthan, Madhya Pradesh, and Andhra Pradesh | Short term (≤ 2 years) |
| Source: Mordor Intelligence | |||
Source-Segregation Plateau
Mandatory household segregation into wet, dry, and hazardous waste categories remains largely aspirational, with the national rate stuck below 35% in 2025. Poor civic awareness, weak enforcement, and patchy door-to-door coverage degrade feedstock quality, slashing resale value for recyclables and raising contamination costs for composters. Pilot incentives such as property-tax rebates in Karnataka show localized success but have yet to scale nationally. Unless municipalities adopt real-time monitoring and levy penalties, the sub-optimal segregation will shave -0.8% off forecast CAGR.
NIMBY Litigation Against WtE Plants
Community lawsuits citing air-quality and siting concerns paused about 280 MW of proposed WtE capacity in 2025. Legal challenges extend project gestation by up to two years and elevate financing costs. A transparent emissions-monitoring regime and benefit-sharing with host communities are essential to close the policy-implementation gap; until then, the sector forfeits roughly -0.6% of growth potential.
*Our forecasts treat driver/restraint impacts as directional, not additive. The impact forecasts reflect baseline growth, mix effects, and variable interactions.
Segment Analysis
By Source: Commercial Waste Gains Momentum
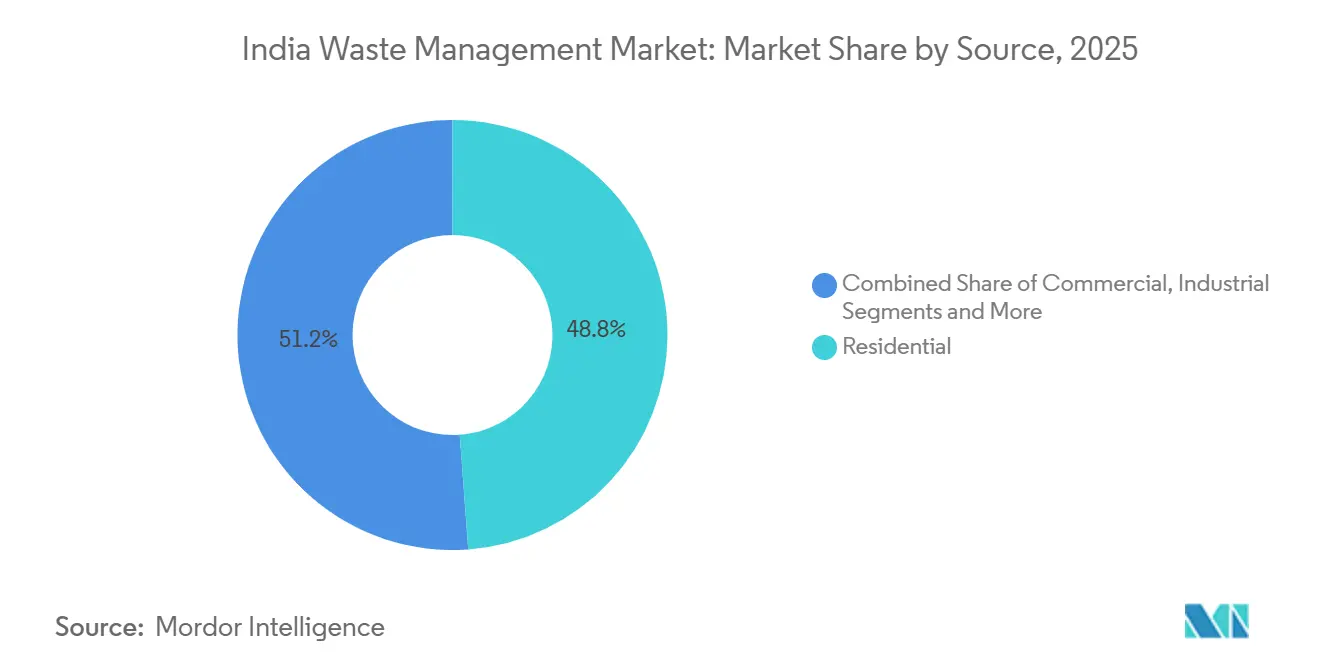
Residential sources accounted for 48.83% of India's waste management market revenue in 2025, although commercial volumes can eclipse residential volumes in many tier-1 business districts. Rising organized retail floor space and office complex densification in tier-2 cities are producing larger, more predictable waste streams. Commercial clients typically lock in multiyear service contracts at gate fees of USD 27 - 46 per tonne, compared with USD 10–15 for household waste, making this customer segment attractive to private operators. Collection routing is further optimized through RFID-tagged bins and GPS-enabled compactor trucks, cutting fuel cost and improving turnaround time. Aided by these dynamics, commercial waste volumes are estimated to grow at an 8.6% CAGR to 2031, outpacing the baseline expansion of residential streams.
Developers of shopping malls and business parks increasingly integrate on-site segregation rooms and balers, enhancing feedstock quality for downstream recyclers. Quick-commerce “dark stores” and last-mile delivery hubs are adopting closed-loop packaging, adding additional recyclable cardboard and plastics to formal networks. Operators such as Antony Waste Handling Cell expanded their commercial footprint by 28% in 2025, acquiring new contracts from large retail chains and corporate campuses, reinforcing revenue visibility. On balance, the commercial segment’s higher margin profile and contractual stickiness position it as the prime growth engine within the India waste management market.

By Service Type: Recycling & Resource Recovery Accelerates
In the waste management market in India, collection, transportation, sorting, and segregation held the largest revenue share at 38.76% in 2025, confirming the sector’s traditional focus on hauling fees. Yet recycling and resource recovery are forecast to clock an 8.5% CAGR, the fastest among service lines, driven by EPR credit monetization and higher commodity prices for recovered metals and plastics. Declining landfill availability is forcing municipalities to raise disposal tariffs, making diversion strategies financially compelling. At the same time, organized recyclers benefit from upgraded technology, such as AI-enabled optical sorters and robotic dismantlers, that elevate material purity and selling prices.
The India waste management market size generated by recycling and resource recovery for lithium-ion batteries alone is projected to more than triple between 2026 and 2031 as FAME-III EPR rules mature. Licensed recyclers like Attero have already demonstrated 98% metal-recovery yields, underscoring the value capture potential. Although incineration and WtE additions remain slow due to litigation, mechanical recycling and composting capacities are scaling across major states. Over the forecast horizon, operators able to blend high-quality aggregation with advanced processing are set to capture the steepest value uplift relative to purely hauling-focused peers.
By Waste Type: E-Waste Leads Future Upside
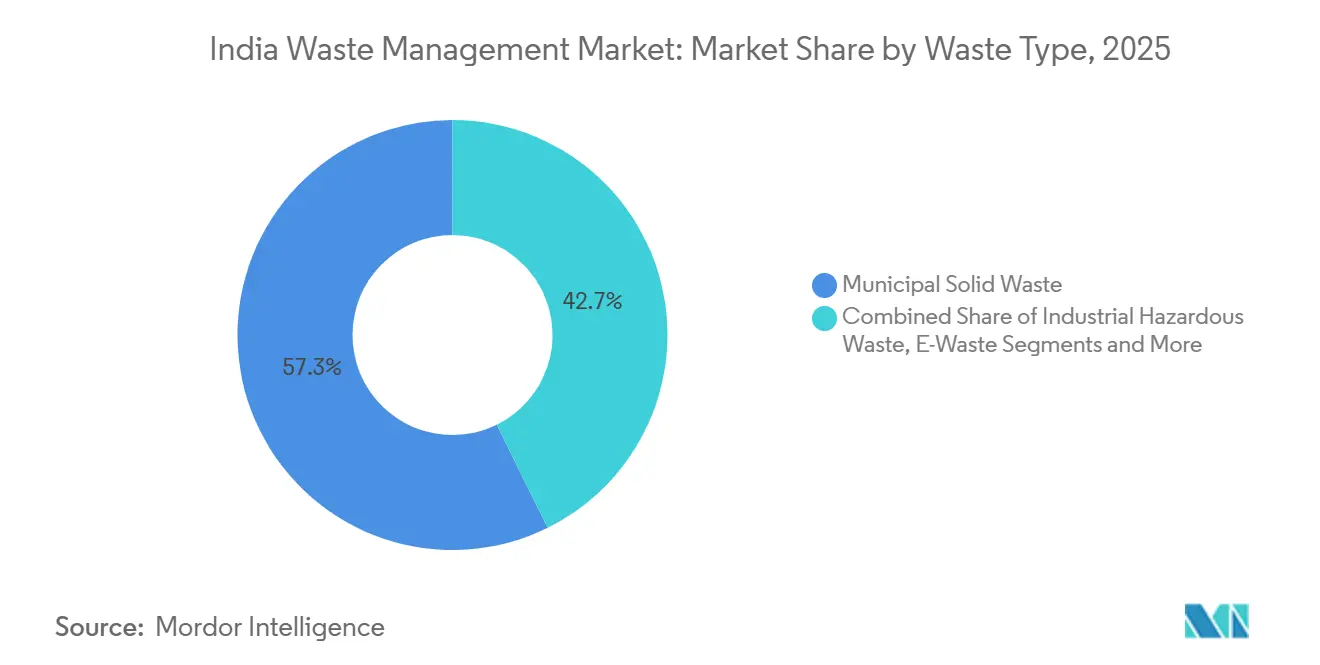
In the waste management industry in India, municipal solid waste dominated at 57.3% of 2025 revenues, yet e-waste represents the most rapid expansion path with a 7.4% CAGR forecast through 2031. India generated roughly 3.2 million tonnes of electronic scrap in 2025, but only 22% reached authorized recyclers, highlighting a vast untapped reservoir. Hyperscale data centers alone produced about 12,000 tonnes of server-grade scrap, which commands gate fees of USD 250–330 per tonne thanks to high precious-metal yields. Formal recyclers have begun installing automated shredders and pyrometallurgical lines to process these high-value streams at an industrial scale.
In parallel, the Plastic Waste Management Amendment Rules 2024 have shifted investor attention to polyolefin and PET recycling. State enforcement squads collected more than USD 5.6 million in penalties during 2025, further encouraging brands to source recycled resin. Construction-and-demolition waste remains underpenetrated, with less than 15% entering formal recycling channels despite regulatory mandates. However, ongoing urban infrastructure build-out is expected to tighten compliance, slowly bridging that gap. Overall, e-waste’s premium margins and regulatory tailwinds place it at the vanguard of future diversification within the India waste management market.
Geography Analysis
West India maintained the lead with 26.76% revenue in 2025, buoyed by Maharashtra and Gujarat’s mature public-private-partnership ecosystems and dense industrial clusters. Municipalities in Mumbai, Pune, and Nagpur awarded more than USD 287 million worth of design-build-operate contracts in 2025, accelerating the modernization of fleet and materials-recovery infrastructure. Source-segregation rates in Maharashtra’s tier-1 cities average 42%, compared with the 35% national benchmark, thanks to proactive civic campaigns and the early rollout of GPS-enabled collection vehicles. However, further growth is tempered by land scarcity for new processing sites.
North India is on track to register the fastest regional CAGR at 6.5% through 2031, energized by Delhi, Uttar Pradesh, and Punjab’s rapid build-out of composting plants and bio-CNG facilities under SATAT 2.0. Uttar Pradesh municipalities drew down USD 50 million in 2025 to procure compactor trucks and establish eight new materials-recovery centers. Punjab and Haryana account for a disproportionate share of new compressed-biogas registrations as rice-straw and wheat-residue valorization gains momentum. Although WtE projects in Delhi remain stuck at 58 MW due to litigation, three approved anaerobic-digestion plants totaling 300 tonnes per day are slated to be commissioned in 2027.
South India mirrors the national growth tempo, with Bengaluru and Hyderabad spearheading technology pilots such as AI-driven waste-segregation kiosks and blockchain-enabled EPR credit exchanges. Chennai’s expanded e-waste processing capacity is tapping into the region’s burgeoning data-center corridor. Conversely, East and Central India lag because of weak private-sector participation and sub-25% segregation rates. Carbon-credit volatility has also curbed refuse-derived-fuel uptake by cement producers in Madhya Pradesh and Chhattisgarh, limiting demand for thermal-treatment infrastructure.
Regulatory Landscape
India waste management regulation tightened with the Solid Waste Management Rules, 2026 notified by the Ministry of Environment, Forest and Climate Change (MoEFCC) and effective from 1 April 2026, superseding the 2016 framework. The rules formalize four-stream source segregation (wet, dry, sanitary, and special care), introduce quarterly progress reporting through a centralized online system, and broaden compliance obligations for bulk waste generators via registration and digital disclosure requirements.
Oversight and standard-setting continue to sit with the Central Pollution Control Board (CPCB) and State Pollution Control Boards (SPCBs), and implementation is increasingly anchored on portal-based monitoring and environmental compensation under polluter-pays constructs. The Environment (Construction and Demolition) Waste Management Rules, 2025 (effective 1 April 2026) also set stepped targets for managing C&D waste, which raises demand for compliant collection, processing, and audited reporting across cities and large generators.
Value Chain Analysis
India's waste management value chain starts with generation and primary handling by households, commercial establishments, and bulk waste generators, and then moves into collection and transportation anchored by Urban Local Bodies (ULBs) and their PPP contractors. Informal participants, including waste pickers and itinerant buyers, remain important for recovering dry recyclables through door-to-door collection and neighborhood aggregation. At the same time, formal operators increasingly take over organized collection routes, using GPS/RFID-enabled tracking and material aggregation from commercial clients.
Downstream value creation is concentrated in sorting and segregation (MRFs and baling), treatment and processing (composting, biomethanation/bio-CNG, recycling of plastics and metals, and specialized e-waste and battery lines), and final disposal. EPR-led traceability and CPCB portal-driven compliance are pushing more flows into registered facilities and increasing the role of digital platforms that verify quantities and quality for certificate and credit monetization. Key bottlenecks persist at source segregation, where contamination reduces processing yields, and in securing land, permits, and offtake contracts for integrated facilities, which shapes profitability across collection-heavy versus recovery-led business models.
Competitive Landscape
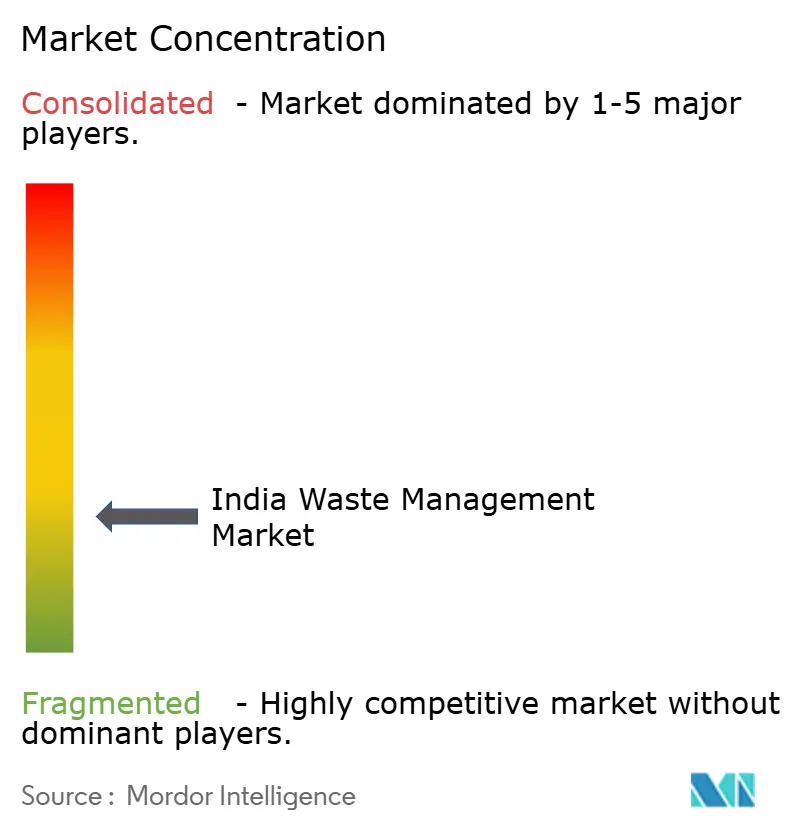
Competition remains fragmented; the top five operators controlled under 18% of total revenue in 2025. Listed incumbents such as Antony Waste Handling Cell and A2Z Green Waste Management leverage municipal concessions, public-market funding, and mechanized fleets to expand geographic reach. Meanwhile, specialized players like Attero and Exigo focus on high-margin verticals battery and e-waste recycling where technical barriers to entry and stringent licensing favor scale players. Digital-first aggregators, including Recykal and Saahas Zero Waste, differentiate through AI-powered sorting, real-time traceability, and EPR credit trading platforms that appeal to sustainability-oriented corporates.
Strategically, incumbents are bidding aggressively for long-duration design-build-operate contracts that ensure stable cash flow, while newcomers target niche streams such as hyperscale-data-center hardware, lithium-ion batteries, and agri-biomass bio-CNG. Intellectual-property filings are rising: Antony Waste applied for an RFID-based bin-tracking patent in 2025, and Recykal is scaling an AI recognition engine that boosts mixed-plastic sorting accuracy to 92%. Private-equity capital continues to flow, with Recykal closing a USD 22 million Series B round in 2025 to extend its digital marketplace to 180 cities.
White-space opportunities persist in construction-and-demolition recycling and rural organic-waste aggregation, both still dominated by informal handlers. Execution risks - land acquisition, regulatory approvals, and skilled labor - remain the major differentiators. Operators capable of combining concession management expertise with advanced processing technology are best positioned to consolidate share as regulatory scrutiny intensifies across the India waste management market.
India Waste Management Industry Leaders
-
A2Z Green Waste Management Ltd
-
Antony Waste Handling Cell Ltd
-
Attero Recycling Pvt Ltd
-
BVG India Ltd
-
Cerebra Integrated Technologies Ltd
- *Disclaimer: Major Players sorted in no particular order
Market Opportunities and Future Outlook
The April 2026 shift to the Solid Waste Management Rules, 2026 creates near-term whitespace in compliance-led services, including bulk waste generator registration, quarterly digital reporting, auditable segregation systems, and performance monitoring tied to CPCB-aligned portals. That, in turn, supports opportunities for technology-enabled operators and service providers that can bundle collection with verified sorting outcomes, especially for commercial clients that already sign multi-year contracts and need defensible documentation for EPR and municipal compliance.
Municipal remediation and integrated infrastructure programs are also building an investable pipeline, particularly around legacy dumpsites, decentralized wet-waste processing, and integrated solid waste management complexes that combine biomining, MRFs, and energy or compost outputs. Large municipal biomining initiatives and government-backed project financing for waste-to-energy and remediation capacity are visible demand drivers for EPC plus O&M capabilities, emissions monitoring, and secure offtake structures. High-value recycling streams, including e-waste and lithium-ion batteries, continue to present an active opportunity set under tightening EPR regimes, favoring players with licensed capacity, safe logistics, and high-recovery processing lines.
Recent Industry Developments
- June 2026: Antony Waste Handling Cell Limited reported FY26 operational performance with municipal solid waste managed reaching 5.69 million tonnes, up 15% year-over-year. The scale figure strengthens its positioning in long-duration municipal concessions where throughput and operational KPIs influence renewals, pricing, and eligibility for larger integrated tenders.
- December 2025: Antony Waste Handling Cell Limited received major municipal awards in Maharashtra, including two Brihanmumbai Municipal Corporation collection and transportation contracts (about INR 1,330 crore for seven years) and a Thane Municipal Corporation pre-processing waste management contract (about INR 330 crore for 10 years). These wins expand long-tenor revenue visibility and deepen its footprint in collection plus pre-processing, a pathway toward higher diversion-linked economics.
- August 2025: Antony Waste Handling Cell Limited announced receipt of two waste-to-energy plant development contracts for 15 MW each in Kadapa and Kurnool, Andhra Pradesh, from NREDCAP. The awards signal municipal and state agency interest in adding thermal treatment capacity alongside conventional hauling, while also increasing the importance of permitting, emissions compliance, and project-execution capabilities for operators.
Research Methodology Framework and Report Scope
Market Definition and Coverage
This market covers organized waste management services in India, starting from collection and transport through sorting, treatment, recycling or resource recovery, and final disposal. Values reflect service revenues generated across key waste streams handled by municipal and commercial operators.
Scope exclusions: Informal and unpaid handling that is not recorded in service revenues (including self disposal and unreported scrap trade) is excluded from the market value.
Segmentation Overview
-
By Source
- Residential
- Commercial (retail, office, etc.)
- Industrial
- Medical (Health and Pharmaceutical)
- Construction & Demolition
- Others (institutional, agricultural, etc)
-
By Service Type
- Collection, Transportation, Sorting & Segregation
-
Disposal / Treatment
- Landfill
- Recycling & Resource Recovery
- Incineration & Waste-to-Energy
- Others (Chemical Treatment, Composting, etc.)
- Others (Consulting, Audit & Training, etc.)
-
By Waste Type
- Municipal Solid Waste
- Industrial Hazardous Waste
- E-waste
- Plastic Waste
- Biomedical Waste
- Construction & Demolition Waste
- Agricultural Waste
- Other Specialized Waste (radio active, etc)
-
By Region
- North India
- South India
- West India
- East India
- Central India
Data Sources, Market Sizing, and Validation
Desk Research
Desk work starts with getting the boundaries right for India, because waste data is often reported by tonnage, but the market is valued in service revenue. We refer to public sources such as CPCB reports and rule notifications, Ministry of Housing and Urban Affairs dashboards for municipal waste, and state pollution control board updates for treatment capacity and compliance signals. To ground industrial and special waste streams, we also use official publications from MoEFCC, selected peer reviewed studies on waste composition, and port and customs trade statistics for scrap and recyclables where it helps explain material flows.
We then layer in company annual reports, investor decks, and credible press releases to understand service mix, pricing direction, and plant additions. For cross checks, we selectively use paid subscriptions for company financials and intelligence, a patent database for technology shifts, and an import export shipment level database to validate material movement in key categories. These references are illustrative only, and many other public and paid sources were used for data collection, validation, and research clarification.
Primary Interviews and Surveys
Primary work is used to test what desk sources cannot confirm cleanly, especially how service contracts are priced and how much waste is actually handled by organized players versus informal routes. We speak with operators, ULB linked stakeholders, recyclers, and large waste generators across major regions, then align the inputs with the service chain, from collection and transport through recycling, waste to energy, and landfill operations.
Distribution of primary research fieldwork respondents
| Company type | Respondent position |
|---|---|
| Top tier: 33% | CXOs: 16% |
| Mid tier: 51% | Functional/Unit leaders: 31% |
| Smaller Players: 16% | Managers: 53% |
Market-Sizing & Forecasting
The core model uses a top-down approach where waste generation and collection metrics are converted into an addressable handled waste pool, and this pool is then linked to service type shares and average pricing to reconstruct value for India. To keep it practical, we anchor the demand side on indicators such as municipal solid waste collection coverage, per capita waste generation trends, treatment and landfill capacity additions, and commissioning timelines for recycling and waste to energy projects. We also track enforcement and compliance signals that affect formalization, such as rule driven segregation requirements and consent to operate activity, because these change how much volume moves into paid services.
Results are corroborated with selective bottom-up approximations, such as rolling up a sample of operator revenues, checking ULB tender values and contract durations, and validating average price per ton ranges for collection, transport, processing, and disposal. When the bottom-up checks show gaps (for example, smaller city contracts or underreported informal diversion), we adjust using conservative capture ratios that were validated through interviews. For forecasting, we rely on scenario analysis supported by trend regression on key drivers like urban population growth, budgeted municipal spending, project pipeline conversion rates, and expected shifts toward recycling and resource recovery.
Data Validation & Update Cycle
Validation is done in several passes so the market totals stay consistent with real world signals. We compare outputs against independent checks such as reported waste handled volumes, known capacity utilization ranges, and the observed pace of new facility additions, then investigate any large variances before the numbers are finalized. If an assumption moves the total too sharply, the related inputs are revisited, and when needed, experts are re contacted to confirm the change.
Reports are refreshed annually, and interim updates are made when there is a material policy change, a major project commissioning wave, or a visible shift in tender activity. Before delivery, we do a final sweep of recent public releases and data updates so clients receive the latest view that can be traced back to clear inputs.
Mordor Intelligence's India Waste Management Market Size Compared With Other Published Estimates
Published market values for India waste management do not always match, because the boundary between total waste services and only solid waste services is not treated the same way. Differences also come from how firms handle the informal portion of recycling, what is counted as service revenue versus project capex, and how fast price per ton is assumed to move with fuel, labor, and compliance costs.
ULB tender values, CPCB handling and capacity signals, and operator revenue disclosures are the evidence points that keep Mordor Intelligence tied to paid service activity, which is why the estimate can differ when other publications lean more on broad waste generation totals or narrower solid waste only coverage. Forecast spreads also show up when a publisher assumes faster formalization or more aggressive waste to energy ramp ups without checking commissioning and utilization timelines.
Benchmark comparison
| Source | Market Size | Gaps in Research Methodology |
|---|---|---|
| Mordor Intelligence | USD 13.58 B (2025) | |
| Industry Advisory A | USD 13.56 B (2025) | Uses a similar India wide scope, but the disclosed framing leans more on segment shares and policy narrative, with less transparency on how informal diversion and service price per ton are normalized across cities. |
| Sector Publisher B | USD 13.00 B (2025) | Focused on solid waste management, which can exclude parts of special waste streams and related services, thereby producing a smaller 2025 value even if collection and disposal assumptions are strong. |
The table shows that small numeric gaps often come from scope choices first, and then from how pricing and formal capture are treated. When the handled waste pool, service mix, and price logic are kept explicit and are cross checked against tenders and capacity realities, the final number stays easier to audit and repeat year after year for planning.
Key Questions Answered in the Report
What is the current value of India’s waste management market?
The market is valued at USD 14.29 billion in 2026 and is set to reach USD 18.94 billion by 2031.
Which waste stream is growing the fastest?
E-waste is forecast to expand at a 7.4% CAGR through 2031, driven by data-center and consumer electronics disposal.
Why are recycling and resource-recovery services gaining momentum?
Higher margins from EPR credits and valuable recovered materials, combined with rising landfill costs, are steering investment toward recycling.
Which region offers the strongest growth outlook?
North India is projected to rise at a 6.5% CAGR, supported by new composting and bio-CNG plants under SATAT 2.0.
How fragmented is the competitive landscape?
The top five players account for under 18% of revenue, indicating a highly fragmented market with ample room for consolidation.