Market Overview
| Study Period | 2020 - 2031 |
|---|---|
| Forecast Data Period | 2026 - 2031 |
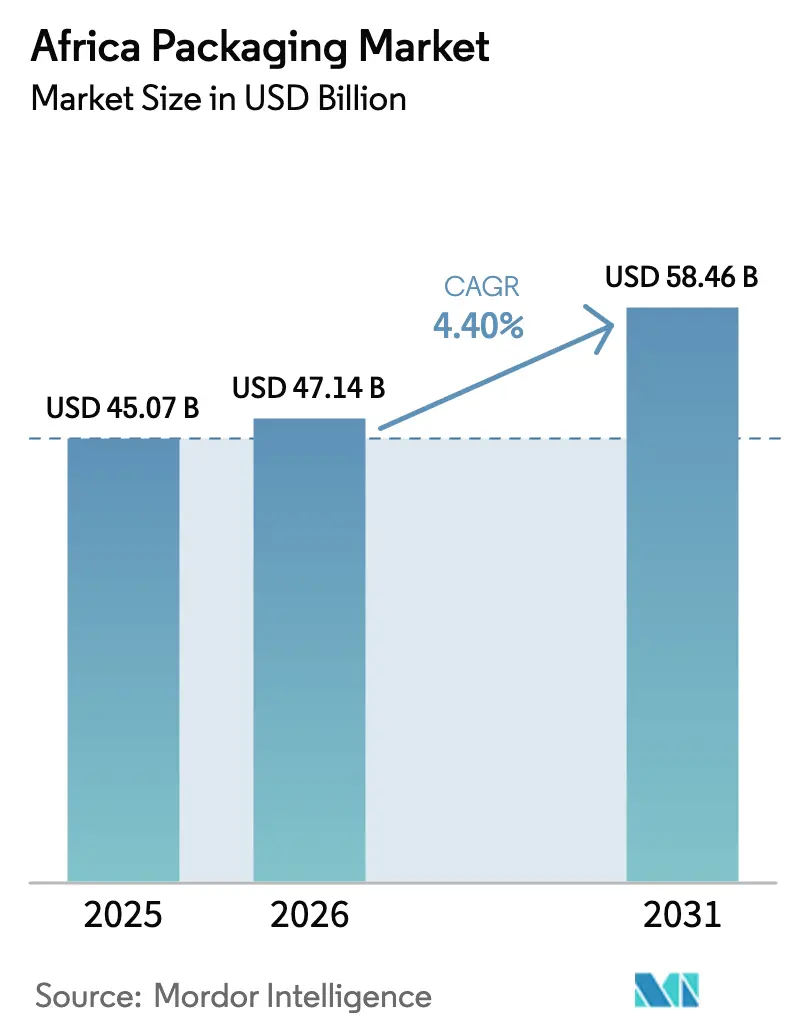
| Base Year Market Size (2025) | USD 45.07 Billion |
| Market Size (2026) | USD 47.14 Billion |
| Market Size (2031) | USD 58.46 Billion |
| Growth Rate (2026 - 2031) | 4.40% CAGR |
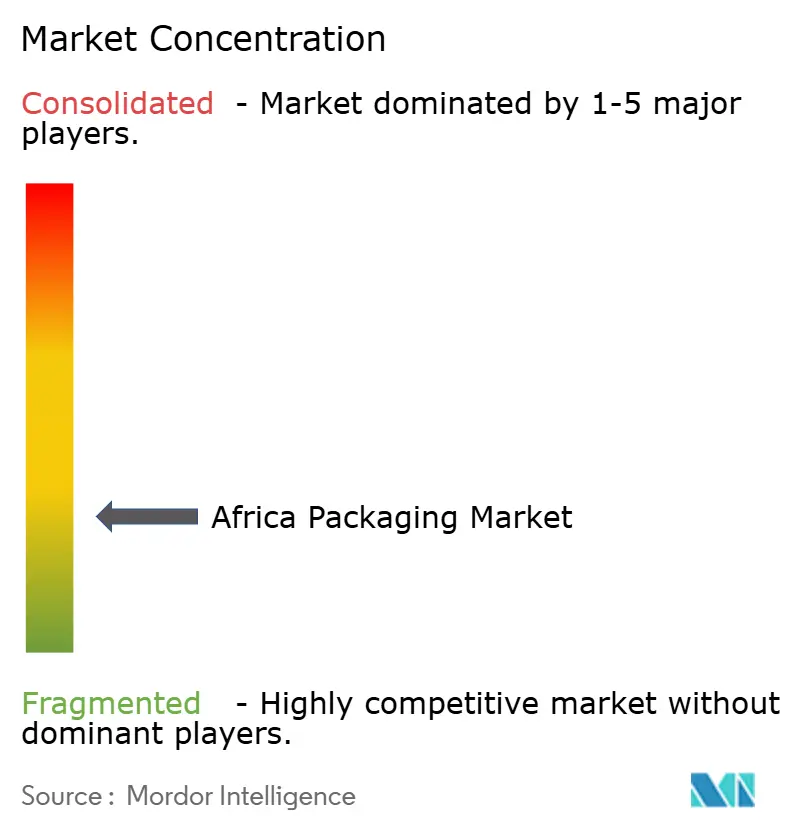
| Market Concentration | Low |
Major Players *Disclaimer: Major Players sorted in no particular order Image © Mordor Intelligence. Reuse requires attribution under CC BY 4.0. | |
Africa Packaging Market Analysis by Mordor Intelligence
The Africa packaging market size is expected to grow from USD 45.07 billion in 2025 to USD 47.14 billion in 2026 and is forecast to reach USD 58.46 billion by 2031 at a 4.4% CAGR over 2026-2031. Converters that can balance resin-price volatility, power-supply disruptions, and port bottlenecks with rising demand from e-commerce, urban FMCG consumption, and sustainability mandates are best placed to capture this expansion. Plastic formats still dominate, yet regulatory pressure is shifting brand owners toward mono-material and biodegradable solutions that meet Extended Producer Responsibility targets. Flexible films and stand-up pouches are gaining share because they reduce logistics costs and fit price-sensitive portion sizes demanded by the growing urban middle class. East Africa is set to outpace Southern Africa on the back of horticultural and pharmaceutical exports, while Nigeria and Egypt remain volume anchors but lag in growth as infrastructure gaps persist. Competitive intensity is moderate, with the top ten players controlling roughly half of revenue; technology adoption around digital presses and inline quality inspection is emerging as a key differentiator.
Key Report Takeaways
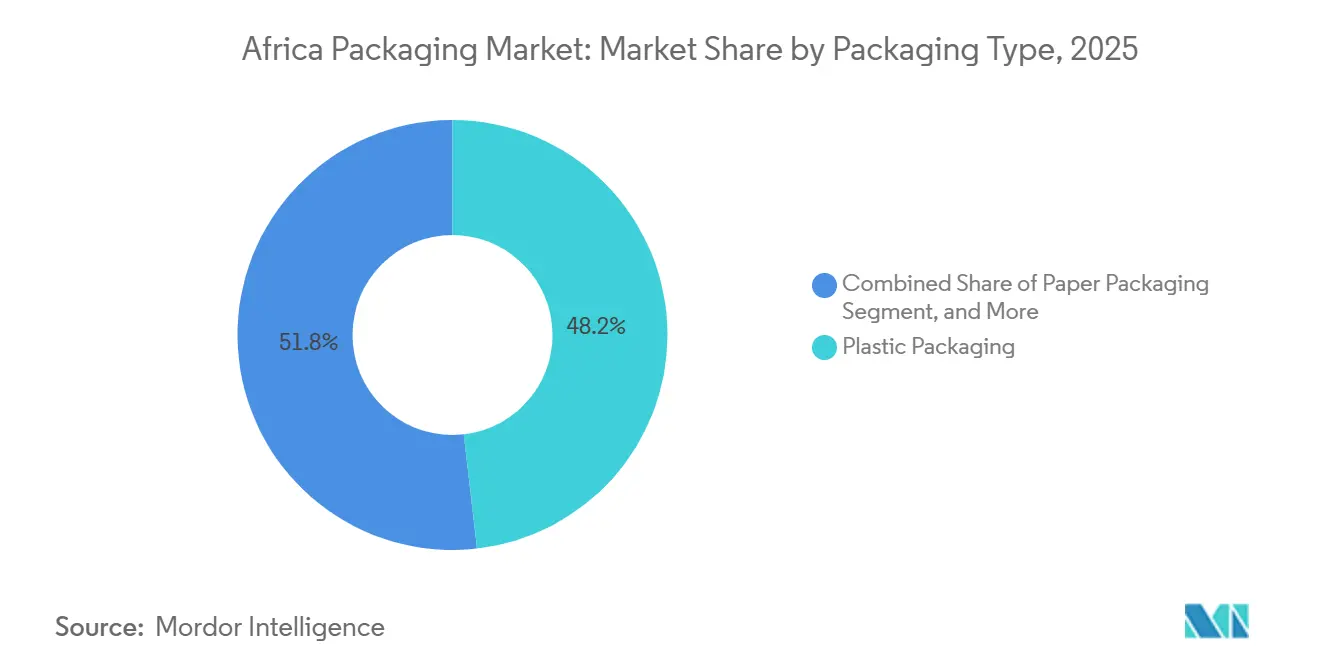
- By packaging type, plastic accounted for 48.19% of Africa packaging market share in 2025; biodegradable substrates are projected to expand at a 4.91% CAGR through 2031.
- By packaging format, rigid solutions held 61.53% of revenue in 2025, while flexible formats are advancing at a 5.23% CAGR to 2031.
- By end-use industry, food applications commanded 37.28% of demand in 2025, whereas e-commerce parcels are on track for a 4.95% CAGR over the forecast horizon.
- By geography, Southern Africa led with 34.61% revenue share in 2025; East Africa is expected to record the highest regional CAGR at 5.11% to 2031.
Note: Market size and forecast figures in this report are generated using Mordor Intelligence’s proprietary estimation framework, updated with the latest available data and insights as of January 2026.
Africa Packaging Market Trends and Insights
Drivers Impact Analysis
| Driver | (~) % Impact on CAGR Forecast | Geographic Relevance | Impact Timeline |
|---|---|---|---|
| Growing Urban Middle Class Boosting FMCG Consumption | +0.90% | Nigeria, Kenya, Egypt, South Africa | Medium term (2-4 years) |
| E-commerce Packaging Demand Surge | +0.70% | South Africa, Kenya, Nigeria, Egypt | Short term (≤ 2 years) |
| Expansion of Modern Retail Chains Across Africa | +0.60% | Southern Africa, East Africa, West Africa | Medium term (2-4 years) |
| Government Bans on Single-Use Plastics Driving Alternative Materials | +0.80% | Kenya, Rwanda, South Africa, Tanzania | Long term (≥ 4 years) |
| Rise of Cold-Chain Logistics for Fresh-Produce Exports | +0.50% | Kenya, South Africa, Ethiopia, Morocco | Medium term (2-4 years) |
| AfCFTA Trade Corridors Spurring Demand for Returnable Transit Packaging | +0.40% | Pan-African, with early gains in East African Community and SADC | Long term (≥ 4 years) |
| Source: Mordor Intelligence | |||
Growing Urban Middle Class Boosting FMCG Consumption
Rapid urban migration is concentrating purchasing power in cities, driving demand for portion-controlled sachets and stand-up pouches that match lower per-transaction spending limits.[1]United Nations Department of Economic and Social Affairs, “World Urbanization Prospects 2024 Revision,” un.org Multinationals are localizing production to cut logistics costs and respond faster to city-level taste shifts, as evidenced by Unilever’s USD 85 million flexible-pack line commissioned in Lagos in 2024.[2]Unilever, “Annual Report and Accounts 2024,” unilever.com Mini-supermarket expansion in peri-urban areas is accelerating the switch from bulk to pre-packaged goods, with sachets accounting for up to 50% of unit sales in Nigeria and Kenya. Rising disposable incomes are encouraging premium pack upgrades such as aseptic cartons, yet affordability considerations mean pack-size innovation remains the principal growth lever. The demographic dividend therefore underpins steady baseline demand that tempers cyclical stocks in commodity-linked segments.
E-commerce Packaging Demand Surge
Online retail’s share of South African sales reached 7.2% in 2025, while Kenya’s e-commerce value rose 18% year on year, reshaping corrugated-box specifications for rapid fulfilment and cross-border shipping.[3]Unilever, “Annual Report and Accounts 2024,” unilever.com Jumia’s new fulfilment centers across West and East Africa added 120,000 m² of warehouse space and drove requirements for digitally printed boxes with tamper-evident features. Platforms are setting recycled-content thresholds, prompting converters to invest in recovered-fiber supply and digital corrugators capable of short runs. Social-commerce growth is boosting demand for branded mailers and padded envelopes, an underserved niche that expanded 22% in 2025. Absence of uniform waste regulations poses a risk of landfill levies but also a service opportunity for converters offering take-back schemes.
Government Bans on Single-Use Plastics Driving Alternative Materials
Kenya’s 2024 EPR rules require 80% collection of plastic packaging by 2028, leading Coca-Cola Beverages Africa to fund a 15,000-ton rPET plant in Nairobi.[4]National Environment Management Authority, “Extended Producer Responsibility Regulations 2024,” nema.go.ke South Africa’s phased restrictions and Rwanda’s long-standing bag ban form a patchwork that forces multinationals to maintain multiple SKU portfolios, raising complexity and capex needs. Folding-carton and liquid-paperboard demand is climbing as quick-service restaurants and dairy brands shift from disposable plastics. Biopolymer uptake remains below 2% of flexible-film tonnage due to a 30-50% price premium and limited composting capacity, yet pilot community hubs in Kenya point to a scalable model once collection logistics mature. Regulatory certainty is accelerating investment decisions in alternative substrates.
Rise of Cold-Chain Logistics for Fresh-Produce Exports
Kenya shipped 176,000 t of cut flowers and 89,000 t of vegetables in 2025, relying on insulated corrugated boxes that maintain 2 °C to 8 °C during 12-hour airfreight windows. South Africa’s 2.8-million-ton citrus season uses modified-atmosphere liners for 3- to 4-week sea voyages to Asia. The African Development Bank’s USD 1.2 billion cold-chain initiative expanded refrigerated warehousing by 35%, spurring demand for pallet wraps and data-logging labels. Ethiopia’s 19% growth in cut-flower exports is drawing corrugated-box capacity near Addis Ababa airport to reduce lead times. Pharmaceutical cold-chain programs are adopting WHO-certified containers, widening the application base for high-value insulated formats.
Restraints Impact Analysis
| Restraint | (~) % Impact on CAGR Forecast | Geographic Relevance | Impact Timeline |
|---|---|---|---|
| Volatile Polymer and Paper-Pulp Prices | -0.60% | Pan-African, acute in import-dependent markets | Short term (≤ 2 years) |
| Power-Supply Instability Increasing Plant OPEX | -0.50% | South Africa, Nigeria, Ghana, Zimbabwe | Medium term (2-4 years) |
| Port Congestion Delaying Raw-Material Inflows | -0.30% | Nigeria (Lagos), Kenya (Mombasa), Tanzania (Dar es Salaam) | Short term (≤ 2 years) |
| Inadequate Recycling Infrastructure Limiting rPET Uptake | -0.20% | Sub-Saharan Africa excluding South Africa | Long term (≥ 4 years) |
| Source: Mordor Intelligence | |||
Volatile Polymer and Paper-Pulp Prices
Polyethylene prices in South Africa oscillated between ZAR 18,500 and ZAR 24,200 t⁻¹ in 2024-2025, shrinking converter margins by up to 12%. With 70% of sub-Saharan resin imported, freight-rate swings and forex shifts have direct P&L impact, illustrated by a six-week supply delay after Red Sea disruptions in late 2024. Paper-pulp costs climbed 11% in 2025 as global supply tightened, compelling box makers to import kraft liner at an 18% premium. Limited hedging tools in African financial hubs expose small converters to spot-price shocks, reinforcing a flight to scale and vertical integration.
Power-Supply Instability Increasing Plant OPEX
Stage-4 to Stage-6 load-shedding hit South African plants for 185 days in 2025, forcing reliance on diesel generators that cost up to ZAR 6.00 kWh⁻¹ triple grid rates raising energy expense 12-18%. Nigerian converters self-generate up to 80% of power needs, adding USD 0.12 kg⁻¹ to flexible-film costs. High OPEX deters capex-heavy processes such as blown-film extrusion and pushes investment toward digital flexography. Renewable projects reduce grid exposure but require steep upfront capital and face regulatory uncertainty around wheeling tariffs, limiting scale for smaller firms.
Segment Analysis
By Packaging Type: Plastic Dominance Meets Biodegradable Momentum
Plastic formats supplied 48.19% of Africa packaging market revenue in 2025, underpinned by polyethylene for shopping bags and dairy sachets, PET for beverages and polypropylene for hot-fill applications, yet biodegradable alternatives are projected to grow at 4.91% CAGR as single-use bans tighten. South Africa’s 68% PET recycling rate, the highest on the continent, exemplifies how deposit-return schemes can sustain polymer use within circular models. Biodegradable take-up remains constrained by limited composting hubs that handle only a fraction of projected PLA tonnage, yet pilot programs suggest scalable pathways once collection matures. Paper claimed 28% share in 2025, buoyed by corrugated demand from e-commerce and folding cartons for dry foods, while glass and metal retained niche positions in premium beverages and on-premises consumption.
Rigid plastics such as PET bottles and HDPE containers dominate volume but rely on capital-intensive blow-moulding lines that favour incumbents, restraining rapid format shifts. Flexible plastics, led by stand-up pouches, are growing faster because they cut material usage by up to 40% and fit portion-size requirements in urban informal retail. Brand owners are piloting mono-material laminates that meet recyclability mandates, yet barrier-performance trade-offs limit adoption for moisture-sensitive snacks. Kraft-liner shortages in 2025 drove corrugated producers to increase recycled-fiber ratios to 85%, raising strength concerns in humid climates.
Note: Segment shares of all individual segments available upon report purchase
Get Detailed Market Forecasts at the Most Granular Levels
Download PDF
By Packaging Format: Rigid’s Scale Versus Flexible’s Agility
Rigid formats accounted for 61.53% of the Africa packaging market in 2025, powered by entrenched beverage, glass and corrugated lines with high switching costs. Corrugated boxes remain indispensable for e-commerce and agricultural exports, but their 3.8% growth lags flexible films as brand owners chase logistics savings. Large converters like Nampak and Consol enjoy scale advantages, yet asset intensity limits innovation speed compared with agile, flexible players.
Flexible packaging is set for 5.23% CAGR through 2031, propelled by stand-up pouches and high-clarity films that suit urban purchasing patterns. Lower tooling costs enable converters to service fragmented FMCG portfolios efficiently, although multi-layer structures face recyclability headwinds under new EPR rules. Mono-material polyethylene pouches coupled with metallized coatings offer a compliance path, but require reformulated inks and adhesives, stretching smaller firms’ balance sheets.
By End-Use Industry: Food’s Anchor and E-commerce’s Surge
Food applications represented 37.28% of revenue in 2025, driven by maize-meal bags, dairy sachets and fresh-produce packaging. Urban middle-class premiumization is lifting demand for aseptic cartons and high-barrier films, while mass segments remain price-led, favouring polyethylene sachets. Beverage packaging, concentrated in PET water bottles and glass beer containers, follows with a 22% share, while aseptic juice cartons are gaining ground in school-feeding programs.
E-commerce is the fastest-growing end-use, poised for a 4.95% CAGR, as personalized unboxing drives the adoption of digitally printed corrugated boxes and branded mailers. Pharmaceutical packaging is benefitting from vaccine cold-chain investments, supporting demand for temperature-monitoring labels and blister packs compliant with WHO standards. Personal care premiumization spurs uptake of airless pumps and glass jars, though growth remains modest in comparison to food and online retail.

Note: Segment shares of all individual segments available upon report purchase
Get Detailed Market Forecasts at the Most Granular Levels
Download PDF
Geography Analysis
Southern Africa held 34.61% of the Africa packaging market in 2025, leveraging integrated polymer, paper and glass supply chains around South Africa, yet growth is capped at 3.7% CAGR by chronic load-shedding, rising diesel costs and stiff import competition. Botswana and Namibia provide niche demand linked to diamonds and seafood, whereas Zimbabwe and Mozambique remain hampered by macro instability.
East Africa is projected to lead regional expansion at 5.11% CAGR, buoyed by Kenya’s horticultural exports and Ethiopia’s pharmaceutical clusters. Kenya’s 2024 EPR framework is catalysing rPET capacity investments and accelerating migration to mono-material flexible packaging. Ethiopia’s 19% growth in cut-flower exports and Tanzania’s nascent modern retail footprint offer white-space opportunities for corrugated and flexible converters.
West Africa, anchored by Nigeria’s 220 million consumers, confronts high logistics costs from port congestion and self-generation of electricity, which add up to USD 0.12 kg⁻¹ to film production. Despite these hurdles, sachet culture sustains resilient demand for low-cost flexible packaging. Egypt benefits from natural-gas subsidies and re-export links into the Middle East, yet currency volatility and machinery import restrictions temper investment sentiment. The rest of Africa, including Morocco and Ghana, will track a 4.2% CAGR supported by AfCFTA trade facilitation and cold-chain rollouts.
Competitive Landscape
Approximately 45-50% of Africa packaging market revenue resides with the top ten players, indicating moderate concentration. Multinationals such as Amcor, Mondi and Tetra Pak differentiate through barrier-film know-how and aseptic-carton technology, winning share in regulated dairy and pharma segments. Mondi’s 2025 launch of recyclable pet-food pouches underscores how substrate innovation aligned with recyclability can unlock premium categories.
Local incumbents Nampak, Mpact and Consol retain strong customer intimacy but battle elevated energy costs and tightening balance sheets: Nampak’s USD 245 million beverage-can divestiture in 2025 illustrates strategic retrenchment toward core liquid cartons and flexible films. Regional specialists like East African Packaging Industries grew corrugated capacity 25% in 2025 to serve Jumia, while Astrapak’s digital presses target short-run e-commerce packaging.
Investment themes revolve around automation that offsets labour inflation and power disruptions. Mpact’s inline vision systems cut waste by 8% in 2024, and Consol’s solar arrays lowered grid dependence 30%, boosting ESG credentials. Market white spaces include compostable quick-service food packaging, returnable transit containers for AfCFTA corridors and tamper-evident pouches for generic pharmaceuticals.
Africa Packaging Industry Leaders
Nampak Limited
Mondi Group
Mpact Ltd
Foster Packaging International (Pty) Ltd
Astrapak Ltd (RPC Packaging Holdings Ltd)
- *Disclaimer: Major Players sorted in no particular order
Need More Details on Market Players and Competitors?
Download PDF
Recent Industry Developments
- July 2025: Coca-Cola Beverages Africa invested R365 million (USD 20.3 million) in a high-speed bottling line in Midrand, South Africa, capable of producing 72,000 bottles per hour.
- May 2025: Kenya’s Extended Producer Responsibility regulations took effect, obligating producers to register with NEMA and finance end-of-life management for packaging.
- January 2025: Geely Auto opened its CKD plant in Giza, Egypt, with 30,000-unit annual capacity for Emgrand and Coolray models.
- December 2024: Sonoco completed its USD 3.9 billion acquisition of Eviosys, creating the world’s largest metal food-can platform.
Africa Packaging Market Report Scope
The Africa Packaging Market Report is Segmented by Packaging Type (Plastic, Paper, Container Glass, Metal Cans), Packaging Format (Rigid, Flexible), End-Use Industry (Food, Beverage, Pharmaceuticals, Personal Care, Industrial, E-commerce), and Geography (Egypt, Nigeria, Kenya, South Africa, Rest of Africa). The Market Forecasts are Provided in Terms of Value (USD).
By Packaging Type
| Plastic Packaging | Rigid Plastic Packaging | By Material Type | Polyethylene (PE) |
| Polypropylene (PP) | |||
| Polyethylene Terephthalate (PET) | |||
| Polyvinyl Chloride (PVC) | |||
| Polystyrene (PS) and Expanded PS | |||
| Other Material Types | |||
| By Product Type | Bottles and Jars | ||
| Caps and Closures | |||
| Trays and Containers | |||
| Other Product Types | |||
| By End-use Industry | Food | ||
| Beverage | |||
| Pharmaceutical | |||
| Cosmetics and Personal Care | |||
| Industrial | |||
| Other End-use Industry | |||
| Flexible Plastic Packaging | By Material Type | Polyethylene (PE) | |
| Biaxially Oriented Polypropylene (BOPP) | |||
| Cast Polypropylene (CPP) | |||
| Other Material Types | |||
| By Product Type | Pouches and Bags | ||
| Films and Wraps | |||
| Other Product Types | |||
| By End-use Industry | Food | ||
| Beverage | |||
| Pharmaceutical | |||
| Cosmetics and Personal Care | |||
| Industrial | |||
| Other End-use Industry | |||
| Paper Packaging | By Product Type | Folding Carton | |
| Corrugated Boxes | |||
| Liquid Paperboard | |||
| Other Product Type | |||
| By End-use Industry | Food | ||
| Beverage | |||
| E-commerce | |||
| Other End-use Industry | |||
| Container Glass | By Color | Green | |
| Amber | |||
| Flint | |||
| Other Colors | |||
| By End-use Industry | Food | ||
| Alcoholic | |||
| Non-Alcoholic | |||
| Personal Care and Cosmetics | |||
| Pharmaceuticals (Excl. Vials and Ampoules) | |||
| Perfumery | |||
| Metal Cans and Containers | By Material Type | Steel | |
| Aluminum | |||
| By Product Type | Cans | ||
| Drums and Barrels | |||
| Caps and Closures | |||
| Other Product Type | |||
| By End-use Industry | Food | ||
| Beverage | |||
| Chemicals and Petroleum | |||
| Industrial | |||
| Paints and Coatings | |||
| Other End-use Industry | |||
By Packaging Format
| Rigid |
| Flexible |
By End-Use Industry
| Food |
| Beverage |
| Pharmaceuticals and Healthcare |
| Personal Care and Cosmetics |
| Industrial |
| E-commerce |
| Other End-use Industry |
By Country
| Egypt |
| Nigeria |
| Kenya |
| South Africa |
| Rest of Africa |
| By Packaging Type | Plastic Packaging | Rigid Plastic Packaging | By Material Type | Polyethylene (PE) |
| Polypropylene (PP) | ||||
| Polyethylene Terephthalate (PET) | ||||
| Polyvinyl Chloride (PVC) | ||||
| Polystyrene (PS) and Expanded PS | ||||
| Other Material Types | ||||
| By Product Type | Bottles and Jars | |||
| Caps and Closures | ||||
| Trays and Containers | ||||
| Other Product Types | ||||
| By End-use Industry | Food | |||
| Beverage | ||||
| Pharmaceutical | ||||
| Cosmetics and Personal Care | ||||
| Industrial | ||||
| Other End-use Industry | ||||
| Flexible Plastic Packaging | By Material Type | Polyethylene (PE) | ||
| Biaxially Oriented Polypropylene (BOPP) | ||||
| Cast Polypropylene (CPP) | ||||
| Other Material Types | ||||
| By Product Type | Pouches and Bags | |||
| Films and Wraps | ||||
| Other Product Types | ||||
| By End-use Industry | Food | |||
| Beverage | ||||
| Pharmaceutical | ||||
| Cosmetics and Personal Care | ||||
| Industrial | ||||
| Other End-use Industry | ||||
| Paper Packaging | By Product Type | Folding Carton | ||
| Corrugated Boxes | ||||
| Liquid Paperboard | ||||
| Other Product Type | ||||
| By End-use Industry | Food | |||
| Beverage | ||||
| E-commerce | ||||
| Other End-use Industry | ||||
| Container Glass | By Color | Green | ||
| Amber | ||||
| Flint | ||||
| Other Colors | ||||
| By End-use Industry | Food | |||
| Alcoholic | ||||
| Non-Alcoholic | ||||
| Personal Care and Cosmetics | ||||
| Pharmaceuticals (Excl. Vials and Ampoules) | ||||
| Perfumery | ||||
| Metal Cans and Containers | By Material Type | Steel | ||
| Aluminum | ||||
| By Product Type | Cans | |||
| Drums and Barrels | ||||
| Caps and Closures | ||||
| Other Product Type | ||||
| By End-use Industry | Food | |||
| Beverage | ||||
| Chemicals and Petroleum | ||||
| Industrial | ||||
| Paints and Coatings | ||||
| Other End-use Industry | ||||
| By Packaging Format | Rigid | |||
| Flexible | ||||
| By End-Use Industry | Food | |||
| Beverage | ||||
| Pharmaceuticals and Healthcare | ||||
| Personal Care and Cosmetics | ||||
| Industrial | ||||
| E-commerce | ||||
| Other End-use Industry | ||||
| By Country | Egypt | |||
| Nigeria | ||||
| Kenya | ||||
| South Africa | ||||
| Rest of Africa | ||||
Need A Different Region or Segment?
Customize Now
Key Questions Answered in the Report
What is the current value of the Africa packaging market?
It stood at USD 47.14 billion in 2026 and is projected to reach USD 58.46 billion by 2031.
Which segment is growing fastest within Africa's packaging landscape?
Flexible packaging, particularly stand-up pouches, is forecast to post a 5.23% CAGR through 2031.
How are single-use plastic bans affecting packaging choices?
Regulations in Kenya, Rwanda and South Africa are accelerating a shift toward paper, mono-material films and biodegradable substrates.
Why is East Africa the fastest-growing region?
Strong horticultural exports, expanding pharmaceutical clusters and supportive EPR regulations push the region toward a 5.11% CAGR.
What role does e-commerce play in packaging demand?
Online retail growth is lifting demand for digitally printed corrugated boxes and branded mailers, with e-commerce packaging set for a 4.95% CAGR.
How severe is the impact of power instability on converters?
Load-shedding in South Africa and unreliable grids in Nigeria raise energy costs 12-18%, compelling firms to invest in generators and renewables.


