Market Overview
| Study Period | 2017 - 2030 |
|---|---|
| Base Year For Estimation | 2024 |
| Forecast Data Period | 2025 - 2030 |
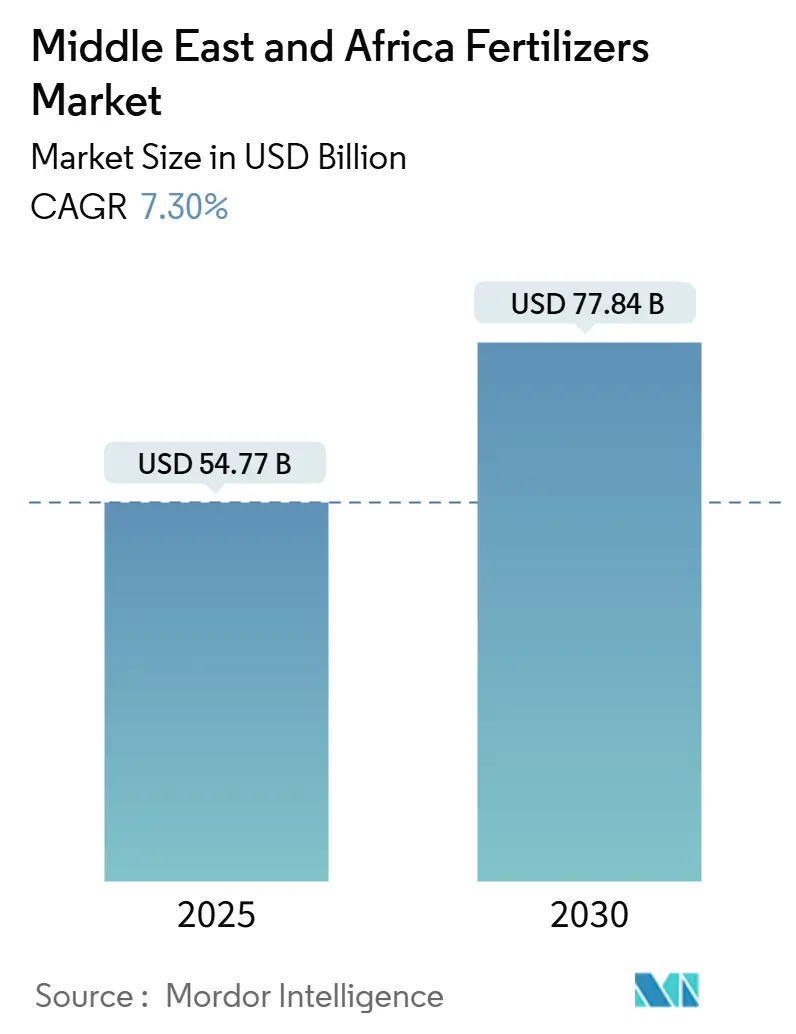
| Market Size (2025) | USD 54.77 Billion |
| Market Size (2030) | USD 77.84 Billion |
| Growth Rate (2025 - 2030) | 7.30% CAGR |
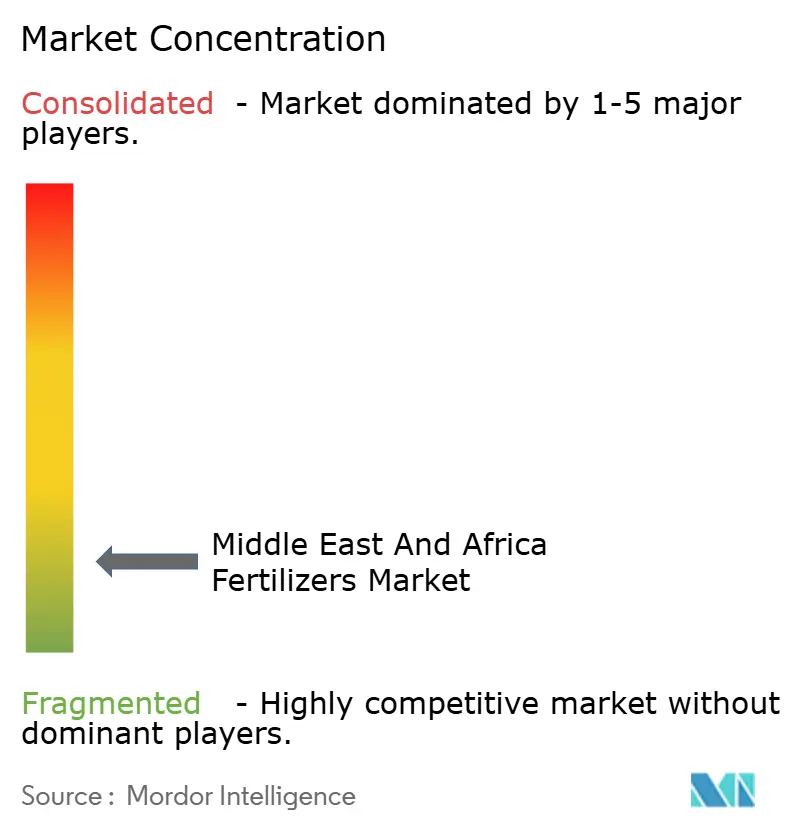
| Market Concentration | Low |
Major Players*Disclaimer: Major Players sorted in no particular order Image © Mordor Intelligence. Reuse requires attribution under CC BY 4.0. |
|
Middle East And Africa Fertilizers Market Analysis by Mordor Intelligence
The Middle East and Africa fertilizers market size stands at USD 54.77 billion in 2025 and is projected to climb to USD 77.84 billion by 2030, advancing at a CAGR of 7.30%. Robust government subsidy programs, expansion of domestic production capacity, and fast-rising investments in irrigation infrastructure form the backbone of this growth path. Stronger food-security mandates are spurring import-substitution projects, while water-scarcity challenges are accelerating the shift toward specialty products that improve nutrient-use efficiency. Supply-chain realignment, including new port corridors and local blending sites, is lowering delivery times and fostering just-in-time distribution models. At the same time, freight-rate volatility and natural gas price swings compel producers to hedge energy exposure through integrated ammonia facilities linked to subsidized feedstock.
Key Report Takeaways
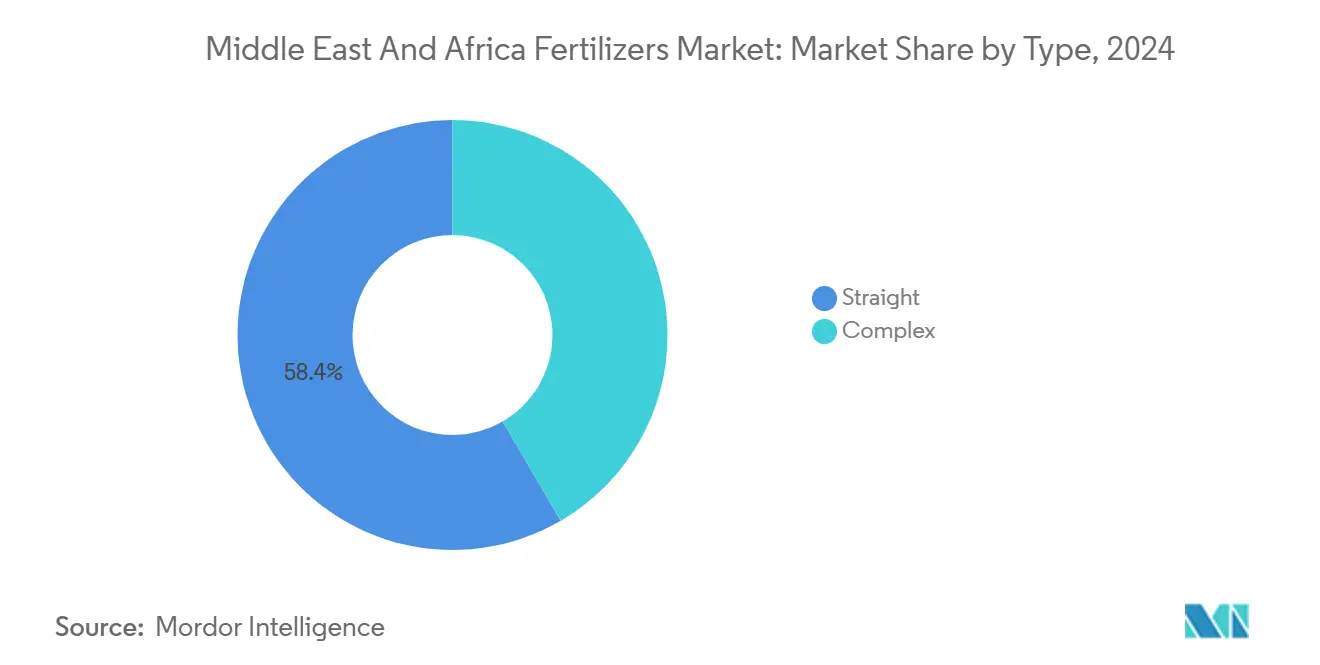
- By type, straight fertilizers captured 58.4% of the Middle East and Africa fertilizers market share in 2024 and are projected to advance at an 8.4% CAGR through 2030.
- By form, conventional fertilizers held a 90.9% share of the Middle East and Africa fertilizers market in 2024, while registering a 7.3% CAGR over the same horizon.
- By application mode, soil application accounted for 91.2% of the Middle East and Africa fertilizers market size in 2024 and is projected to grow at a 7.3% CAGR to 2030.
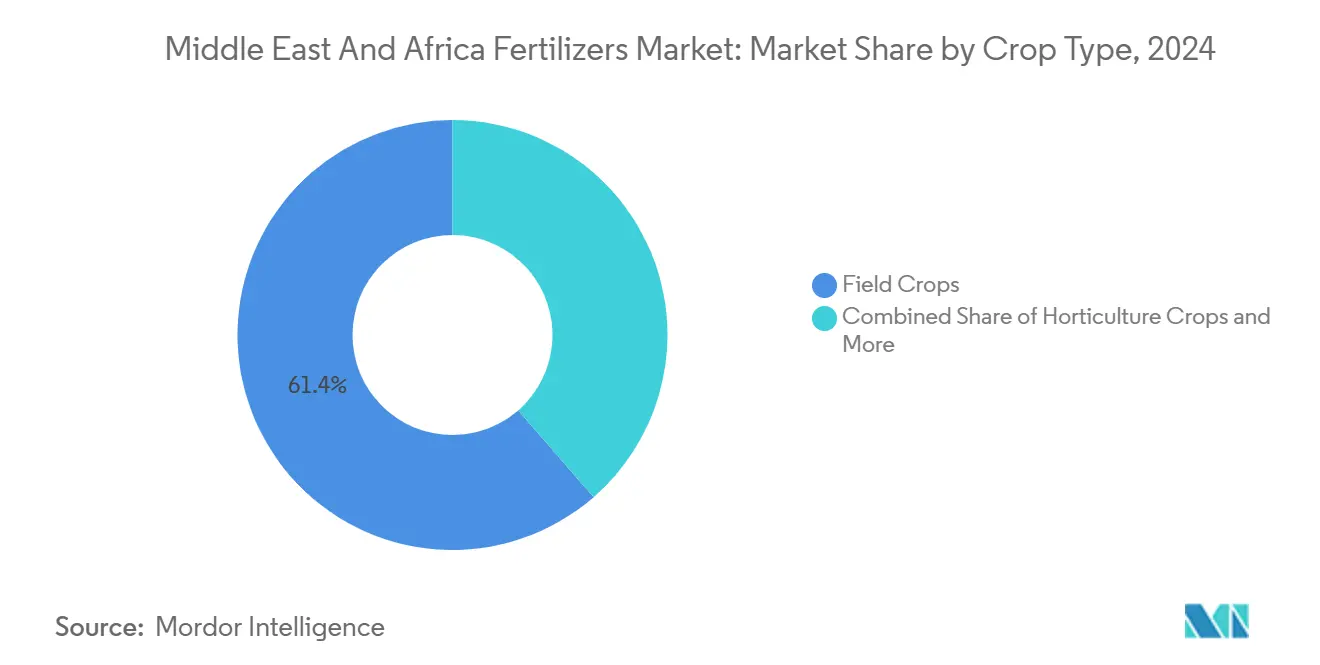
- By crop type, field crops commanded 61.4% of consumption in 2024, and the horticultural crops are expanding at an 8.4% CAGR through 2030.
- By geography, Nigeria led with an 11.5% share of the Middle East and Africa fertilizers market in 2024, while Turkey is forecast to expand at a 6.8% CAGR through 2030.
Middle East And Africa Fertilizers Market Trends and Insights
Drivers Impact Analysis
| Driver | (~) % Impact on CAGR Forecast | Geographic Relevance | Impact Timeline |
|---|---|---|---|
| Rising regional food security initiatives | +0.9% | Core Middle East and Africa with spillover to North Africa | Medium term (2-4 years) |
| Expansion of government fertilizer subsidy programs | +0.7% | Saudi Arabia, Egypt, Nigeria, extending to other markets | Short term (≤ 2 years) |
| Increasing adoption of specialty and slow-release fertilizers | +0.6% | Gulf Cooperation Council, widening to North and East Africa | Long term (≥ 4 years) |
| Rising investments in modern irrigation systems | +0.5% | Early gains in Saudi Arabia, United Arab Emirates, South Africa | Medium term (2-4 years) |
| Shift toward sulfur-enriched blends for oil-seed crop rotations | +0.4% | Sudan and Ethiopia, moving into West Africa | Medium term (2-4 years) |
| Growing use of desalinated water driving demand for micronutrients | +0.3% | Gulf Cooperation Council and coastal North Africa | Long term (≥ 4 years) |
| Source: Mordor Intelligence | |||
Rising Regional Food Security Initiatives
Middle East and African governments are tying fertilizer self-sufficiency directly to food sovereignty. Saudi Arabia earmarked USD 1.2 billion for import-substitution projects in 2024, targeting integrated ammonia and urea complexes that reduce external dependence[1]Source: State Information Service, “Irrigation modernization under National Water Strategy,” sis.gov.eg. Nigeria’s Presidential Fertilizer Initiative set a goal to trim fertilizer imports by 50% by 2027, leveraging new capacity at Dangote facilities. Ethiopia partnered with a private investor to build a USD 2.5 billion urea plant that will tap domestic gas reserves, bringing 3 million metric tons annual line online within 40 months. Sub-Saharan Africa currently imports roughly 80% of its fertilizer, so each new plant sends a positive signal to lenders and multinational equipment suppliers. These projects also catalyze ancillary investments in gas pipelines, rail spurs, and bulk terminals that knit the regional supply chain together.
Expansion of Government Fertilizer Subsidy Programs
National treasuries view subsidies as a fast-acting lever to stabilize input costs and rural incomes. Egypt raised its subsidy pool by 35% in 2024, cutting farmer urea prices to USD 180 per metric ton against international quotes above USD 350 per metric ton. Kenya’s program reached 1.2 million smallholders, slashing input costs by up to 50% through mobile vouchers that link soil-test prescriptions to verified dealer outlets. Nigeria distributed 12 million bags of subsidized NPK blends in 2024 and combined the roll-out with e-wallet payments that curb leakages. Saudi Arabia covers 75% of the landed cost of micronutrient packages for date-palm growers, prompting a surge in precision nutrition adoption on arid plots. Predictable offtake allows blenders to lock in feedstock contracts and plan inventory turns in advance.
Increasing Adoption of Specialty and Slow-Release Fertilizers
Water scarcity is forcing growers to wring more yield out of every drop. Greenhouse operators in the United Arab Emirates expanded controlled-release fertilizer use by 45% in 2024, cutting water needs by up to 40% without yield loss[2]Source: World Bank, “The Deepening Red Sea Shipping Crisis,” worldbank.org . Morocco’s OCP is investing USD 3.2 billion in hybrid hubs that integrate renewable power and Industry 5.0 automation to supply nine million metric tons of specialty grades by 2028. Saudi megaprojects such as NEOM design cropping systems around slow-release granules, achieving nutrient-use efficiencies above 85% versus regional norms near 50%. Premium product lines command 20-30% price mark-ups yet remain cost-effective once water savings and quality premiums are tallied.
Rising Investments in Modern Irrigation Systems
Drip and center-pivot conversions are scaling fast. Saudi Arabia earmarked USD 20 billion for irrigation upgrades to 2030, converting more than 200,000 hectares in 2024 into fertigation-ready plots[3]Source: State Information Service, “Abu Qir Fertilizers efficiency agreements,” sis.gov.eg . Egypt’s smart irrigation zone added 50,000 hectares equipped with sensors that raise application precision by 60%. Ethiopia expects to irrigate 1.5 million hectares upon completion of its main dam, lifting demand for water-soluble fertilizers tailored to virgin soils. Morocco’s bank-financed localized irrigation scheme converted 300,000 hectares in 2024, boosting fertilizer efficiency by 40%. These shifts favor fully dissolving products, sparking new service models where distributors bundle software, soluble nutrients, and agronomy support.
Restraints Impact Analysis
| Restraint | (~) % Impact on CAGR Forecast | Geographic Relevance | Impact Timeline |
|---|---|---|---|
| Volatile natural gas linked ammonia prices | -1.4% | Global, acute for import-dependent African markets | Short term (≤ 2 years) |
| Persistent logistical bottlenecks at key Red Sea ports | -0.6% | Core Middle East and Africa trade lanes, heavy in East Africa | Short term (≤ 2 years) |
| Regulatory pushback on cadmium levels in imported phosphates | -0.4% | Morocco and Tunisia export to Egypt and South Africa | Medium term (2-4 years) |
| Rising farmer preference for biologicals in high-value crops | -0.3% | High-value horticulture zones in South Africa, Morocco, and Turkey | Long term (≥ 4 years) |
| Source: Mordor Intelligence | |||
Volatile Natural Gas Linked Ammonia Prices
Energy represents roughly three-quarters of ammonia production cost, so swings in gas prices ripple straight into urea quotations. The European Union shuttered up to 70% of its capacity at the height of the 2022 gas spike, forcing African buyers to absorb freight premiums and longer lead times. Kenya experienced retail fertilizer prices that climbed 150% between 2020 and 2022, denting staple-crop yields among the smallholders who supply most domestic food. Importers now diversify suppliers and use longer-tenor gas contracts, yet risk remains elevated whenever benchmark gas trade tightens.
Persistent Logistical Bottlenecks at Key Red Sea Ports
Security disruptions in the Red Sea corridor cut Suez Canal traffic by about 75% in 2024. Bulk freight rates on Shanghai-to-Mediterranean routes more than doubled, while voyages diverted around the Cape added 45% to sailing time and close to half a million barrels of extra bunker fuel per round trip. Fertilizer vessels faced war-risk insurance surcharges that eroded distributor margins. Gulf export hubs compensated by pushing greater volumes through emerging ports such as Lamu in Kenya, where a maiden 60,000 metric tons shipment from Morocco was discharged in May 2025. The bottlenecks accelerated investments in rail links and inland depots meant to shorten onward haulage within East Africa.
Segment Analysis
By Type: Straight Fertilizers Dominate Volume
Straight formulations accounted for 58.4% of the Middle East and Africa fertilizers market share in 2024 and are projected to post an 8.4% CAGR through 2030. Government programs tend to subsidize basic NPK components, making single-nutrient grades the default choice among smallholders. Urea leads nitrogen sales for cereal production systems, whereas DAP and MAP remain the principal phosphatic products. The Middle East and Africa fertilizers market size for straight grades benefits from standardized distribution and storage systems that favor bulk handling.
Complex fertilizers play a vital role in horticulture, irrigated cash crops, and export-oriented farms that require precise nutrient ratios. Morocco’s capacity expansion under the SP2M plan will lift blended output across North Africa, offering site-specific formulations that pair macronutrients with micronutrient packages. Uptake is strongest where soil-testing mandates exist, such as in South Africa, or where lenders tie credit to agronomic prescriptions.
Note: Segment shares of all individual segments available upon report purchase
Get Detailed Market Forecasts at the Most Granular Levels
Download PDF
By Form: Conventional Products Retain Market Leadership
Conventional granules captured 90.9% of the Middle East and Africa fertilizers market in 2024 and are growing at a 7.3% CAGR. Broad familiarity, robust supply chains, and equipment compatibility underpin their dominance. Producers are investing in energy-saving revamps, like Egypt’s Abu Qir natural-gas-efficiency upgrade, to keep cost curves competitive.
Specialty grades controlled-release, water-soluble, and foliar liquids occupy a small yet fast-rising niche. Drip-irrigated acreage expansion in Gulf greenhouses and the spread of hydroponics in Turkish horticulture fuel demand for fully soluble products. Slow-release coatings appeal to remote growers with limited labor, reducing application frequency and nutrient loss in sandy soils.
By Application Mode: Soil Application Remains Predominant
Soil placement methods held a 91.2% share in 2024, aligned with mechanized broadcasting and incorporation practices on field crops, and are growing at a 7.3% CAGR to 2030. Seed-drill integration improves placement accuracy, trimming wastage, and lowering per-hectare rates. The Middle East and Africa fertilizers market size allocated to soil methods parallels mechanization upgrades across Sudan and Ethiopia, where import duties on spreaders were reduced.
Fertigation is the standout growth pocket, enabled by the rapid build-out of drip and pivot systems. Nutrient solutions fed through irrigation lines deliver near-instant uptake and dovetail with automated scheduling platforms. Foliar spraying, though smaller in tonnage, gives producers a tool for mid-season micronutrient correction, particularly under alkaline soil conditions common in desalinated water zones.
By Crop Type: Field Crops Anchor Demand
Field crops absorbed 61.4% of regional fertilizer consumption in 2024. Wheat, maize, and rice are central to food-security agendas, drawing heavy nitrogen programs. Oilseed expansion in Sudan and cotton production in Egypt intensify phosphorus and potassium pull-through. Yield-oriented government schemes, such as Nigeria’s anchor-borrower model route, subsidized bags directly to staple-crop acreage.
Horticultural crops grow the fastest at 8.4% CAGR as export-driven citrus, grape, and greenhouse vegetable operations scale up. Protected cultivation acreage in the Gulf region extends the production season and commands year-round inputs. Perennial tree crops such as date palm require tailored blends high in potassium and micronutrients, while turf and ornamentals for tourism landscapes create a small but premium urban niche.
Note: Segment shares of all individual segments available upon report purchase
Get Detailed Market Forecasts at the Most Granular Levels
Download PDF
Geography Analysis
Nigeria anchors the regional landscape, holding 11.5% of the Middle East and Africa fertilizers market share in 2024. Expanding domestic capacity continues to displace imports, while cashless subsidy disbursements raise small-holder uptake. Strong governmental backing and the scaling of export contracts position Nigeria to deepen its influence across West Africa, creating steady demand for urea and blended NPK grades that match varied soil profiles.
Turkey registers the fastest forward momentum at a 6.8% CAGR from 2025 to 2030. Greenhouse expansion along the Mediterranean rim drives specialty fertilizer adoption, and Anatolian cereal belts sustain bulk urea and DAP offtake. Policy incentives for protected cultivation, combined with modern irrigation roll-outs, reinforce Turkey’s status as the region’s growth engine for water-soluble and controlled-release formulations.
South Africa, Saudi Arabia, and the rest of the Middle East and Africa collectively supply the balance of demand. South African growers continue to lead in precision-soil testing and variable-rate spreading, while Saudi Arabia leverages subsidized gas feedstock to underpin cost-competitive exports. Diverse agro-ecological zones across Morocco, Ethiopia, Egypt, and Sudan foster localized blending strategies that align nutrient mixes with crop and soil specificity, sustaining the broader expansion of the Middle East and Africa fertilizers market.
Competitive Landscape
The Middle East and Africa fertilizers market is highly fragmented, with the five largest players holding only 7.92% combined share. Yara International leads with a 3.47% share through a flexible production and downstream distribution model that reallocates volumes quickly when trade routes shift. SABIC Agri-Nutrients follows at 2.51%, bolstered by integrated petrochemical assets and long-term gas contracts that shield margins.
Dangote Group is scaling regional influence with a USD 2.5 billion Ethiopian complex that will push combined African urea capacity beyond nine million metric tons on completion. Morocco’s OCP is deepening vertical integration by pairing renewable energy and digital twin technology in its SP2M expansion. Local blenders such as Golden Fertilizer Company specialize in soil-specific blends, carving niche shares through proximity to smallholder clusters.
Strategic playbooks feature cost-curve optimization, specialty product development, and last-mile advisory services. Producers aim to embed agronomic guidance with every metric ton sold, fostering stickiness in highly competitive rural markets. Consolidation opportunities are ripe as smaller independents grapple with working-capital strains caused by volatile freight and gas-feedstock costs.
Middle East And Africa Fertilizers Industry Leaders
-
Golden Fertilizer Company Limited
-
ICL Group Ltd
-
K+S Aktiengesellschaft
-
SABIC Agri-Nutrients Co.
-
Yara International ASA
- *Disclaimer: Major Players sorted in no particular order
Need More Details on Market Players and Competitors?
Download PDF
Recent Industry Developments
- January 2025: Algeria completed the 82-hectare Annaba mineral dock designed to expedite phosphate and fertilizer exports into Mediterranean markets.
- February 2025: Kenya’s Port of Lamu discharged its first 60,000 metric tons of bulk fertilizer cargo bound for Ethiopia, demonstrating the viability of the LAPSSET trade corridor.
- March 2025: Morocco’s OCP Nutricrops announced a plan to add nine million metric tons of capacity through new Msqala and Mzindda hubs targeting specialty grades.
Middle East And Africa Fertilizers Market Report Scope
Fertilizers are substances added to soil or plants to provide essential nutrients that promote growth and increase crop yield. The Middle East and Africa Fertilizers Market Report is segmented by type, including complex and straight; by form, including conventional and specialty; by application mode, including fertigation, foliar, and soil; by crop type, including field crops, horticultural crops, and turf and ornamental; and by geography, including Nigeria, Saudi Arabia, South Africa, Turkey, and the rest of the Middle East and Africa. The market forecasts are provided in terms of value (USD) and volume (metric tons).
Type
| Complex | ||
| Straight | Micronutrients | Boron |
| Copper | ||
| Iron | ||
| Manganese | ||
| Molybdenum | ||
| Zinc | ||
| Others | ||
| Nitrogenous | Ammonium Nitrate | |
| Urea | ||
| Others | ||
| Phosphatic | Diammonium Phosphate (DAP) | |
| Monoammonium Phosphate (MAP) | ||
| Single Super Phosphate (SSP) | ||
| Triple Super Phosphate (TSP) | ||
| Others | ||
| Potassic | Muriate of Potash (MoP) | |
| Sulfate of Potash (SoP) | ||
| Others | ||
| Secondary Macronutrients | Calcium | |
| Magnesium | ||
| Sulfur | ||
Form
| Conventional | |
| Specialty | Controlled Release Fertilizer (CRF) |
| Liquid Fertilizer | |
| Slow Release Fertilizer (SRF) | |
| Water Soluble |
Application Mode
| Fertigation |
| Foliar |
| Soil |
Crop Type
| Field Crops |
| Horticultural Crops |
| Turf and Ornamental |
Geography
| Nigeria |
| Saudi Arabia |
| South Africa |
| Turkey |
| Rest of Middle East and Africa |
| Type | Complex | ||
| Straight | Micronutrients | Boron | |
| Copper | |||
| Iron | |||
| Manganese | |||
| Molybdenum | |||
| Zinc | |||
| Others | |||
| Nitrogenous | Ammonium Nitrate | ||
| Urea | |||
| Others | |||
| Phosphatic | Diammonium Phosphate (DAP) | ||
| Monoammonium Phosphate (MAP) | |||
| Single Super Phosphate (SSP) | |||
| Triple Super Phosphate (TSP) | |||
| Others | |||
| Potassic | Muriate of Potash (MoP) | ||
| Sulfate of Potash (SoP) | |||
| Others | |||
| Secondary Macronutrients | Calcium | ||
| Magnesium | |||
| Sulfur | |||
| Form | Conventional | ||
| Specialty | Controlled Release Fertilizer (CRF) | ||
| Liquid Fertilizer | |||
| Slow Release Fertilizer (SRF) | |||
| Water Soluble | |||
| Application Mode | Fertigation | ||
| Foliar | |||
| Soil | |||
| Crop Type | Field Crops | ||
| Horticultural Crops | |||
| Turf and Ornamental | |||
| Geography | Nigeria | ||
| Saudi Arabia | |||
| South Africa | |||
| Turkey | |||
| Rest of Middle East and Africa | |||
Need A Different Region or Segment?
Customize Now
Market Definition
- MARKET ESTIMATION LEVEL - Market Estimations for various types of fertilizers has been done at the product-level and not at the nutrient-level.
- NUTRIENT TYPES COVERED - Primary Nutrients: N, P and K, Secondary Macronutrients: Ca, Mg and S, Micronutients: Zn, Mn, Cu, Fe, Mo, B, and Others
- AVERAGE NUTRIENT APPLICATION RATE - This refers to the average volume of nutrient consumed per hectare of farmland in each country.
- CROP TYPES COVERED - Field Crops: Cereals, Pulses, Oilseeds, and Fiber Crops Horticulture: Fruits, Vegetables, Plantation Crops and Spices, Turf Grass and Ornamentals
| Keyword | Definition |
|---|---|
| Fertilizer | Chemical substance applied to crops to ensure nutritional requirements, available in various forms such as granules, powders, liquid, water soluble, etc. |
| Specialty Fertilizer | Used for enhanced efficiency and nutrient availability applied through soil, foliar, and fertigation. Includes CRF, SRF, liquid fertilizer, and water soluble fertilizers. |
| Controlled-Release Fertilizers (CRF) | Coated with materials such as polymer, polymer-sulfur, and other materials such as resins to ensure nutrient availability to the crop for its entire life cycle. |
| Slow-Release Fertilizers (SRF) | Coated with materials such as sulfur, neem, etc., to ensure nutrient availability to the crop for a longer period. |
| Foliar Fertilizers | Consist of both liquid and water soluble fertilizers applied through foliar application. |
| Water-Soluble Fertilizers | Available in various forms including liquid, powder, etc., used in foliar and fertigation mode of fertilizer application. |
| Fertigation | Fertilizers applied through different irrigation systems such as drip irrigation, micro irrigation, sprinkler irrigation, etc. |
| Anhydrous Ammonia | Used as fertilizer, directly injected into the soil, available in gaseous liquid form. |
| Single Super Phosphate (SSP) | Phosphorus fertilizer containing only phosphorus which has lesser than or equal to 35%. |
| Triple Super Phosphate (TSP) | Phosphorus fertilizer containing only phosphorus greater than 35%. |
| Enhanced Efficiency Fertilizers | Fertilizers coated or treated with additional layers of various ingredients to make it more efficient compared to other fertilizers. |
| Conventional Fertilizer | Fertilizers applied to crops through traditional methods including broadcasting, row placement, ploughing soil placement, etc. |
| Chelated Micronutrients | Micronutrient fertilizers coated with chelating agents such as EDTA, EDDHA, DTPA, HEDTA, etc. |
| Liquid Fertilizers | Available in liquid form, majorly used for application of fertilizers to crops through foliar and fertigation. |
Need More Details on Market Definition?
Ask a Question
Research Methodology
Mordor Intelligence follows a four-step methodology in all our reports.
- Step-1: IDENTIFY KEY VARIABLES: In order to build a robust forecasting methodology, the variables and factors identified in Step-1 are tested against available historical market numbers. Through an iterative process, the variables required for market forecast are set and the model is built on the basis of these variables.
- Step-2: Build a Market Model: Market-size estimations for the forecast years are in nominal terms. Inflation is not a part of the pricing, and the average selling price (ASP) is kept constant throughout the forecast period for each country.
- Step-3: Validate and Finalize: In this important step, all market numbers, variables and analyst calls are validated through an extensive network of primary research experts from the market studied. The respondents are selected across levels and functions to generate a holistic picture of the market studied.
- Step-4: Research Outputs: Syndicated Reports, Custom Consulting Assignments, Databases & Subscription Platforms

Get More Details On Research Methodology
Download PDF


