Market Overview
| Study Period | 2021 - 2031 |
|---|---|
| Forecast Data Period | 2026 - 2031 |
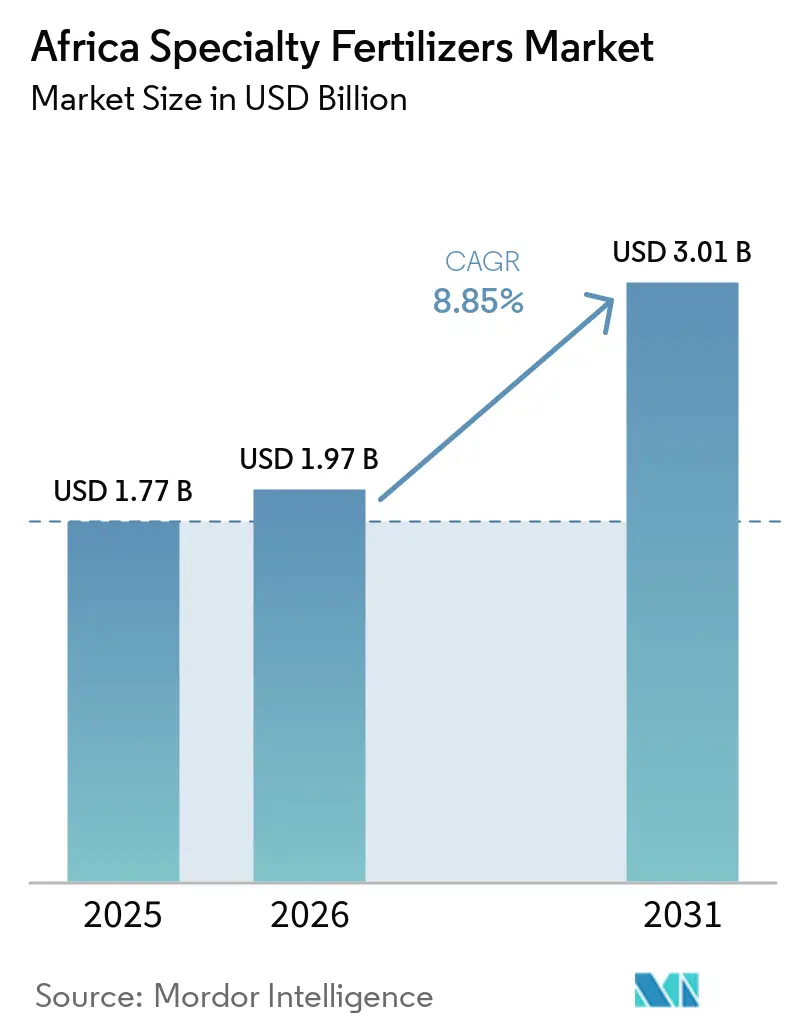
| Base Year Market Size (2025) | USD 1.77 Billion |
| Market Size (2026) | USD 1.97 Billion |
| Market Size (2031) | USD 3.01 Billion |
| Growth Rate (2026 - 2031) | 8.85% CAGR |
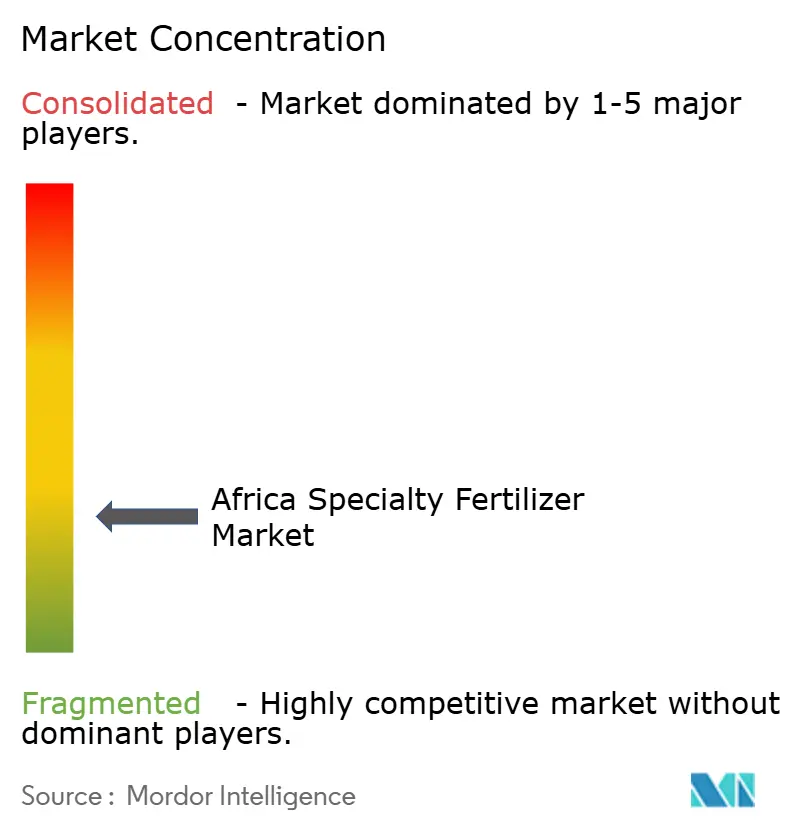
| Market Concentration | Low |
Major Players *Disclaimer: Major Players sorted in no particular order Image © Mordor Intelligence. Reuse requires attribution under CC BY 4.0. | |
Africa Specialty Fertilizers Market Analysis by Mordor Intelligence
The Africa specialty fertilizers market size was USD 1.77 billion in 2025 to USD 1.97 billion in 2026 and is forecast to reach USD 3.01 billion by 2031 at 8.85% CAGR over 2026-2031. Government subsidy reforms, rapid irrigation buildouts, and the migration to precision farming collectively accelerate demand for high-efficiency formulations. Regional leaders are channeling public and private capital into new production capacity, while cross-border trade harmonization under the African Continental Free Trade Area simplifies distribution. Market participants also see opportunities in digital platforms that match specialty blends with site-specific soil data, shrinking the performance gap between smallholders and large estates. Competitive intensity is fragmented as global majors chase growth alongside well-funded African champions, each racing to localize manufacturing and reduce import exposure.
Key Report Takeaways
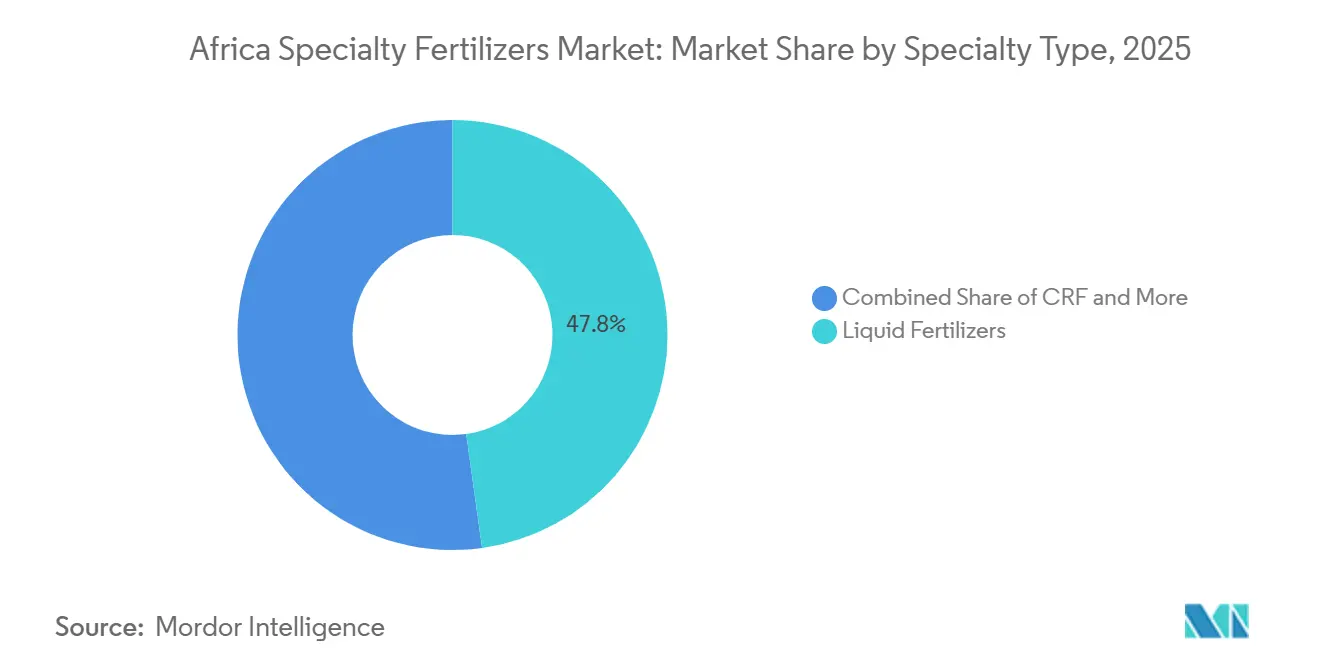
- By specialty type, liquid fertilizers led with a 47.8% share of the Africa specialty fertilizers market share in 2025, while controlled-release fertilizers (CRFs) are projected to be the fastest-growing segment, registering a CAGR of 8.4% during 2026–2031.
- By application mode, fertigation held the largest segment, accounting for a 48.6% share of the Africa specialty fertilizers market in 2025, while soil application is projected to be the fastest-growing segment, expanding at a CAGR of 7.5% during 2026–2031.
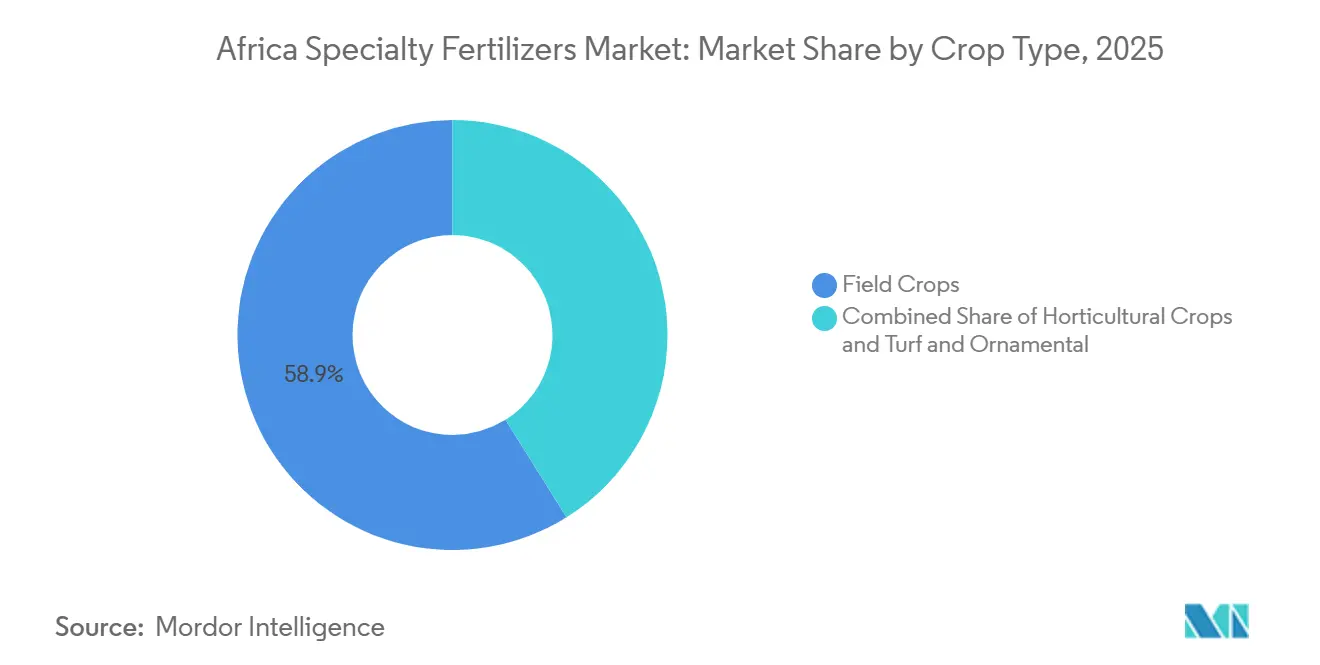
- By crop type, field crops held the largest segment, accounting for 58.9% of the Africa specialty fertilizers market size in 2025, while horticultural crops are projected to be the fastest-growing segment, registering a CAGR of 8.0% through 2031.
- By geography, South Africa accounted for 20.7% share of the Africa specialty fertilizers market in 2025, while Nigeria is projected to be the fastest-growing market, registering a CAGR of 7.6% through 2031.
Note: Market size and forecast figures in this report are generated using Mordor Intelligence’s proprietary estimation framework, updated with the latest available data and insights as of January 2026.
Africa Specialty Fertilizers Market Trends and Insights
Drivers Impact Analysis*
| Driver | (~) % Impact on CAGR Forecast | Geographic Relevance | Impact Timeline |
|---|---|---|---|
| Government subsidies and policy incentives | +1.2% | Nigeria, Kenya, Ethiopia, and Ghana | Medium term (2-4 years) |
| Decreasing arable land per capita | +0.9% | West Africa and broader Sub-Saharan Africa | Long term (≥ 4 years) |
| Shift toward high-value horticultural exports | +0.8% | South Africa, Kenya, Morocco, and Côte d’Ivoire | Medium term (2-4 years) |
| Micro-irrigation projects backed by AFDB (African Development Bank) | +0.7% | East Africa and the Sahel | Medium term (2-4 years) |
| Drone-based foliar nutrient application | +0.5% | South Africa, Nigeria, and Kenya | Short term (≤ 2 years) |
| Carbon-credit linked premium pricing | +0.4% | Zambia, Tanzania, and Kenya | Long term (≥ 4 years) |
| Source: Mordor Intelligence | |||


Government Subsidies and Policy Incentives
National fertilizers subsidy reforms across Africa are redirecting over USD 1 billion toward climate-smart specialty inputs, fundamentally reshaping procurement patterns from bulk commodities to precision formulations. Nigeria's Special Agro-Processing Zones program allocated USD 500 million in 2024 specifically for specialty fertilizers distribution infrastructure, while Kenya's fertilizers subsidy program expanded to include water-soluble and controlled-release formulations for the first time [1]Source: African Development Bank, “African Development Bank – Development Finance,” afdb.org. The African Union's Nairobi Declaration 2024 committed member states to achieve 50% fertilizer self-sufficiency by 2030, driving policy alignment toward specialty product manufacturing and regional value chains. These subsidy reforms create sustained demand for enhanced-efficiency formulations while reducing farmers' price sensitivity to premium specialty products.
Decreasing Arable Land Per Capita
Africa's arable land per capita declined from 0.31 hectares in 2000 to 0.23 hectares in 2024, forcing agricultural intensification through higher-efficiency nutrient solutions rather than area expansion. Sub-Saharan Africa averages only 13-20 kg nutrient application per hectare compared to 150 kg/ha in developed regions, creating substantial scope for specialty fertilizers adoption to bridge yield gaps. Soil degradation affects up to 65% of arable land across the continent, with annual productivity losses of 4.3-26.6% from topsoil depletion requiring micronutrient supplementation and enhanced-efficiency formulations. Mali's Trenabougou region exemplifies the challenge, with soil analysis revealing deficiencies in nitrogen, potassium, and magnesium alongside limited micronutrients including nickel, manganese, and boron.
Shift Toward High-Value Horticultural Exports
Export-oriented horticulture demands precision fertigation-grade nutrition to meet international quality standards, driving specialty fertilizers adoption beyond traditional field crop applications. Kenya's flower exports generated USD 870 million in 2024, requiring specialized water-soluble NPK formulations for greenhouse production systems. South Africa's citrus exports reached 2.8 million metric tons in 2024, with premium markets demanding residue-free production protocols that favor controlled-release and organic-certified specialty formulations. Morocco's agricultural export strategy targets USD 4.2 billion by 2030, emphasizing high-value crops that require micronutrient-enriched specialty fertilizers for quality differentiation.
Micro-Irrigation Projects Backed by AfDB (African Development Bank)
The African Development Bank's USD 2.4 billion commitment to irrigation infrastructure through 2028 directly enables fertigation system deployment, creating captive demand for water-soluble specialty fertilizers. AfDB's Desert-to-Power initiative includes 35 micro-irrigation projects across the Sahel, with drip-line installations growing and unlocking demand for liquid fertilizers integration. Ethiopia's irrigation expansion targets 1.2 million hectares by 2030, requiring specialized fertigation-compatible formulations for smallholder adoption. Nigeria's anchor borrowers program integrated micro-irrigation financing with specialty fertilizers procurement, covering 500,000 farmers in 2024. Tanzania's Southern Agricultural Growth Corridor incorporates fertigation infrastructure as a core component, with World Bank co-financing supporting water-soluble fertilizers supply chains.
Restraints Impact Analysis*
| Restraint | (~) % Impact on CAGR Forecast | Geographic Relevance | Impact Timeline |
|---|---|---|---|
| Limited distribution infrastructure | -0.8% | Rural Sub-Saharan Africa | Medium term (2-4 years) |
| High upfront cost of Controlled-Release Fertilizer (CRF) polymers | -0.6% | Smallholder-dominated zones | Short term (≤ 2 years) |
| Inconsistent regional heavy-metal standards | -0.4% | Cross-border corridors | Medium term (2-4 years) |
| Supply-chain exposure to coating polymer imports | -0.3% | Import-dependent markets | Short term (≤ 2 years) |
| Source: Mordor Intelligence | |||
Limited Distribution Infrastructure
Poor cold-chain and bulk terminal infrastructure for liquid fertilizers raises distribution costs by 12% compared to granular products, constraining adoption in remote agricultural areas. DP World's USD 3 billion African ports investment through 2029 addresses some infrastructure gaps, but rural last-mile distribution remains problematic for temperature-sensitive specialty formulations. Nigeria's fertilizers distribution network covers only 40% of farming communities with proper storage facilities, forcing farmers to rely on suboptimal ambient storage that degrades product quality. South Africa's agricultural cooperatives report 25% product loss rates for liquid fertilizers due to inadequate cold storage in rural depots.
High Upfront Cost of Controlled-Release Fertilizer (CRF) Polymers
Controlled-release fertilizers (CRF) retail prices remain 2-3 times higher than conventional urea, limiting adoption among smallholder farmers who comprise 70% of Africa's agricultural workforce. Polymer coating materials face import dependency and currency volatility, with coating costs representing 40-60% of finished CRF pricing. International Maritime Organization (IMO) 2024 fuel regulations increased polymer freight costs by 22%, further pressuring Controlled-release fertilizers (CRF) affordability in import-dependent markets[2]Source: International Maritime Organization, “Fuel Regulation Impact,” imo.org . Haifa Group's USD 350 million investment to double production capacity aims to achieve economies of scale, but local polymer sourcing remains limited across Africa. The price premium creates a bifurcated market where commercial farms adopt Controlled-release fertilizers (CRF) technology while smallholders rely on conventional fertilizers, limiting overall market expansion potential.
*Our forecasts treat driver/restraint impacts as directional, not additive. The impact forecasts reflect baseline growth, mix effects, and variable interactions.
Segment Analysis
By Specialty Type: Liquid Fertilizer Dominance Meets Liquid Innovation
Liquid fertilizers accounted for 47.8% of the Africa specialty fertilizers market share in 2025, driven by expanding fertigation infrastructure and export crop requirements for precise nutrition management. Liquid fertilizers have gained significant traction due to their compatibility with modern irrigation systems and advanced cultivation methods like hydroponics and aquaponics. The segment's growth is supported by developments in irrigation technology and the increasing adoption of precision farming techniques. Meanwhile, the Slow-Release Fertilizer (SRF) segment, while smaller, plays a crucial role in minimizing soil hardening and coordinating nutrient flow to plants. These fertilizers are particularly valuable in reducing application frequency and overall fertilizers costs, while also offering environmental benefits such as reduced nitrogen volatilization and leaching.
Controlled-release fertilizers (CRF) are the fastest-growing segment, with a projected CAGR of 8.4% from 2026 to 2031, primarily serving commercial farms and high-value horticulture where extended nutrient release justifies premium pricing. The segment evolution toward precision formulations creates opportunities for regional manufacturers to develop climate-adapted products while global players focus on technology transfer and local partnerships. The segment's growth is particularly notable in field crops, where the need to minimize nutrient losses through leaching and volatilization is critical. The adoption of Controlled-Release Fertilizer (CRF) is likely to accelerate as farmers increasingly recognize its benefits in reducing application frequency and improving nutrient use efficiency.


By Application Mode: Fertigation Infrastructure Drives Soil Application Growth
Fertigation represented the largest segment, holding a 48.6% market share of the Africa specialty fertilizers market in 2025, reflecting widespread adoption of drip irrigation systems and greenhouse production methods across key agricultural regions. AgriEdge's precision agriculture platform demonstrates the technological evolution of soil application methods, offering variable-rate fertilization tools that deliver "right dose, right place, right time" nutrient management. The widespread adoption of fertigation can be attributed to its numerous advantages, including reduced costs, enhanced efficiency, and a significant 20-40% reduction in overall fertilizer consumption. The method has gained particular traction in field crops, which account for over 77% of fertigation applications, driven by the increasing adoption of advanced irrigation systems such as micro or sprinkler irrigation. These systems are specifically designed to achieve uniform nutrient distribution over large cultivation areas, making fertigation an ideal choice for commercial farming operations across Africa.
Soil application is the fastest-growing mode, projected to expand at a CAGR of 7.5% from 2026 to 2031, driven by precision agriculture adoption and variable-rate application technologies that optimize nutrient placement. The convergence of digital agriculture and specialty fertilizers creates application synergies where GPS-guided equipment optimizes product placement while reducing input volumes. Regulatory frameworks under ECOWAS (Economic Community of West African States) agricultural harmonization support cross-border equipment mobility and technology transfer, facilitating application method standardization across West African markets.
By Crop Type: Field Crops Maintain Dual Leadership
Field crops constituted the largest segment, accounting for 58.9% of the Africa specialty fertilizers market size in 2025, driven by economies of scale and increased use of enhanced-efficiency fertilizers in staple crop production. Uganda's maize production reached 3,264,423 metric tons (MT) in 2024, a 2% increase from 2023. Maize export earnings increased from USD 88 million in 2022 to USD 244.6 million in 2023, reflecting the value gains from the adoption of specialty fertilizers. Government subsidy programs, which now include enhanced-efficiency fertilizers, support the growth of the field crop segment.
The horticultural crops segment is the fastest-growing in the Africa specialty fertilizers market, with a projected CAGR of 8.0% through 2031, driven by increasing demand for high-quality fruits and vegetables. The segment's expansion is supported by the adoption of advanced cultivation techniques, including greenhouse fertilization and precision agriculture methods. Horticultural producers are increasingly recognizing the value of horticultural in meeting their production targets and improving crop quality. The growing focus on export-oriented horticulture production, particularly in countries such as South Africa and Kenya, is driving demand for premium specialty fertilizers. The segment is also benefiting from rising consumer awareness about food quality and safety, leading to increased adoption of controlled-release and water-soluble fertilizers in horticultural production.
Geography Analysis
South Africa accounted for 20.7% of the Africa specialty fertilizers market share in 2025, benefiting from its position as the continent's most developed agricultural economy and its leadership role in regional food security initiatives. The country's citrus export industry, which reached approximately 2.8 million metric tons in 2024, supports demand for premium specialty fertilizers that help producers meet international quality standards. Domestic fertilizer demand is further supported by investments in agricultural modernization and improvements in energy infrastructure, including renewable energy procurement initiatives.
Nigeria is projected to be the fastest-growing market, registering a CAGR of 7.6% through 2031, supported by infrastructure investments and policy reforms that encourage fertilizer adoption. The country's Special Agro-Industrial Processing Zones program includes significant investments in agricultural and fertilizer distribution infrastructure, while expansions by major fertilizer producers continue to strengthen Nigeria's position as a regional production hub. Investments by companies such as Dangote Group and Indorama Eleme Fertilizer & Chemicals are anticipated to support long-term fertilizer availability and market development across West Africa.
The rest of Africa encompasses a diverse range of markets, from Morocco's export-oriented horticulture sector to Ethiopia's efforts to expand domestic fertilizer manufacturing capacity. Morocco's agricultural export strategy emphasizes high-value crops that increasingly require micronutrient-enriched specialty fertilizer formulations. Ethiopia has also announced plans to strengthen domestic fertilizer production following major infrastructure developments, with the objective of reducing import dependence and improving long-term agricultural self-sufficiency. Successful implementation of these initiatives could create new opportunities for specialty fertilizer adoption across East Africa.
Competitive Landscape
The Africa specialty fertilizers market is fragmented, with top players Yara International ASA, ICL Group Ltd, K+S Aktiengesellschaft, Unikeyterra Chemical, and Safsulphur, creating a competitive environment that balances global expertise with regional specialization. In 2025, Yara International leads with market share, leveraging its global R&D capabilities and recent NOK 2.75 billion (USD 257 million) green bond financing to expand sustainable nutrition solutions across the continent.
The landscape is witnessing increased merger and acquisition activity, particularly focused on expanding geographical presence and acquiring technological capabilities. Companies are strategically acquiring local distributors and manufacturers to enhance their market penetration and establish direct connections with farmers. Joint ventures between international and local players are becoming more common, combining global expertise with local market knowledge. The industry is seeing investments in production facilities and logistics infrastructure, particularly in major agricultural regions, to improve product availability and reduce transportation costs. Market players are also forming strategic alliances with agricultural technology providers to enhance their digital capabilities and service offerings.
Opportunities exist in precision agriculture integration, with digital platforms like AgriEdge's variable-rate fertilization tools demonstrating the potential for technology-enabled specialty fertilizers optimization. Emerging disruptors include carbon credit aggregators linking enhanced-efficiency fertilizers to climate payments, while nano-formulation developers target drought-resilient specialty products adapted to African growing conditions.
Africa Specialty Fertilizers Industry Leaders
Yara International ASA
ICL Group Ltd
K+S Aktiengesellschaft
Unikeyterra Chemical
Safsulphur
- *Disclaimer: Major Players sorted in no particular order

Recent Industry Developments
- December 2024: Yara International partnered with Asili Agriculture to establish a Knowledge Centre in Uganda, providing smallholder farmers with training on sustainable crop management and access to digital decision tools, including the FarmCare app for optimized fertilizers recommendations.
- March 2024: African Development Bank approved a USD 75 million loan to Indorama Eleme Fertilizers for a third urea production line and new shipping terminal in Nigeria, adding 1.4 million metric tons annual capacity and strengthening regional supply chains.
- April 2023: K+S acquired a 75% share of the fertilizers business of a South African trading company, Industrial Commodities Holdings (Pty) Ltd (ICH). In addition to expanding the core business, K+S is strengthening its operations in southern and eastern Africa as a result of this acquisition. The newly acquired fertilizers business in the future is to be operated in a joint venture under the name of FertivPty Ltd.


Africa Specialty Fertilizers Market Report Scope
Speciality Type
| Controlled-Release Fertilizer (CRF) | Polymer Coated |
| Polymer-Sulfur Coated | |
| Others | |
| Liquid Fertilizer | |
| Slow-Release Fertilizer (SRF) | |
| Water Soluble |
Application Mode
| Fertigation |
| Foliar |
| Soil |
Crop Type
| Field Crops |
| Horticultural Crops |
| Turf & Ornamental |
Country
| Nigeria |
| South Africa |
| Rest of Africa |
| Speciality Type | Controlled-Release Fertilizer (CRF) | Polymer Coated |
| Polymer-Sulfur Coated | ||
| Others | ||
| Liquid Fertilizer | ||
| Slow-Release Fertilizer (SRF) | ||
| Water Soluble | ||
| Application Mode | Fertigation | |
| Foliar | ||
| Soil | ||
| Crop Type | Field Crops | |
| Horticultural Crops | ||
| Turf & Ornamental | ||
| Country | Nigeria | |
| South Africa | ||
| Rest of Africa |


Market Definition
- MARKET ESTIMATION LEVEL - Market Estimations for various types of fertilizers has been done at the product-level and not at the nutrient-level.
- NUTRIENT TYPES COVERED - Primary Nutrients: N, P and K, Secondary Macronutrients: Ca, Mg and S, Micronutients: Zn, Mn, Cu, Fe, Mo, B, and Others
- AVERAGE NUTRIENT APPLICATION RATE - This refers to the average volume of nutrient consumed per hectare of farmland in each country.
- CROP TYPES COVERED - Field Crops: Cereals, Pulses, Oilseeds, and Fiber Crops Horticulture: Fruits, Vegetables, Plantation Crops and Spices, Turf Grass and Ornamentals
| Keyword | Definition |
|---|---|
| Fertilizer | Chemical substance applied to crops to ensure nutritional requirements, available in various forms such as granules, powders, liquid, water soluble, etc. |
| Specialty Fertilizer | Used for enhanced efficiency and nutrient availability applied through soil, foliar, and fertigation. Includes CRF, SRF, liquid fertilizer, and water soluble fertilizers. |
| Controlled-Release Fertilizers (CRF) | Coated with materials such as polymer, polymer-sulfur, and other materials such as resins to ensure nutrient availability to the crop for its entire life cycle. |
| Slow-Release Fertilizers (SRF) | Coated with materials such as sulfur, neem, etc., to ensure nutrient availability to the crop for a longer period. |
| Foliar Fertilizers | Consist of both liquid and water soluble fertilizers applied through foliar application. |
| Water-Soluble Fertilizers | Available in various forms including liquid, powder, etc., used in foliar and fertigation mode of fertilizer application. |
| Fertigation | Fertilizers applied through different irrigation systems such as drip irrigation, micro irrigation, sprinkler irrigation, etc. |
| Anhydrous Ammonia | Used as fertilizer, directly injected into the soil, available in gaseous liquid form. |
| Single Super Phosphate (SSP) | Phosphorus fertilizer containing only phosphorus which has lesser than or equal to 35%. |
| Triple Super Phosphate (TSP) | Phosphorus fertilizer containing only phosphorus greater than 35%. |
| Enhanced Efficiency Fertilizers | Fertilizers coated or treated with additional layers of various ingredients to make it more efficient compared to other fertilizers. |
| Conventional Fertilizer | Fertilizers applied to crops through traditional methods including broadcasting, row placement, ploughing soil placement, etc. |
| Chelated Micronutrients | Micronutrient fertilizers coated with chelating agents such as EDTA, EDDHA, DTPA, HEDTA, etc. |
| Liquid Fertilizers | Available in liquid form, majorly used for application of fertilizers to crops through foliar and fertigation. |


Research Methodology
Mordor Intelligence follows a four-step methodology in all our reports.
- Step-1: IDENTIFY KEY VARIABLES: In order to build a robust forecasting methodology, the variables and factors identified in Step-1 are tested against available historical market numbers. Through an iterative process, the variables required for market forecast are set and the model is built on the basis of these variables.
- Step-2: Build a Market Model: Market-size estimations for the forecast years are in nominal terms. Inflation is not a part of the pricing, and the average selling price (ASP) is kept constant throughout the forecast period for each country.
- Step-3: Validate and Finalize: In this important step, all market numbers, variables and analyst calls are validated through an extensive network of primary research experts from the market studied. The respondents are selected across levels and functions to generate a holistic picture of the market studied.
- Step-4: Research Outputs: Syndicated Reports, Custom Consulting Assignments, Databases & Subscription Platforms


