
Wireless Healthcare Asset Management Market Size and Share
Market Overview
| Study Period | 2020 - 2031 |
|---|---|
| Market Size (2026) | USD 74.96 Billion |
| Market Size (2031) | USD 213.88 Billion |
| Growth Rate (2026 - 2031) | 23.35 % |
| Fastest Growing Market | Asia Pacific |
| Largest Market | North America |
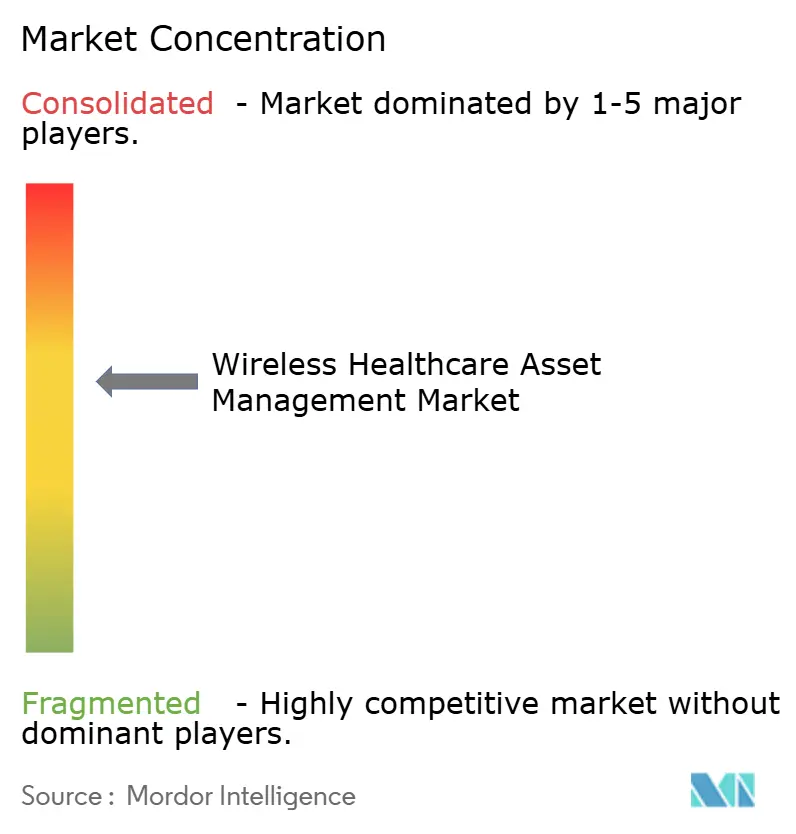
| Market Concentration | Medium |
Major Players
*Disclaimer: Major Players sorted in no particular order Image © Mordor Intelligence. Reuse requires attribution under CC BY 4.0. |
|
Wireless Healthcare Asset Management Market Analysis by Mordor Intelligence
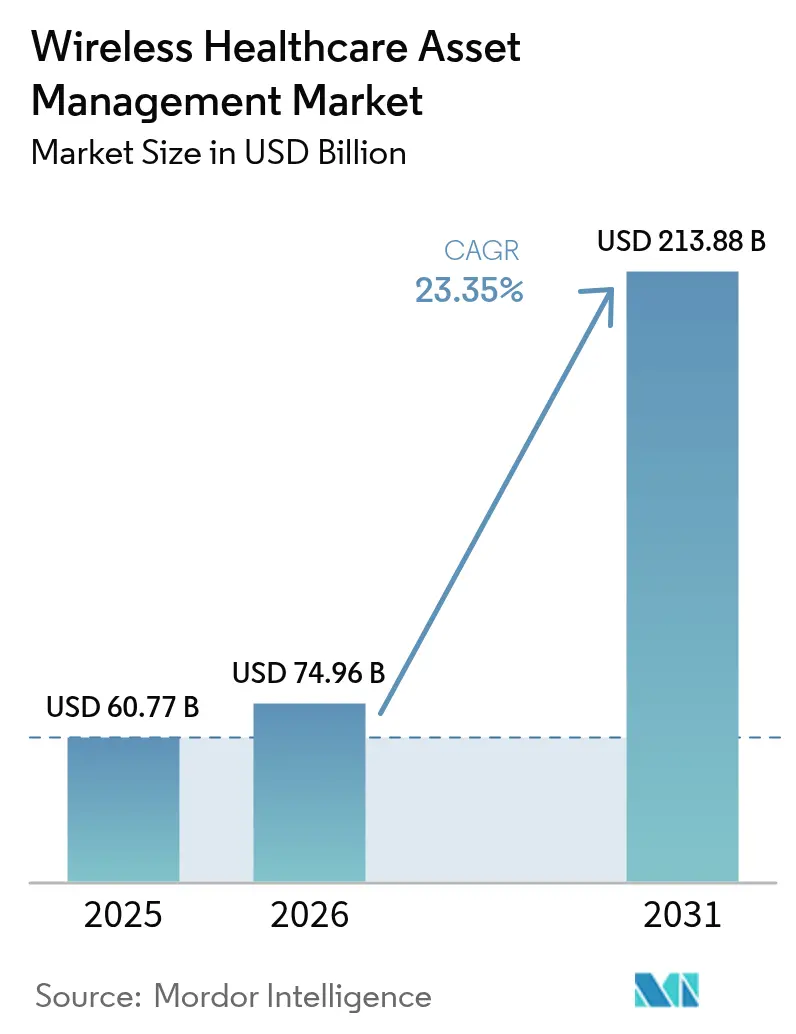
The wireless healthcare asset management market size is expected to grow from USD 60.77 billion in 2025 to USD 74.96 billion in 2026 and is forecast to reach USD 213.88 billion by 2031 at 23.35% CAGR over 2026-2031. Growth is underpinned by hospitals shifting capital from manual inventory audits to real-time location systems that slash equipment search time, automate regulatory documentation, and support predictive maintenance. The convergence of RFID, Bluetooth Low Energy (BLE), and Ultra-Wideband (UWB) with edge-based AI is reshaping utilization economics, as reimbursement regimes penalize avoidable delays and regulators tighten traceability rules.[1] Platform vendors are embedding location analytics directly within electronic health record (EHR) workflows, shortening payback cycles and opening up new subscription revenue opportunities. At the same time, cybersecurity mandates such as the forthcoming HIPAA Security Rule updates are influencing technology choices and vendor selection, favoring suppliers who can demonstrate AES-256 encryption and software bill-of-materials transparency.
Key Report Takeaways
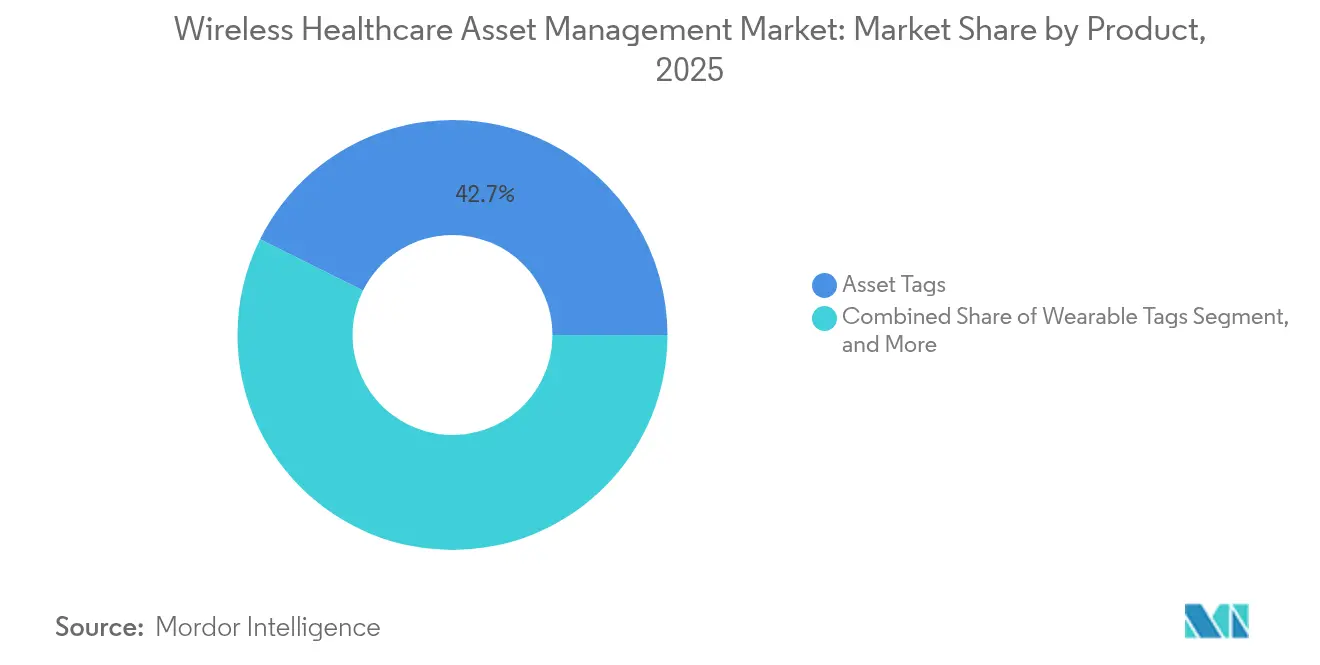
- By product, Asset Tags captured 42.65% of the wireless healthcare asset management market share in 2025, while Software Platforms are projected to achieve a 25.95% CAGR through 2031.
- By technology, RFID held 55.10% revenue share of the wireless healthcare asset management market in 2025; Ultra-Wideband is forecast to expand at 26.05% CAGR through 2031.
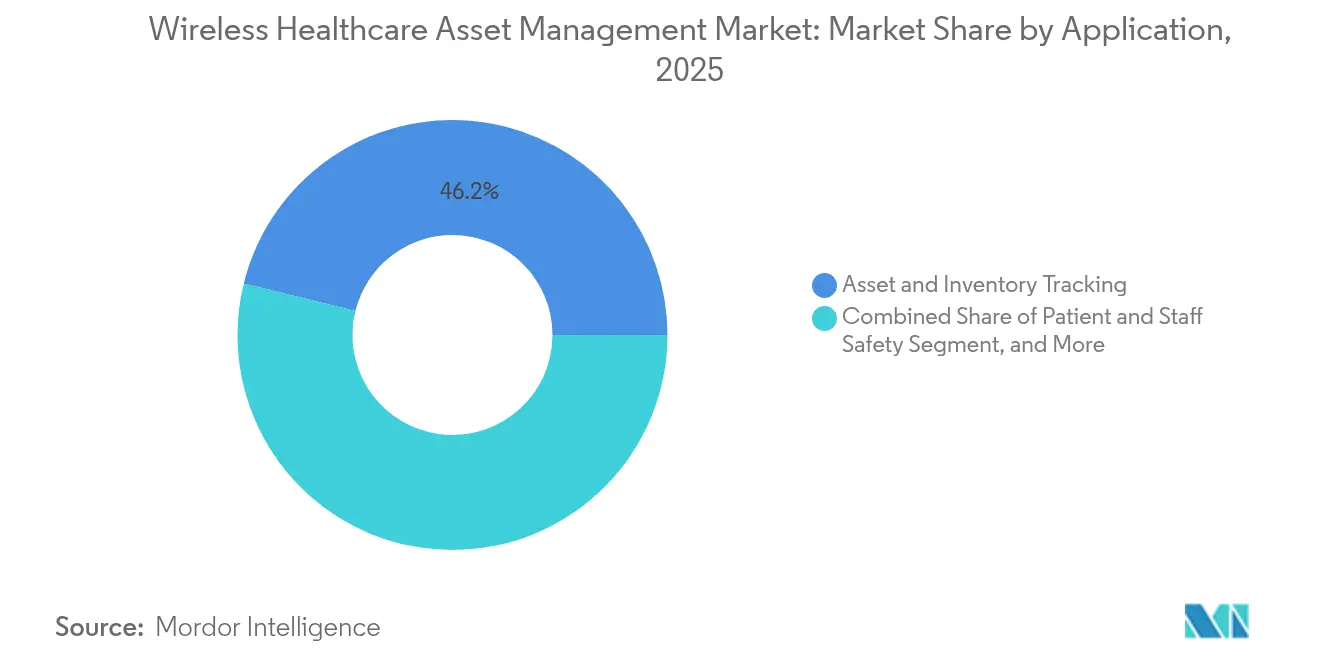
- By application, Asset and Inventory Tracking commanded 46.15% of the wireless healthcare asset management market size in 2025, while Environmental and Condition Monitoring is growing at a rate of 26.2%.
- By end user, Hospitals and Integrated Delivery Networks led the wireless healthcare asset management market with a 53.10% share in 2025, whereas Long-Term Care and Senior Living Facilities are advancing at a 26.4% CAGR.
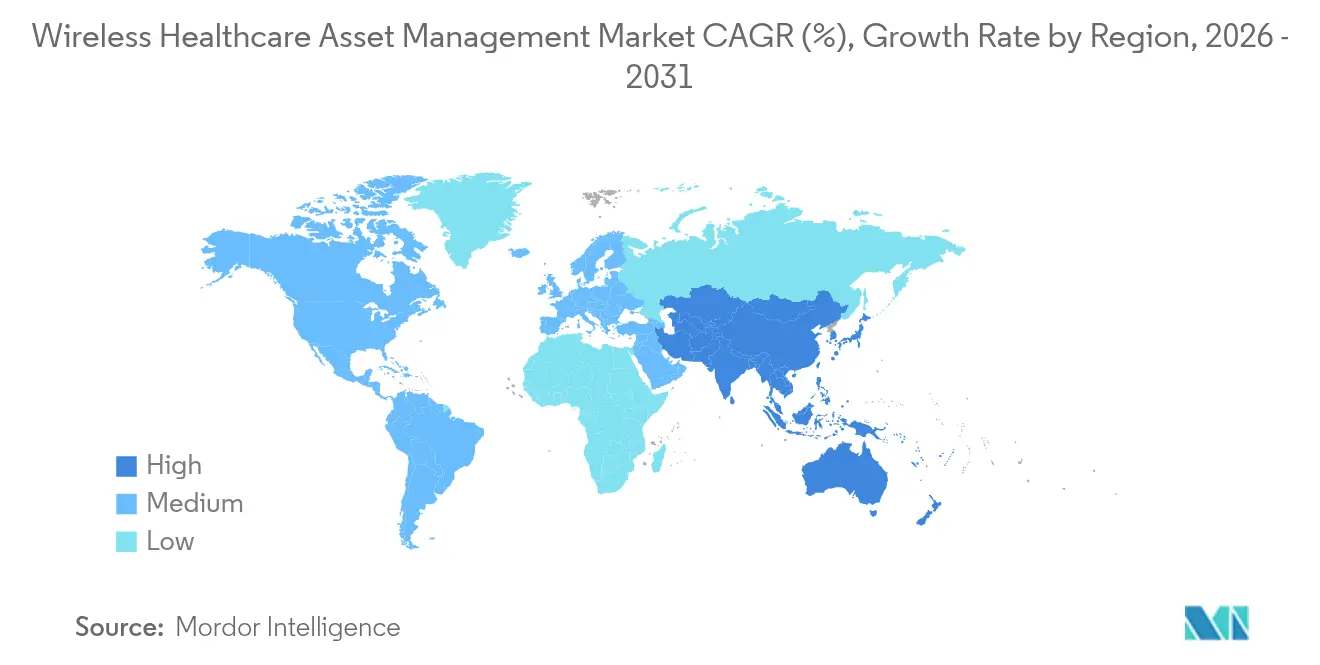
- By geography, North America accounted for 37.45% revenue of the wireless healthcare asset management market in 2025; Asia-Pacific is set to rise at 25.9% CAGR through 2031.
Note: Market size and forecast figures in this report are generated using Mordor Intelligence’s proprietary estimation framework, updated with the latest available data and insights as of 2026.
Market Trends and Insights
Drivers Impact Analysis of Wireless Healthcare Asset Management Market*
| Driver | (~) % Impact on CAGR Forecast | Geographic Relevance | Impact Timeline |
|---|---|---|---|
| Rapid adoption of RFID-based asset tagging | +5.2% | North America, Europe, Asia Pacific leading deployments | Medium term (2-4 years) |
| Need for real-time asset visibility | +4.8% | Global, acute in North America and Asia Pacific tier-1 hospitals | Short term (≤ 2 years) |
| Rising investment in smart hospital infra | +4.5% | Asia Pacific core, spillover to Middle East | Long term (≥ 4 years) |
| Edge-AI predictive maintenance | +3.9% | North America, Europe, early pilots in China and India | Medium term (2-4 years) |
| ESG targets driving low-power BLE and UWB | +2.8% | Europe and North America, emerging in Middle East | Long term (≥ 4 years) |
| Shift to RTLS-as-a-Service models | +2.6% | Global, fastest in North America ambulatory surgery centers | Short term (≤ 2 years) |
| Source: Mordor Intelligence | |||
Rapid Adoption of RFID-Based Asset Tagging
Hospitals are embedding passive RFID tags into infusion pumps, ventilators, and wheelchairs because the technology provides read ranges of 3 m–10 m without requiring batteries, a critical benefit in settings where biomedical staff turnover exceeds 20% annually. Impinj’s M800 reader, launched in 2024, improves tag-read density by 40%, allowing one fixed reader to monitor 200 assets in busy corridors. FDA guidance issued the same year confirmed that RFID labels attached to Class II devices need no separate 510(k) filing, removing a key regulatory hurdle. A peer-reviewed study demonstrated that RFID tracking reduced search time by 68% in a 300-bed hospital and enabled 4.2 additional monthly procedures per operating room. Ambulatory surgery centers, where manual audits consume up to 90 minutes per shift, are consequently accelerating rollouts.
Need for Real-Time Asset Visibility to Cut Equipment Search Time
Clinical teams in U.S. hospitals lose 21 minutes per shift searching for devices, a drain exacerbated by value-based payment models that penalize extended lengths of stay. Real-time location systems, which refresh every 5–10 seconds, route the nearest available pump or ECG unit to the requesting ward, reducing response time from 12 minutes to under 3 minutes. A 2024 integrated delivery network saved USD 1.8 million a year on rentals after achieving 95% visibility via Wi-Fi triangulation. Zebra Technologies reports customers trimmed capital expenditure by 18% by redeploying idle assets surfaced through its MotionWorks analytics.[2]
Rising Investment in Smart Hospital Infrastructure
China earmarked CNY 50 billion (USD 7 billion) in 2024 to build smart tertiary hospitals with mandatory real-time location capability under Healthy China 2030. India’s Ayushman Bharat Digital Mission plugged asset-tracking modules into its national health stack that same year, covering 12,000 public facilities. Saudi Arabia’s Vision 2030 program mandates the use of UWB or BLE infrastructure in new medical centers, compressing vendor sales cycles to under 12 months. Cisco notes 38% of its healthcare pipeline now bundles location services, up from 14% in 2022.
Edge-AI Predictive Maintenance Reducing Device Downtime
Embedding analytics at the network edge enables platforms to predict infusion-pump failure 72 hours in advance by analyzing vibration and temperature signatures. GE Healthcare’s Edison module analyzes telemetry from 15,000 imaging devices worldwide and lowered service costs 22% in 2024. Siemens integrated similar algorithms into its Teamplay suite, cutting unplanned downtime by 28%. Early adopters extend the mean time between failures of ventilators by 30%–40%, thereby preserving scarce capital.
Restraints Impact Analysis of Wireless Healthcare Asset Management Market*
| Restraint | (~) % Impact on CAGR Forecast | Geographic Relevance | Impact Timeline |
|---|---|---|---|
| High upfront hardware and integration costs | -3.2% | Global, acute in emerging markets and rural North America | Short term (≤ 2 years) |
| Data-privacy and cybersecurity compliance hurdles | -2.9% | North America and Europe, tightening in Asia Pacific | Medium term (2-4 years) |
| Shortage of RTLS-skilled biomedical engineers | -2.1% | Global, severe in rural integrated delivery networks | Long term (≥ 4 years) |
| RF interference from 5G and Wi-Fi-6E in legacy hospital buildings | -1.8% | North America and Europe, emerging in Asia Pacific urban centers | Medium term (2-4 years) |
| Source: Mordor Intelligence | |||
High Upfront Hardware and Integration Costs
A 300-bed deployment typically requires 150–200 infrastructure nodes, along with 3,000 tags, resulting in a capital outlay of USD 400,000–600,000 before accounting for software and labor costs.[3] Ambulatory surgery centers operating on 3%–5% margins struggle to fund such investments despite 24-month payback models. Linking platforms to EHRs like Epic can add 6–9 months of custom interface work priced at USD 150–250 per hour. RTLS-as-a-Service, where vendors retain hardware ownership and bill monthly per-tag fees, is easing friction but remains nascent outside North America.
Data-Privacy and Cybersecurity Compliance Hurdles
HIPAA Security Rule revisions proposed in 2024 require multifactor authentication and AES-256 encryption for connected tags, forcing upgrades to legacy RFID and BLE devices. The EU Medical Device Regulation classifies RTLS software influencing care workflows as Class IIa, adding 12–18 months of conformity assessment. Hospitals now demand a software bill of materials and annual penetration tests, obligations smaller suppliers find hard to satisfy. CISA reported a 34% rise in ransomware attacks on healthcare IoT endpoints in 2024, elevating cybersecurity to a board-level issue.
*Our forecasts treat driver/restraint impacts as directional, not additive. The impact forecasts reflect baseline growth, mix effects, and variable interactions.
Wireless Healthcare Asset Management Market Segment Analysis
By Product:
Analytics-Driven Platforms Overtake HardwareSoftware Platforms are expanding at a rate of 25.95% annually, outpacing the overall wireless healthcare asset management market. Hospitals recognize that raw location data has limited value without predictive analytics, EHR integration, and automated audit trails. Asset Tags retained a 42.65% share in 2025, reflecting a legacy RFID and BLE installed base, yet revenue is migrating to recurring software fees. Wearable Tags for duress and elopement prevention are gaining steam in behavioral health units. Wireless Sensor monitoring of temperature and humidity surged following the updated USP 797 sterility rules. Hardware margins are being compressed as semiconductor firms integrate UWB into general-purpose Wi-Fi chipsets, underscoring the shift toward platform economics.
Software-centric vendors tend to capture higher valuation multiples; Zebra’s 2024 filing showed that software and services rose 31% year-over-year, compared to 12% for hardware. As a result, the wireless healthcare asset management market is tilting toward end-to-end subscriptions that roll infrastructure, tags, analytics, and compliance reporting into predictable OPEX.

By Technology:
Ultra-Wideband Races Ahead for Sub-Meter PrecisionRFID held a 55.10% share in 2025, thanks to the adoption of battery-free passive tags and the increasing ubiquity of readers. However, UWB is growing 26.05% a year as surgical theaters, catheter labs, and neonatal ICUs demand <30 cm accuracy, unattainable with Wi-Fi triangulation or BLE beacons. Wi-Fi solutions leverage existing access points but deliver errors of 3 m–5 m in metal-dense environments. BLE balances cost and performance, making it the preferred option for long-term care facilities. ZigBee and infrared remain niche. Qorvo shipped 12 million UWB chips in 2024, a 47% increase, driven by the demand for surgical instrument tracking.
Hospitals now operate dual-tier architectures, utilizing RFID or BLE for wheelchairs and pumps, and UWB for high-value instruments. Vendors that can orchestrate both layers within a single dashboard are winning multi-year contracts across integrated delivery networks.
By Application:
Environmental Monitoring Posts Fastest GainsAsset and Inventory Tracking accounted for 46.15% of revenue in 2025; however, Environmental and Condition Monitoring is advancing by 26.2% due to stricter cold-chain and pharmacy sterility mandates. United States hospital pharmacies adopting automated temperature sensors cut vaccine wastage by 81% and saved USD 340,000 per site in 2024. Patient and Staff Safety solutions, including duress badges and wander-management wristbands, are expanding in skilled nursing as staffing constraints worsen. Workflow and Capacity Optimization modules that map patient flow across emergency departments and operating rooms help hospitals hit throughput goals without adding beds. Compliance and Audit Management tools, which were once optional, are now typically bundled in most RFPs.
The wireless healthcare asset management market size for environmental monitoring is projected to widen its share as hospitals converge asset location and telemetry to enable contextual intelligence that anticipates failure and automates documentation.
By End User:
Long-Term Care Accelerates Amid Labor ShortagesHospitals and Integrated Delivery Networks held 53.10% of the wireless healthcare asset management market in 2025, leveraging scale to deploy enterprise RTLS. Yet, Long-Term Care and Senior Living Facilities are experiencing a 26.4% annual increase, driven by a 14% vacancy rate for certified nursing assistants that pressures operators to automate rounding and enhance resident safety. Ambulatory Surgery Centers, which perform 60% of U.S. outpatient procedures, are integrating RTLS to reduce turnover times and avoid rentals. Diagnostic Laboratories tracks mobile X-ray and specimen carriers to hit turnaround benchmarks. Other institutions, such as dialysis centers and rehabilitation hospitals, remain in the early stages but offer green-field growth opportunities.
Demonstrable ROI, regulatory reporting, and workforce augmentation form the core purchasing rationale across all end-user categories, anchoring long-term demand for wireless healthcare asset management.
Geography Analysis
North America Wireless Healthcare Asset Management Market
North America accounted for 37.45% of the revenue in 2025, as integrated delivery networks, such as HCA Healthcare, standardized asset visibility across hundreds of sites. High EHR penetration: Epic and Oracle Cerner cover 70% of U.S. beds, facilitating rapid data integration. Canada accelerated provincial deployments; Ontario Health invested CAD 85 million (USD 63 million) in 2024 to outfit 42 hospitals. Mexico’s IMSS pilot aimed to achieve a 25% reduction in rental costs across 18 hospitals. CMS has proposed tying payments to utilization metrics, a policy that could expand the wireless healthcare asset management market if adopted.
APAC Wireless Healthcare Asset Management Market
The Asia Pacific is the fastest-growing region, with a 25.9% CAGR. China mandated RTLS in all new tertiary hospitals larger than 500 beds, directing CNY 30 billion (USD 4.2 billion) toward deployments. India has embedded asset-tracking in the Ayushman Bharat Digital Mission, which spans 12,000 hospitals. Japan subsidizes up to 50% of elder-care RTLS projects to mitigate a projected 370,000-worker shortfall by 2025. South Korea offers certification incentives, and Australia clarified a lighter regulatory path for non-diagnostic RTLS software. Rapid urbanization, as forecasted by the WHO, is expected to add 400 million new city residents by 2030, driving the need for new hospital construction pre-wired for RTLS.
EMEA and South America Wireless Healthcare Asset Management Market
Europe, the Middle East, and Africa display mixed adoption. Germany, the United Kingdom, France, and Spain are deploying RTLS to meet the Medical Device Regulation's traceability rules. GDPR requires anonymization and local data hosting, benefiting vendors with regional cloud services. Saudi Arabia invested SAR 12 billion (USD 3.2 billion) in 2024 for Vision 2030 hospitals with built-in RTLS. The UAE requires RTLS in all new facilities as part of its ambitious goal to become one of the top 100 global healthcare providers. Africa and South America remain nascent, though private chains in Brazil, South Africa, and Nigeria are piloting deployments to attract medical tourists.
Regulatory Landscape
Wireless healthcare asset management deployments sit at the intersection of healthcare data rules, medical-device oversight, and radio spectrum compliance. In the United States, wireless links used by connected medical devices may fall under FCC rules, including the MedRadio Service in 47 CFR Part 95 (including MBAN in the 2360-2390 MHz band with registration requirements for indoor hospital use), while the FDA regulates safety and effectiveness for medical devices and certain software functions tied to patient safety workflows.
Cybersecurity and interoperability requirements are tightening alongside adoption. The FDA issued a final guidance on June 27, 2025, Cybersecurity in Medical Devices: Quality System Considerations and Content of Premarket Submissions, elevating expectations around artifacts such as SBOMs and vulnerability management for connected devices and software. On the standards side, ISO/IEEE 11073-10701-2024 (published September 24, 2024) supports secure interoperability in service-oriented device connectivity environments, and ISO/IEEE 11073-10103:2025 (published October 6, 2025) expands nomenclature for implantable cardiac devices to improve data transfer into clinical systems, shaping how vendors position integration-ready platforms and device connectivity modules.
Value Chain Analysis
The value chain starts with component and tag/anchor hardware suppliers (RFID inlays and readers, BLE tags and mesh anchors, UWB anchors, and gateways) and moves into RTLS and asset management software platforms that deliver location analytics, alerts, and compliance reporting. Upstream choices are influenced by interoperability and reference architectures: EPC Gen2 UHF RFID remains a common baseline for inventory checkpoints, while open specifications such as omlox Core Zone v2 support vendor-agnostic UWB RTLS interoperability, and clinical IoT frameworks such as IEEE/UL 2933-2024 (TIPPSS, with ANSI approval on July 22, 2025) support secure integration patterns.
Downstream, solution delivery is led by system integrators and hospital IT and biomedical engineering teams that connect asset-location and telemetry streams into EHR and clinical engineering workflows. Distribution increasingly goes through procurement and logistics platforms and managed-services providers, including GHX for healthcare supply chain workflows, UPS Healthcare (Supply Chain Symphony) for logistics visibility, and Medtronic Integrated Health Solutions for materials management and hospital operations support. Recent hospital-level implementations, such as a December 2024 BLE tracking deployment at Perpignan Hospital (France) covering 800 devices across five floors, reflect a services-heavy delivery model (site surveys, RF planning, installation, integration, and ongoing monitoring) and the shift toward hybrid architectures that combine passive RFID for high-volume assets with active BLE/UWB for high-value mobile equipment.
Competitive Landscape
The wireless healthcare asset management market exhibits moderate concentration at the platform layer, where Zebra Technologies, CenTrak, Stanley Healthcare, and Impinj dominate EHR interoperability. Yet the tag and sensor tier is fragmented, with dozens of regional suppliers competing on battery life and form factor. Pure-play RTLS specialists face encroachment from enterprise Wi-Fi incumbents, as Cisco and Aruba bundle location services into access points, and semiconductor firms such as Qorvo and NXP embed UWB in commodity tags. The strategy centers on vertical integration into analytics, geographic expansion in the Asia Pacific through greenfield builds, and technology migration toward UWB for sub-meter accuracy.
Vendors are transitioning from one-time hardware sales to multiyear RTLS-as-a-Service contracts. Zebra’s 2024 report noted 31% growth in software and services driven by per-bed subscriptions. CenTrak partnered with Epic and Oracle Cerner to embed location data natively in EHR workflows, shortening time-to-value. Stanley Healthcare merged with AeroScout to consolidate its portfolios for infant security, staff duress, and asset tracking. Honeywell earned ISO 27001 in 2024, signaling security leadership that resonates with procurement teams obliged to follow CISA guidance.
Patent activity is brisk. The USPTO granted 127 healthcare location patents in 2024, representing a 38% year-over-year increase, with a focus on interference mitigation, battery optimization, and privacy-preserving algorithms.[4] Vendors demonstrating compliance readiness, predictive analytics, and flexible commercial models are best positioned to capture the expanding wireless healthcare asset management market.
Wireless Healthcare Asset Management Industry Leaders
-
AiRISTA Flow, Inc.
-
Aruba Networks (Hewlett Packard Enterprise Development LP)
-
Ascom Holding AG
-
Awarepoint Corporation
-
CenTrak, Inc.
- *Disclaimer: Major Players sorted in no particular order
Wireless Healthcare Asset Management Market Companies Covered in this Report
- AiRISTA Flow, Inc.
- Aruba Networks (Hewlett Packard Enterprise Development LP)
- Ascom Holding AG
- Awarepoint Corporation
- CenTrak, Inc.
- Cisco Systems, Inc.
- Cognosos, Inc.
- Decawave Limited
- GE Healthcare Technologies, Inc.
- HID Global Corporation
- Honeywell International Inc.
- Impinj, Inc.
- Intelligent InSites, Inc.
- Midmark Corporation
- Motorola Solutions, Inc.
- Securitas Healthcare USA, Inc.
- Siemens Healthineers AG
- Sonitor Technologies AS
- Stanley Black and Decker, Inc. (STANLEY Healthcare)
- TeleTracking Technologies, Inc.
- Zebra Technologies Corporation
Read Analysis of Wireless Healthcare Asset Management Companies
Market Opportunities and Future Outlook
White space is expanding where providers need faster deployment and less integration burden, particularly in facilities that cannot justify large up-front infrastructure refreshes. Composable RTLS architectures that reuse existing wireless footprints (for example, BLE positioning layered onto enterprise Wi-Fi deployments from Aruba or Cisco environments) reduce cabling requirements and support quicker rollout. Beyond basic asset finding, these approaches extend into utilization analytics, workflow and capacity optimization, and condition monitoring tied to pharmacy and sterility compliance.
Opportunities are also emerging where location data is fused with clinical process systems rather than treated as a standalone map. AiRISTA Flow's March 2026 integration of its Sofia RTLS platform with HPM by CLINARIS, linking RTLS to medical device hygiene and process management, points to demand for solutions that connect asset status (clean/dirty/ready) with operational governance and infection-control practices. At the same time, stronger cybersecurity expectations from the FDA (finalized June 2025 guidance on cybersecurity in medical devices) and continued alignment to standards-based interoperability (ISO/IEEE 11073 series) raise the requirements for vendors that can package SBOM-ready software, support secure device onboarding, and deliver integration-friendly APIs within subscription-oriented service models.
Recent Industry Developments in Wireless Healthcare Asset Management Market
- May 2026: Hewlett Packard Enterprise announced new autonomous networking capabilities for HPE Mist and HPE Aruba Central focused on real-time network diagnosis and resolution. For hospitals running RTLS, RFID, and BLE/UWB overlays on dense Wi-Fi infrastructure, autonomous operations reduce the operational friction that commonly slows scale-up across multi-site health systems.
- May 2025: Hewlett Packard Enterprise expanded its HPE Aruba Networking portfolio with new distributed services switches, including CX 10K models integrating AMD Pensando DPUs. Offloading security and telemetry functions at the network layer supports higher-density IoT and location workloads, aligning with healthcare requirements for reliable, segmented, and observable wireless environments.
- July 2024: Ascom and Almaviva signed a strategic collaboration agreement for the digitalization of care delivery in Italy centered on the Digistat platform. The partnership strengthens the application layer that consumes asset and patient-flow signals, reinforcing demand for integrated software platforms that connect clinical communications, operational workflows, and device data.
Wireless Healthcare Asset Management Market Report Scope and Research Methodology
Market Definition and Coverage
For this report, we define wireless healthcare asset management as the revenue earned from using wireless tags, sensors, and supporting software to locate, monitor, and manage hospital assets in near real time, including related deployment and support services where they are bundled with the solution.
Scope exclusions: We exclude manual or barcode-only asset tracking and general IT networking spend that is not purchased for asset visibility and management outcomes.
Segments Covered in This Report
-
By Product
- Asset Tags
- Wearable Tags
- Wireless Sensors
- Software Platforms
- Other Products
-
By Technology
- RFID
- Wi-Fi
- Bluetooth Low Energy
- Ultra-Wideband
- ZigBee and Other Technologies
-
By Application
- Asset and Inventory Tracking
- Patient and Staff Safety
- Environmental and Condition Monitoring
- Workflow and Capacity Optimization
- Compliance and Audit Trail Management
-
By End User
- Hospitals and Integrated Delivery Networks
- Ambulatory Surgery Centers
- Long-Term Care and Senior Living Facilities
- Diagnostic Laboratories and Imaging Centers
- Other Healthcare Institutions
-
By Geography
-
North America
- United States
- Canada
- Mexico
-
South America
- Brazil
- Argentina
- Rest of South America
-
Europe
- Germany
- United Kingdom
- France
- Italy
- Spain
- Russia
- Rest of Europe
-
Asia Pacific
- China
- Japan
- India
- South Korea
- Australia
- Rest of Asia Pacific
-
Middle East and Africa
-
Middle East
- Saudi Arabia
- United Arab Emirates
- Turkey
- Rest of Middle East
-
Africa
- South Africa
- Nigeria
- Egypt
- Rest of Africa
-
Middle East
-
North America
Data Sources, Market Sizing, and Validation
Desk Research
Desk research started with public healthcare utilization and infrastructure signals that help explain where tracking demand is strongest, such as CDC health care data, CMS reporting, and national health statistics releases in major countries. We also reviewed standards and guidance that shape wireless deployments and data handling in care settings, such as FDA communications for devices and cybersecurity-related guidance, along with NIST security publications.
To anchor product and adoption context, we used sources such as IEEE and peer reviewed journals for RFID, Wi-Fi, BLE, and RTLS performance trends, then checked customs and trade statistics for import-export movement of relevant electronics categories where helpful. Financial filings, investor presentations, reputable press, and association websites were used to cross check hospital digitization priorities and procurement cycles. In a few places, we used paid company financials and a patent database to confirm solution positioning and the direction of related innovation. These desk sources are not exhaustive, and many other public references were used for validation and clarification during the study.
Primary Interviews and Surveys
Primary work was used to test adoption timing, typical pricing logic, and how buyers separate tag and infrastructure budgets from broader hospital IT spending. We spoke with a mix of solution providers, system integrators, and hospital operations and biomedical teams across the Americas, EMEA, and APAC, so assumptions could be rechecked against real procurement and deployment patterns.
Distribution of primary research fieldwork respondents
| Company type | Respondent position | Region |
|---|---|---|
| Top tier: 26% | CXOs: 13% | APAC: 46% |
| Mid tier: 60% | Functional/Unit leaders: 43% | EMEA: 35% |
| Smaller Players: 14% | Managers: 44% | Americas: 19% |
Market-Sizing & Forecasting
Sizing followed a top-down and bottom-up logic, where the demand pool was first reconstructed from hospital and care network adoption of RTLS and asset tracking workflows, then shaped by attach rates of tags and sensors per facility and the share of sites using wireless location technologies. Once that picture was built, we corroborated totals with selective bottom-up checks, including sampled average selling price by tag and sensor type, typical software subscription ranges, and channel feedback on deployment services, so totals stayed realistic.
Inputs used in the model included rollout intensity of RTLS programs, replacement cycles for tags and batteries, mix shifts between RFID, Wi-Fi, BLE, ZigBee, and UWB setups, software penetration within installed systems, and service bundling rates in multi-site health systems. Forecasts were built using scenario analysis, because procurement timing, upgrade cycles, and compliance pressure can change faster or slower by region, and assumptions were further filtered through expert feedback on price progression and adoption speed. Where bottom-up signals were thin for smaller countries, gaps were handled through proxying from similar hospital density and digitization levels, then adjusted after interview rechecks.
Data Validation & Update Cycle
Outputs were validated by comparing modeled revenue to independent signals such as hospital digitization spend direction, deployment announcements, and the implied volume of tags and sensors needed per active site. Variance checks were run across regions and technology mixes, so unexpected jumps could be traced back to a clear driver, then the assumptions were reviewed again before sign-off.
Reports refresh annually, with interim updates when a material event changes pricing, regulation, or adoption patterns. Before delivery, a fresh pass is completed so the latest macro inputs and market signals are reflected in the final numbers clients receive.
Mordor Intelligence's Wireless Healthcare Asset Management Market Sizing Compared With Other Published Estimates
Published market sizes for this space can look far apart because sources do not always count the same revenue lines, and they also choose different base years and forecasting windows. The biggest swings usually come from how hardware, software, and services are bundled, plus whether the estimate reflects only hospital RTLS spend or a wider healthcare tracking universe.
Some estimates expand scope to include broad healthcare asset management and adjacent IT modules, which can lift the total quickly. In Mordor Intelligence's model, the total is counted only when spend is directly tied to wireless tags and sensors, plus the supporting asset visibility software and related implementation, with general hospital networking and non-wireless tracking kept out.
Benchmark comparison
| Source | Market Size | Gaps in Research Methodology |
|---|---|---|
| Mordor Intelligence | USD 74.96 B (2026) | |
| Industry Publisher A | USD 52.06 B (2025) | Uses a different base year and typically mixes in broader solution wording, which can shift what is counted as software and services versus only wireless tracking deployments. |
| Research Portal B | USD 4.34 B (2025) | Often appears to focus narrowly on one component layer (for example, software or limited RTLS revenue) and applies a slower growth curve, which keeps the total far below a full solution spend view. |
Taken together, the spread mainly reflects scope width, base-year selection, and how bundled services are treated. By keeping the model tied to observable deployment drivers like facility rollout intensity, technology mix, and tag replacement cycles, the estimate stays traceable to repeatable steps and clear inclusions.
Key Questions Answered in the Report
What is the current value of the wireless healthcare asset management market?
The market was valued at USD 74.96 billion in 2026 and is forecast to reach USD 213.88 billion by 2031.
Which product category is growing fastest?
Software Platforms are expanding at 25.95% CAGR as hospitals favor analytics-driven subscriptions.
Why is Ultra-Wideband gaining traction in hospitals?
UWB delivers sub-meter accuracy needed in surgical suites and catheter labs, driving a 26.05% CAGR through 2031.
Which region offers the highest growth opportunity?
Asia-Pacific is advancing at 25.9% CAGR due to government-mandated smart hospital programs in China and India.
How are vendors addressing high upfront costs?
Many suppliers now offer RTLS-as-a-Service models that convert capital expenditure into monthly per-tag fees, easing adoption for cost-sensitive facilities.