Market Overview
| Study Period | 2021 - 2031 |
|---|---|
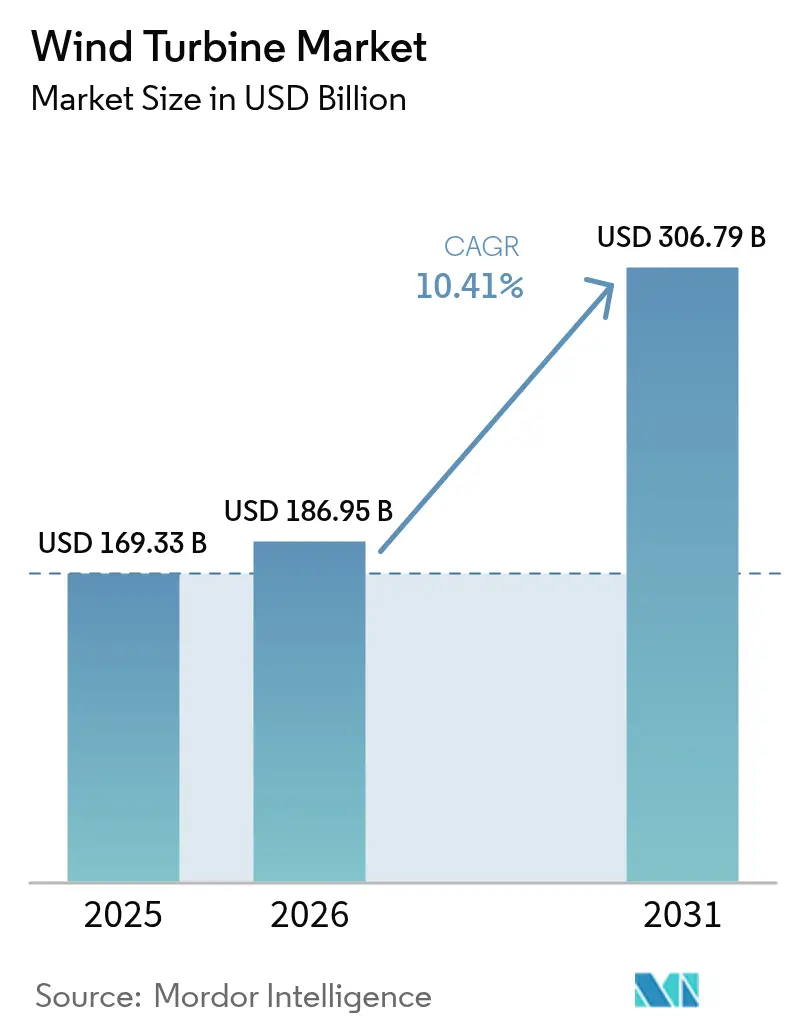
| Market Size (2026) | USD 186.95 Billion |
| Market Size (2031) | USD 306.79 Billion |
| Growth Rate (2026 - 2031) | 10.41% CAGR |
| Fastest Growing Market | Asia Pacific |
| Largest Market | Asia Pacific |
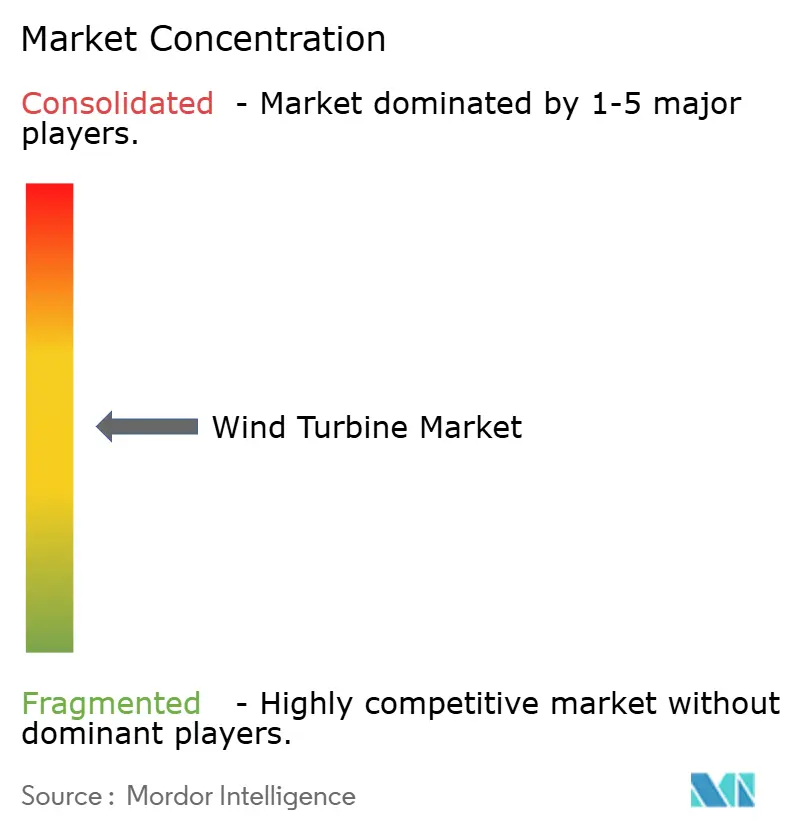
| Market Concentration | Medium |
Major Players *Disclaimer: Major Players sorted in no particular order Image © Mordor Intelligence. Reuse requires attribution under CC BY 4.0. | |
Wind Turbine Market Analysis by Mordor Intelligence
The Wind Turbine Market size was valued at USD 169.33 billion in 2025 and estimated to grow from USD 186.95 billion in 2026 to reach USD 306.79 billion by 2031, at a CAGR of 10.41% during the forecast period (2026-2031).
Growth is anchored in aggressive national renewable-energy mandates, steep LCOE declines for both onshore and offshore projects, and a steady shift toward turbines rated at 15 MW or higher that lift site energy density. Developers are also benefiting from wider access to green-bond financing, policy-driven demand for green hydrogen, and AI-enabled maintenance platforms that cut downtime by 35%. While onshore installations remain dominant, commercial-scale offshore installations, especially floating concepts, attract the fastest capital flows. The Asia Pacific supplies nearly half of the global market value, but the Middle East and Africa region is closing the gap, driven by record-low auction tariffs and multi-gigawatt build-outs.
Key Report Takeaways
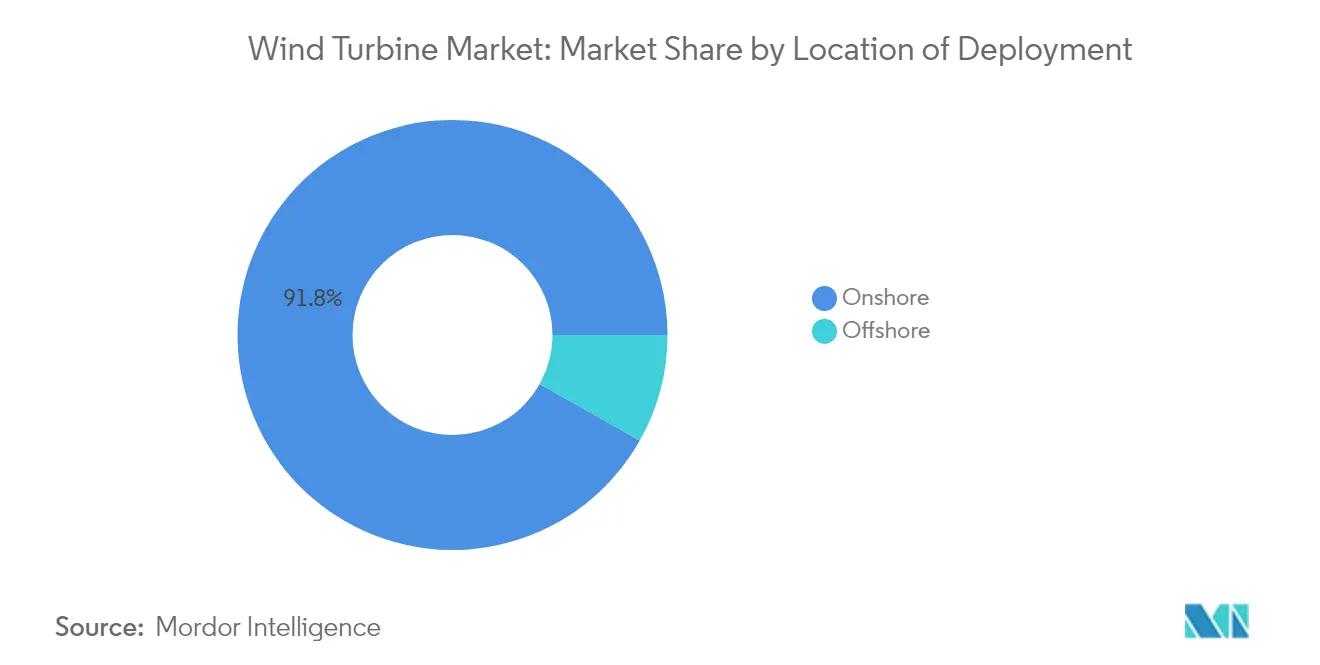
- By location of deployment, onshore projects accounted for 91.83% of 2025 revenue, while offshore installations are forecast to expand at a 18.95% CAGR through 2031.
- By capacity rating, large 1–5 MW machines held 45.85% of the wind turbine market share in 2025, and very large units above 5 MW are projected to rise at a 14.05% CAGR to 2031.
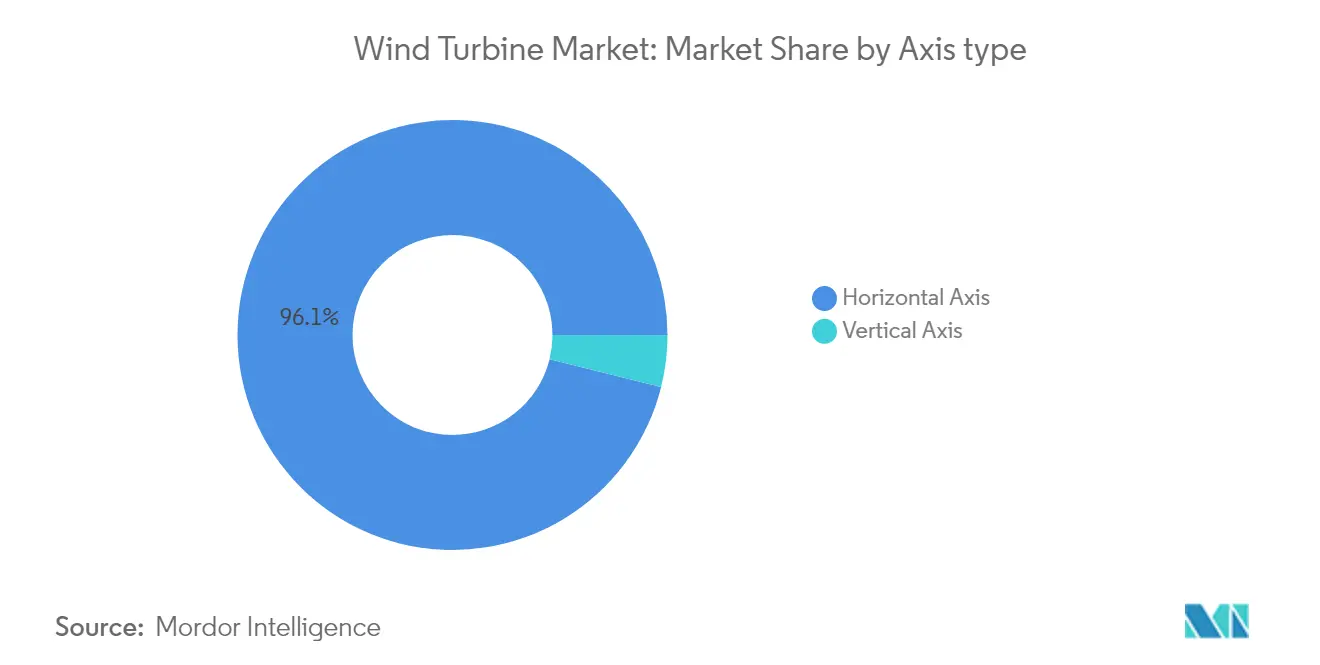
- By axis type, horizontal turbines captured 96.12% of the wind turbine market size in 2025, whereas vertical designs are advancing at a 12.55% CAGR over the outlook period.
- By component, rotor blades led with a 29.84% share of the 2025 value pool; power electronics and control packages are expected to post a 12.78% CAGR through 2031.
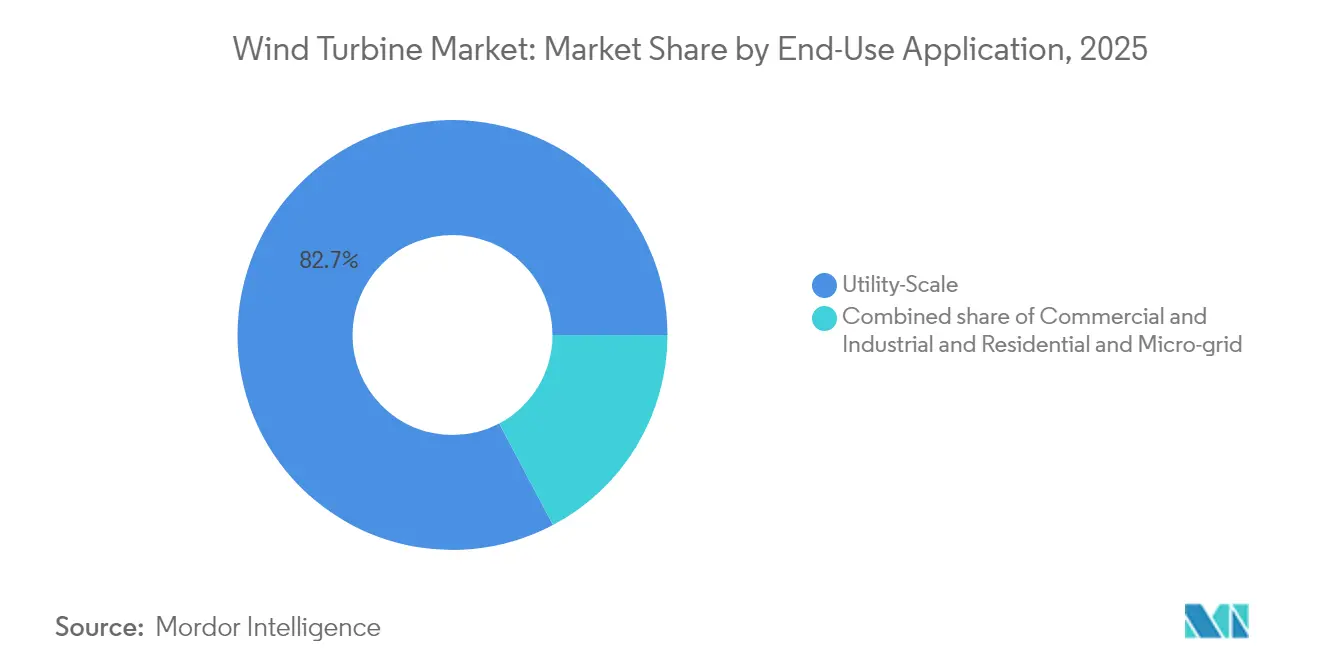
- By end-use application, utility-scale parks held 82.74% of 2025 revenue, while commercial & industrial systems are on track for a 15.05% CAGR to 2031.
- By geography, the Asia Pacific remained the largest contributor, with a 47.90% share in 2025, and the Middle East and Africa region is anticipated to log the fastest growth pace of 50.8% from 2026 to 2031.
Note: Market size and forecast figures in this report are generated using Mordor Intelligence’s proprietary estimation framework, updated with the latest available data and insights as of 2026.
Global Wind Turbine Market Trends and Insights
Drivers Impact Analysis*
| Driver | (~) % Impact on CAGR Forecast | Geographic Relevance | Impact Timeline |
|---|---|---|---|
| Escalating national renewable-energy targets | 2.8% | Global, with EU leading at 42.5% by 2030 | Medium term (2-4 years) |
| Rapid fall in onshore & offshore LCOE | 2.1% | Global, particularly Asia Pacific and Middle East | Short term (≤ 2 years) |
| Utility appetite for ≥15 MW turbines | 1.5% | North America, Europe, Asia Pacific offshore | Medium term (2-4 years) |
| Favourable green-hydrogen linkage policies | 1.0% | EU, Australia, Middle East hydrogen hubs | Long term (≥ 4 years) |
| Floating-wind bankability milestones | 1.9% | Europe, Asia Pacific, emerging in Americas | Long term (≥ 4 years) |
| AI-enabled predictive-maintenance savings | 0.8% | Global, concentrated in developed markets | Short term (≤ 2 years) |
| Source: Mordor Intelligence | |||
Escalating National Renewable-Energy Targets Drive Unprecedented Policy Support
The European Union now mandates 42.5% renewable electricity by 2030, while Spain aims for 81% and Greece sets comparable goals.[1]European Commission, “Renewable Energy Targets,” ec.europa.eu India added 3.4 GW of wind capacity in 2024 as part of its goal to reach 500 GW of non-fossil energy.[2]Ministry of New and Renewable Energy, “India Adds 3.4 GW Wind Capacity in 2024,” mnre.gov.in The United Kingdom’s Clean Power 2030 mission seeks 95% low-carbon generation, removing prior onshore wind curbs. These frameworks guarantee revenue via feed-in tariffs, certificates, and competitive auctions, thereby accelerating the wind turbine market. Long-term policy certainty also fosters domestic manufacturing and the localization of supply chains.
Rapid LCOE Decline Transforms Wind Energy Economics
Saudi Arabia’s latest tender cleared at USD 15/MWh, underlining how far onshore costs have fallen. Offshore trajectories are similar; floating wind is projected to reach 40 EUR/MWh by 2050 as rotors exceeding 180 m become standard. The average turbine rating reached 5,500 kW in 2024, resulting in reduced balance-of-plant expenses.[3]Global Wind Energy Council, “Global Wind Report 2025,” gwec.net Serial foundation fabrication, modular substations, and green-bond financing further compress unit costs. These trends entrench wind’s competitiveness against fossil and solar-plus-storage alternatives.
Utility Appetite for Mega-Turbines Reshapes Market Dynamics
Developers are increasingly specifying machines with capacities of≥15 MW, such as Siemens Gamesa’s 21 MW prototype and China’s first commercial 18 MW installation. Larger rotors harvest stronger winds aloft and reduce turbine counts, cutting O&M visits and crane mobilizations. Ports and jack-up vessels are upgrading to handle nacelles weighing over 500 tons, which opens up new revenue streams for logistics suppliers. This tilt toward mega-platforms raises the average capacity factor and enlarges the wind turbine market.
Green Hydrogen Integration Creates New Revenue Streams
The EU's Renewable Energy Directive now embeds hydrogen sub-targets, pushing developers to co-locate electrolysers with wind farms. Offshore North Sea projects plan direct-to-hydrogen export pipes to bypass grid bottlenecks, while Australia's Pilbara hub eyes similar models.[4]Policy Exchange, “Turning Wasted Wind into Hydrogen,” policyexchange.org.uk These schemes monetize surplus generation and hedge against price cannibalization, thereby deepening project bankability and broadening the wind turbine industry's footprint.
Restraints Impact Analysis*
| Restraint | (~) % Impact on CAGR Forecast | Geographic Relevance | Impact Timeline |
|---|---|---|---|
| Grid-connection queue bottlenecks | -1.2% | North America, Europe, Australia | Medium term (2-4 years) |
| Competition from utility-scale solar-plus-storage | -0.9% | Global, particularly sunny regions | Short term (≤ 2 years) |
| Rare-earth magnet supply security | -0.5% | Global, China dependency risk | Long term (≥ 4 years) |
| End-of-life blade-recycling costs | -0.4% | Europe, North America early adopters | Long term (≥ 4 years) |
| Source: Mordor Intelligence | |||
Grid Connection Bottlenecks Constrain Market Growth
U.S. interconnection queues swelled to 2,600 GW, and the UK faces 14-year wait times, which delay commissioning and inflate carrying costs.[5]Federal Energy Regulatory Commission, “Interconnection Queue Analysis,” ferc.gov Germany curtailed 9% of North Sea output in 2024 due to congestion. Although reforms, such as FERC Order 2023, aim to streamline approvals, transmission upgrades still lag behind wind build schedules, capping near-term additions.
Solar-Plus-Storage Competition Intensifies Market Dynamics
Utility solar secured 70% of new capacity in sun-rich regions, and the DOE expects battery costs to fall toward USD 0.05/kWh for long-duration storage.[6]U.S. Department of Energy, “Long-Duration Storage Roadmap,” energy.gov Dispatchable solar can undercut wind in peak-price hours, thereby forcing wind bids to lower levels. Hybrid layouts that pair wind with solar and storage can mitigate this risk; however, price competition remains a headwind for the wind turbine market.
*Our forecasts treat driver/restraint impacts as directional, not additive. The impact forecasts reflect baseline growth, mix effects, and variable interactions.
Segment Analysis
By Location of Deployment: Offshore Acceleration Despite Onshore Dominance
Onshore facilities continued to account for 91.83% of 2025 revenue, supported by mature supply chains and more streamlined permitting processes. Offshore projects, however, are projected to record a 18.95% CAGR and steadily raise their share of the wind turbine market size through 2031. Asia Pacific’s 10 GW (Japan) and 12 GW (South Korea) pipelines illustrate that floating concepts are rapidly scaling, unlocking high-wind deep-water sites and attracting insurers once skeptical of novel mooring systems.
Cost parity with onshore turbines is expected to be achieved by the mid-2030s, as modular hulls and serial foundation fabrication reduce capital expenditures. As grid congestion mounts onshore, coastal nations are utilizing offshore hubs to de-risk interconnection timelines, thereby further increasing their share of the offshore wind turbine market.


By Capacity Rating: Very Large Turbines Drive Market Evolution
Large units, 1-5 MW, retained a 45.85% share in 2025; however, models exceeding 5 MW are forecast to expand at a 14.05% CAGR, driven by utility demand for fewer, higher-output machines. Siemens Gamesa’s 21 MW concept and China’s 18 MW rollout highlight the tilt toward mega-platforms. Bigger rotors harness stronger winds aloft, lower O&M truck rolls, and enhance project economics, reinforcing the growth trajectory of the very-large class.
By Axis Type: Horizontal Dominance with Vertical Renaissance
Horizontal designs still supply 96.12% of global output as of 2025, backed by decades of aerodynamic refinement. Vertical axis turbines, although a small portion of the installed fleet, are advancing at a 12.55% CAGR as machine-learning controls and composite helical blades drive niche adoption in urban and offshore settings.
By Component: Power Electronics Outpaces Traditional Leaders
Rotor blades maintained a lead at 29.84% of the value in 2025, but power electronics and control packages are on pace for a 12.78% CAGR, reflecting demand for advanced grid-support functions, wide-bandgap semiconductors, and cybersecurity-hardened SCADA platforms.
By End-Use Application: Commercial Installations Challenge Utility Dominance
Utility-scale parks generated 82.74% of revenue in 2025; however, commercial and industrial systems are expected to grow at a rate of 15.05% annually through 2031, as corporations adopt virtual PPAs and onsite renewables to achieve science-based net-zero targets.
Geography Analysis
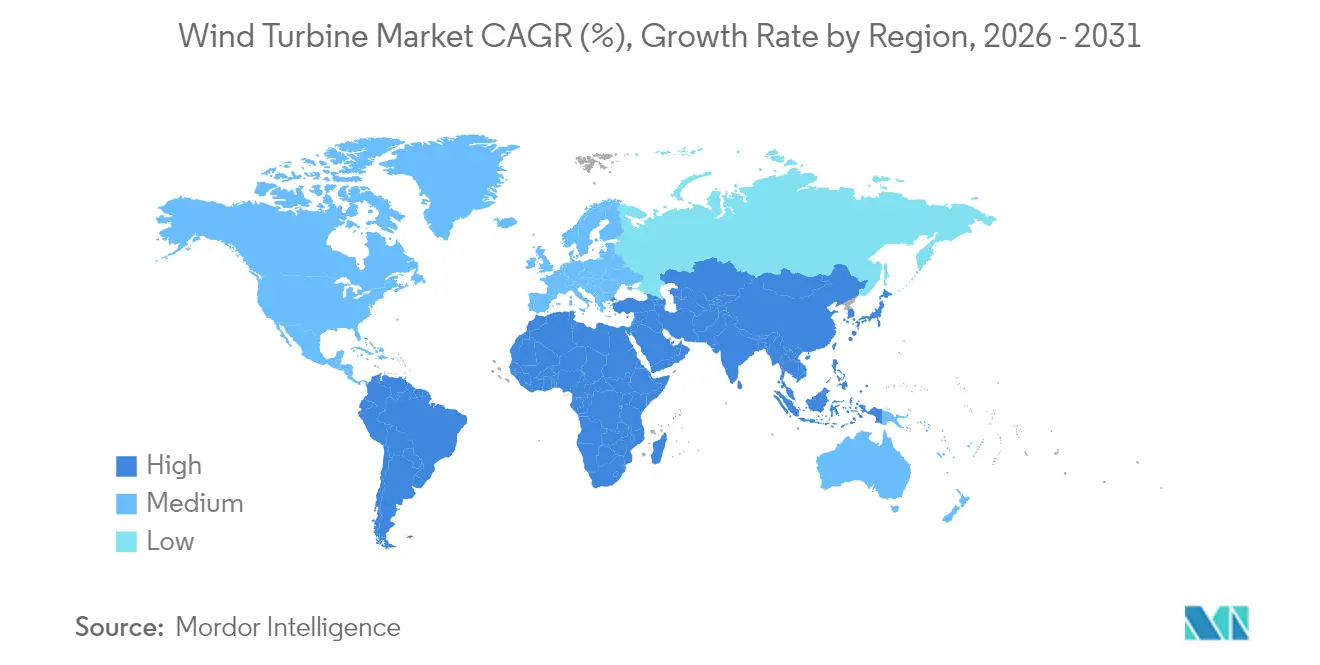
Asia Pacific accounted for 47.90% of the 2025 market value, energized by China’s domestic buildout, India’s 3.4 GW additions, and Japan’s floating push. The region’s 11.35% growth clip stems from local manufacturing depth and sustained policy incentives. Europe remains a technology pacesetter, with the EU’s 42.5% renewable mandate and robust offshore infrastructure keeping project momentum high.
The Middle East and Africa region is projected to be the fastest-expanding territory, buoyed by Egypt’s USD 10 billion 10 GW megaproject and Saudi tenders clearing at USD 15/MWh. North America is catching up on offshore potential as transmission rules evolve, while South America rides Brazil’s and Chile’s auction pipelines to deepen its regional role.

Competitive Landscape
Manufacturers connected a record 127 GW from 23,098 units in 2024, reflecting scale and fierce rivalry. Constellation Energy’s USD 27 billion acquisition of Calpine created a 60 GW clean-power behemoth, illustrating the sector’s consolidation wave. BP–JERA’s USD 5.8 billion venture targets 13 GW of offshore wind, while Saipem7’s (merger of Saipem and Subsea7) formation signals mounting M&A activity among service providers.
OEMs differentiate themselves through the launch of mega-turbines, AI-driven service contracts, and recyclable blade programs. The top five players control just over 80% of new installations, indicating a moderately concentrated structure that still allows regional challengers to gain share via price and local-content strategies.
Wind Turbine Industry Leaders
General Electric Company
Vestas Wind Systems A/S
Nordex SE
Suzlon Energy Limited
Siemens Gamesa Renewable Energy, S.A.
- *Disclaimer: Major Players sorted in no particular order

Recent Industry Developments
- February 2025: Constellation Energy finalized a USD 27 billion Calpine acquisition, amassing 60 GW of low-carbon capacity.
- February 2025: Saipem and Subsea7 agreed to merge as Saipem7, combining EUR 20 billion in revenue to chase offshore wind EPC orders.
- January 2025: Vestas landed a 384 MW order for Ukraine’s Tyligulska wind farm despite conflict headwinds.
- December 2024: BP and JERA launched JERA Nex BP to pursue 13 GW offshore assets.


Global Wind Turbine Market Report Scope
Wind turbines are a growing source of intermittent renewable energy, and they are employed in many nations to minimize energy costs and reliance on fossil fuels.
The wind turbine market is segmented by location of deployment, capacity, and geography. By location of deployment, the market is segmented into onshore and offshore. By capacity, the market is segmented into small, medium, and large. The analysis report also covers the market size and growth forecast for the wind turbine market across major regions, such as Asia-Pacific, North America, Europe, South America, and the Middle East and Africa.
For each segment, the industry size and forecasts are provided based on installed capacity (GW) and are extensively outlined in the report PDF.
By Location of Deployment
| Onshore | |
| Offshore | Fixed-bottom |
| Floating |
By Capacity Rating
| Small (Below 100 kW) |
| Medium (100 kW to 1 MW) |
| Large (1 to 5 MW) |
| Very Large (Above 5 MW) |
By Axis Type
| Horizontal Axis |
| Vertical Axis |
By Component
| Rotor Blades |
| Nacelle and Drivetrain |
| Generator |
| Tower |
| Power-Electronics and Control |
By End-Use Application
| Utility-Scale |
| Commercial and Industrial |
| Residential and Micro-grid |
By Geography
| North America | United States |
| Canada | |
| Mexico | |
| Europe | Germany |
| United Kingdom | |
| France | |
| Spain | |
| Russia | |
| Finland | |
| Sweden | |
| Tukey | |
| Netherlands | |
| Rest of Europe | |
| Asia Pacific | China |
| India | |
| Japan | |
| South Korea | |
| Australia | |
| Vietnam | |
| Rest of Asia Pacific | |
| South America | Brazil |
| Argentina | |
| Chile | |
| Rest of South America | |
| Middle East and Africa | Saudi Arabia |
| South Africa | |
| Egypt | |
| Morocco | |
| Rest of Middle East and Africa |
| By Location of Deployment | Onshore | |
| Offshore | Fixed-bottom | |
| Floating | ||
| By Capacity Rating | Small (Below 100 kW) | |
| Medium (100 kW to 1 MW) | ||
| Large (1 to 5 MW) | ||
| Very Large (Above 5 MW) | ||
| By Axis Type | Horizontal Axis | |
| Vertical Axis | ||
| By Component | Rotor Blades | |
| Nacelle and Drivetrain | ||
| Generator | ||
| Tower | ||
| Power-Electronics and Control | ||
| By End-Use Application | Utility-Scale | |
| Commercial and Industrial | ||
| Residential and Micro-grid | ||
| By Geography | North America | United States |
| Canada | ||
| Mexico | ||
| Europe | Germany | |
| United Kingdom | ||
| France | ||
| Spain | ||
| Russia | ||
| Finland | ||
| Sweden | ||
| Tukey | ||
| Netherlands | ||
| Rest of Europe | ||
| Asia Pacific | China | |
| India | ||
| Japan | ||
| South Korea | ||
| Australia | ||
| Vietnam | ||
| Rest of Asia Pacific | ||
| South America | Brazil | |
| Argentina | ||
| Chile | ||
| Rest of South America | ||
| Middle East and Africa | Saudi Arabia | |
| South Africa | ||
| Egypt | ||
| Morocco | ||
| Rest of Middle East and Africa | ||


Key Questions Answered in the Report
What is the projected wind turbine market size by 2031?
The market is expected to reach USD 306.79 billion by 2031 on a 10.41% CAGR trajectory.
Which deployment type will grow the fastest through 2031?
Offshore installations, particularly floating foundations, are forecast to post a 18.95% CAGR, the highest among deployment types.
Why are turbines larger than 5 MW gaining popularity?
Very-large platforms deliver higher capacity factors and cut per-MW installation and maintenance costs, improving project economics.
Which region currently dominates wind turbine spending?
Asia Pacific led with 47.90% of global value in 2025, driven by China and India.
What is the main obstacle slowing new wind projects?
Grid-connection queues, especially in North America and Europe, represent the most significant near-term bottleneck.
How is AI changing turbine operations?
Predictive-maintenance systems achieve 92% fault-prediction accuracy and trim downtime by roughly 35%, boosting asset returns.
Page last updated on:


