Market Overview
| Study Period | 2021 - 2031 |
|---|---|
| Forecast Data Period | 2026 - 2031 |
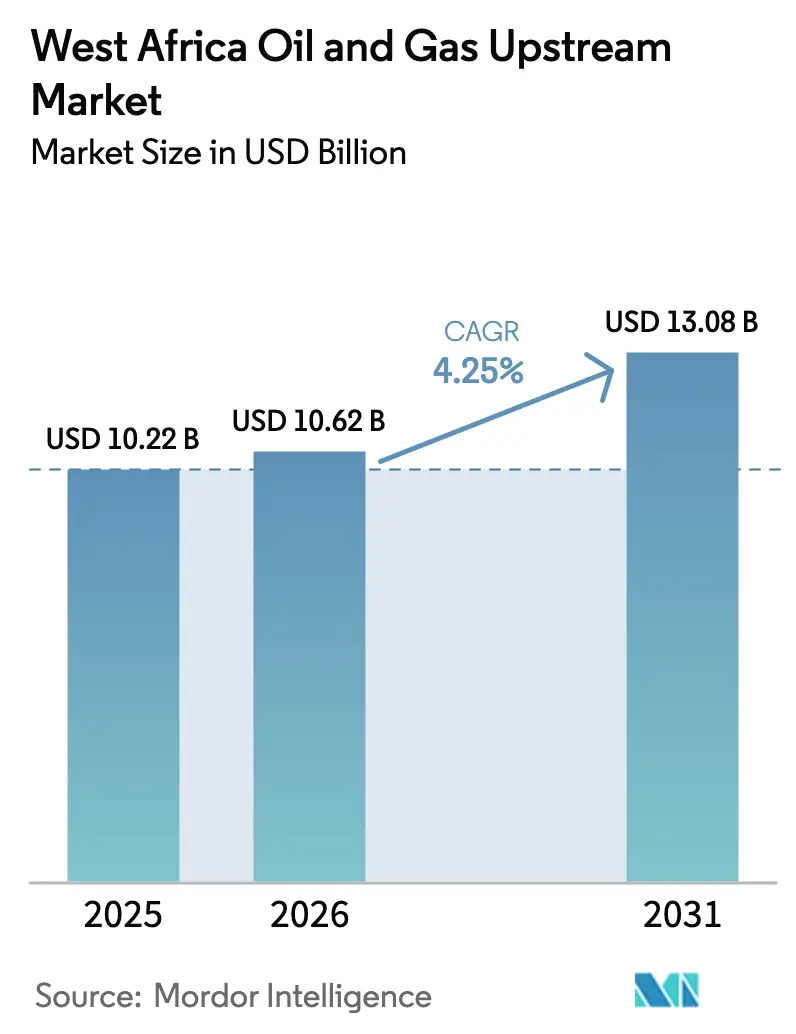
| Base Year Market Size (2025) | USD 10.22 Billion |
| Market Size (2026) | USD 10.62 Billion |
| Market Size (2031) | USD 13.08 Billion |
| Growth Rate (2026 - 2031) | 4.25% CAGR |
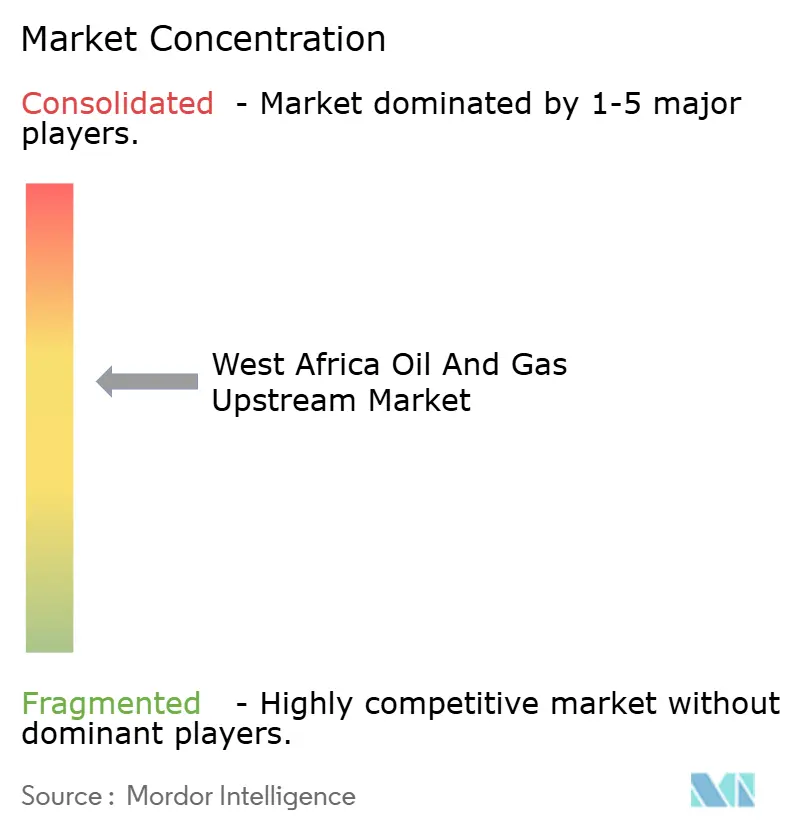
| Market Concentration | Medium |
Major Players *Disclaimer: Major Players sorted in no particular order Image © Mordor Intelligence. Reuse requires attribution under CC BY 4.0. | |
West Africa Oil And Gas Upstream Market Analysis by Mordor Intelligence
The West Africa Oil And Gas Upstream Market size is projected to be USD 10.22 billion in 2025, USD 10.62 billion in 2026, and reach USD 13.08 billion by 2031, growing at a CAGR of 4.25% from 2026 to 2031.
Offshore developments dominate present spending, but gas monetization projects, IOC divestments, and deep-water tie-backs with sub-USD 40 per-barrel breakevens are steering the growth trajectory. Nigeria’s Petroleum Industry Act removed decades-old fiscal uncertainty, unfreezing Final Investment Decisions that had stalled since 2019. Senegal and Mauritania validated the cross-border Greater Tortue Ahmeyim LNG model with the first cargo in April 2025, opening a template for stranded-gas commercialization across the basin. At the same time, rising private-sector security costs, OPEC quota ceilings, and an EU methane-fee regime inject risks that widen the performance gap between high-margin offshore hubs and capital-starved onshore assets.
Key Report Takeaways
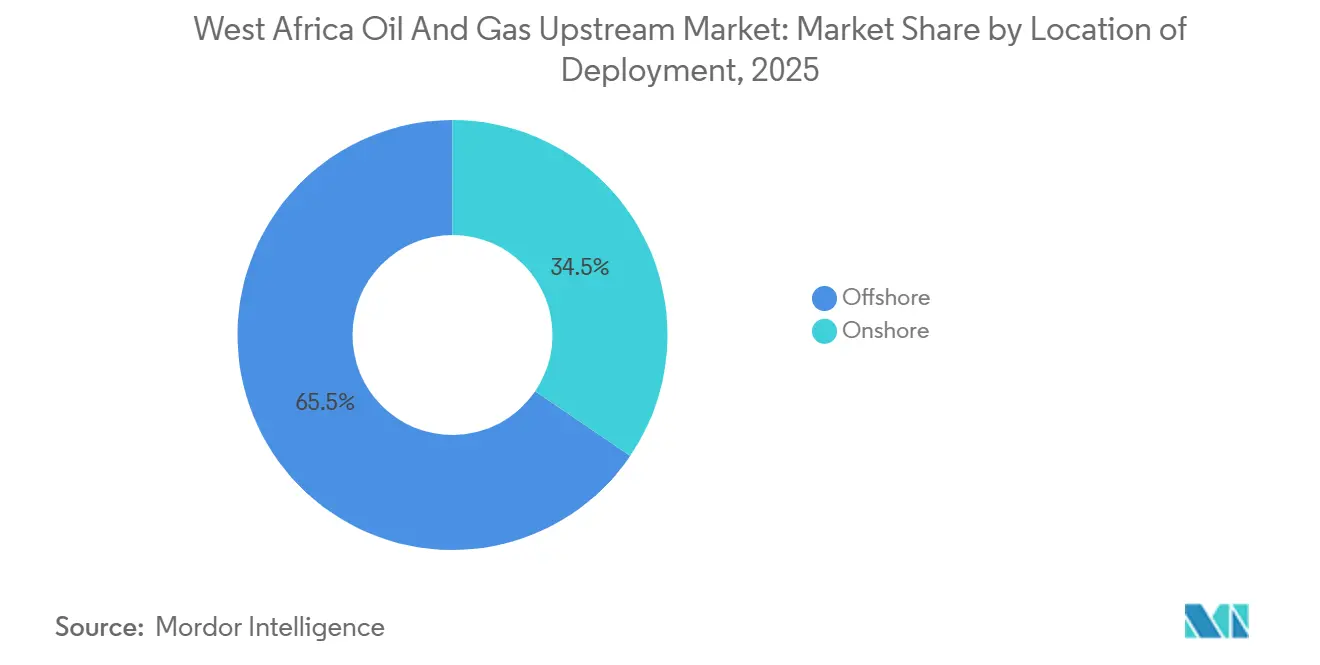
- By location of deployment, offshore developments held 65.5% of West Africa's oil and gas upstream market share in 2025 and will grow at a 6.5% CAGR through 2031.
- By resource type, natural gas is expected to grow at a 7.1% CAGR, outpacing crude oil's 62.1% revenue lead in 2025, driven by Nigeria LNG Train 7 and Greater Tortue Ahmeyim.
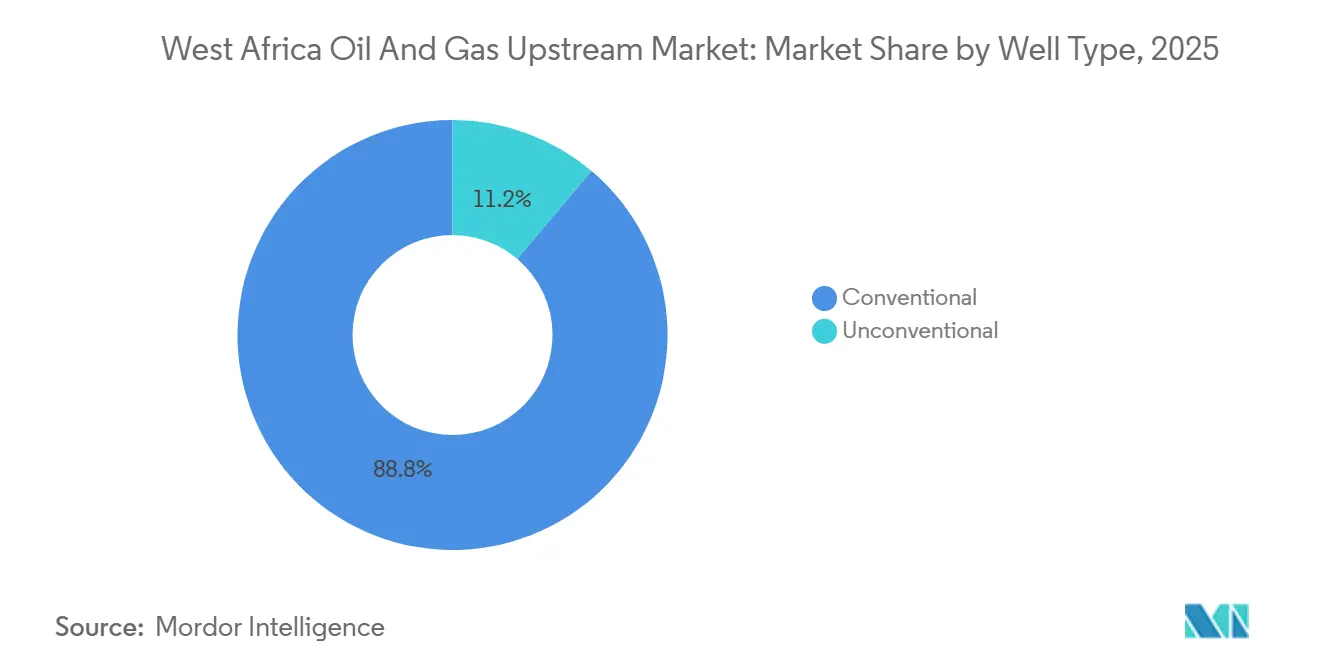
- By well type, unconventional deep-water projects represented 11.2% of activity in 2025, yet will expand at a 7.7% CAGR on the back of Senegal's Sangomar and Nigeria's Bonga Southwest developments.
- By service, development and production services retain 70.7% revenue share in 2025, while decommissioning is forecast to lead growth at an 8.8% CAGR through 2031.
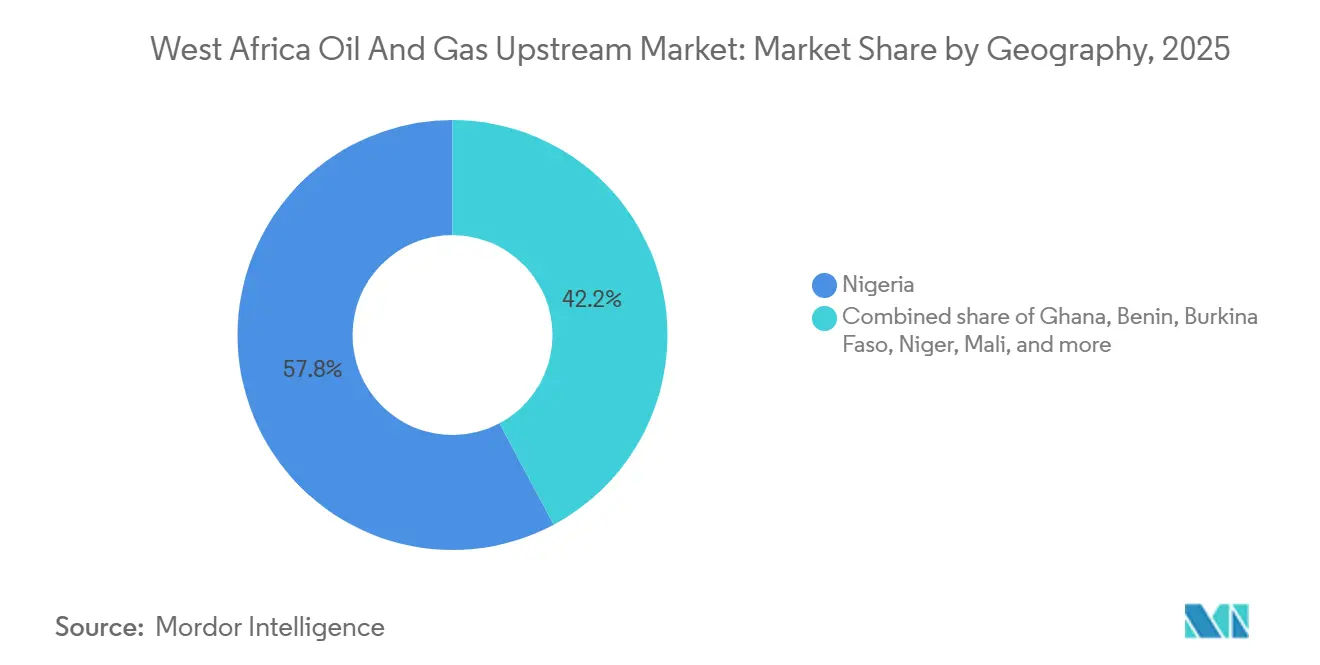
- By geography, Nigeria controlled 57.8% of West Africa's oil and gas upstream market size in 2025, whereas Ghana is projected to post the fastest 7.4% CAGR to 2031.
Note: Market size and forecast figures in this report are generated using Mordor Intelligence’s proprietary estimation framework, updated with the latest available data and insights as of January 2026.
West Africa Oil And Gas Upstream Market Trends and Insights
Drivers Impact Analysis*
| Driver | (~) % Impact on CAGR Forecast | Geographic Relevance | Impact Timeline |
|---|---|---|---|
| Deep-water discoveries unlocking low-breakeven barrels | +1.2% | Senegal, Mauritania, Nigeria (offshore), Ghana | Medium term (2-4 years) |
| Fiscal reforms (e.g., Nigeria PIA) lifting investment attractiveness | +0.9% | Nigeria, with spillover to Ghana, Benin | Short term (≤ 2 years) |
| LNG export build-out (GTA, NLNG 7) spurring gas developments | +0.8% | Nigeria, Senegal, Mauritania, regional cross-border zones | Medium term (2-4 years) |
| Rise of pan-African energy banks filling capital gap | +0.5% | Nigeria, Ghana, Senegal, Mauritania | Long term (≥ 4 years) |
| Digital subsurface data hubs and open licensing platforms | +0.3% | Nigeria, Ghana, Benin | Short term (≤ 2 years) |
| IOC divestments creating brown-field upside for independents | +0.6% | Nigeria (onshore and shallow-water), Ghana | Medium term (2-4 years) |
| Source: Mordor Intelligence | |||
Deep-Water Discoveries Unlocking Low-Breakeven Barrels
Senegal’s Sangomar achieved first oil in June 2024 and climbed to 100,000 barrels per day in early 2025, delivering a 25% internal rate of return at USD 60 Brent after sidestepping standalone FPSO costs through subsea tie-backs. Nigeria’s Bonga Southwest, sanctioned in December 2024, mirrors the architecture by tying 20 wells into the existing Bonga FPSO, lowering breakeven to USD 35 per barrel and shortening payback to four years.[1]Ed Crooks, “Subsea tie-backs cut Bonga Southwest breakeven,” SHELL.COM Mauritania’s Greater Tortue Ahmeyim Phase 2 will add 2.5 million t pa of LNG by sharing floating infrastructure with Senegal, halving per-ton capital intensity relative to greenfield schemes. These unit-cost wins attract fresh liquidity, such as Afreximbank’s USD 5 billion facility dedicated to gas monetization and subsea packages announced in 2024.[2]Staff Report, “Afreximbank commits USD 5 billion to energy,” AFREXIMBANK.COM As a result, deep-water projects now rival U.S. shale on cost curves, repositioning West Africa within global supply stacks.
Fiscal Reforms Lifting Investment Attractiveness
Nigeria's Petroleum Industry Act replaced opaque joint-venture terms with production-sharing contracts and a progressive 7.5-10% royalty ladder that rewards deeper, smaller fields.[3]Nigeria launches upstream data portal,” NUPRC.GOV.NG The inaugural 2024 licensing round raised USD 1.8 billion in signature bonuses and committed to 8,500 km² of new 3D seismic. Lower fiscal risk shaved the project's weighted-average cost of capital to 12-14%, down from 18-20% pre-PIA, according to independent operator models. Ghana launched a digital licensing portal in January 2025, broadcasting reserve and production histories that previously circulated only in closed data rooms.[4]Ghana’s open licensing platform goes live,” GNPCGHANA.COM Early evidence shows bid-preparation times falling from 18 months to six, broadening the investor base beyond traditional IOCs.
LNG Export Build-Out Spurring Gas Developments
The first Greater Tortue Ahmeyim cargo in April 2025 demonstrated a 50-50 cross-border revenue split that made a 2.4 million t pa FLNG unit bankable for Senegal and Mauritania. Nigeria LNG Train 7, 80% complete as of mid-2025, will add 8 million t pa and lift national capacity to 30 million t pa by 2027. Nigeria’s domestic gas obligation compels producers to supply 12% of output locally, underpinning plans for 5 GW of new gas-fired power by 2028. Flaring penalties rose to USD 2 per thousand standard cubic feet in 2024, improving project economics for associated gas. In combination, export and domestic outlets reduce stranded-asset risk that had previously discouraged upstream gas drilling.
Rise of Pan-African Energy Banks Filling Capital Gap
Western banks cut sub-Saharan oil and gas project finance by 40% between 2020-2024 under tighter ESG mandates. Afreximbank stepped in with a USD 5 billion energy facility in February 2025, channeling funds to FLNG hulls and subsea hardware. Western ECAs now decline to participate. The African Development Bank approved USD 300 million for Nigeria’s Ajaokuta-Kaduna-Kano gas line in early 2025 despite donor pressure to pivot away from hydrocarbons. Trade-finance structures allowing pre-export crude monetization at 85% of spot prices are increasingly popular among independents. Together, regional lenders are cushioning the capital crunch and shortening time-to-FID for mid-scale schemes.
Restraints Impact Analysis*
| Restraint | (~) % Impact on CAGR Forecast | Geographic Relevance | Impact Timeline |
|---|---|---|---|
| Militancy, theft & sabotage along Niger-Delta pipelines | -0.7% | Nigeria (onshore and shallow-water Niger Delta) | Short term (≤ 2 years) |
| OPEC quotas and price volatility dampening drilling plans | -0.5% | Nigeria, with indirect effects on regional service markets | Medium term (2-4 years) |
| Western-bank ESG pull-back tightening project finance | -0.4% | Nigeria, Ghana, Senegal, Mauritania | Long term (≥ 4 years) |
| EU methane-fee regime raising compliance costs | -0.3% | Nigeria, Senegal, Mauritania (LNG exporters to EU) | Medium term (2-4 years) |
| Source: Mordor Intelligence | |||
Militancy, Theft & Sabotage Along Niger-Delta Pipelines
Nigeria lost USD 3.3 billion to crude theft between 2023-2024, cutting flows 200,000 bpd below its OPEC cap until military interventions restored volumes late 2024. A March 2025 sabotage of a Bonny Island feed-gas line forced a 20% NLNG output cut, spotlighting continued vulnerability. Operators now budget USD 50-80 million yearly for private security, drones, and community programs that double as protection payments. Rising costs erode margins for onshore producers and accelerate IOC divestments. Persistent vandalism, therefore, drags drilling sentiment and redirects capital to offshore basins that bypass onshore pipelines entirely.
OPEC Quotas & Price Volatility Dampening Drilling Plans
Nigeria’s 1.5 million bpd OPEC ceiling remains in force through 2026 after a failed push for 2 million bpd in 2025. The cap discourages incremental onshore drilling because new barrels cannot be marketed without broader group consent. Operators favor deep-water fields where unit margins justify fixed FPSO costs within quota limits. Brent’s USD 70-95 swing in 2024-2025 compounded uncertainty, causing only one Nigerian exploration spud versus three in Ghana, which is unconstrained by OPEC. The quota dynamic, therefore, diverts exploration capital toward non-OPEC neighbors and tightens regional service utilization.
*Our forecasts treat driver/restraint impacts as directional, not additive. The impact forecasts reflect baseline growth, mix effects, and variable interactions.
Segment Analysis
By Location of Deployment: Subsea Tie-Backs Drive Offshore Gains
Offshore projects captured 65.5% of West Africa's oil and gas upstream market share in 2025 and are set to expand at a 6.5% CAGR to 2031. The West Africa oil and gas upstream market size related to offshore activity is forecast to climb in tandem as tie-back economics unlock breakevens below USD 40 per barrel. Nigeria's Bonga Southwest employs existing FPSO infrastructure to cut upfront costs, whereas Senegal's Sangomar leverages leased units to deliver 25% internal rates of return. Modularity stands out; Ghana's 80,000 bpd Agogo FPSO, scheduled for 2026 first oil, can be redeployed if reserves fall short.
Onshore output remains material yet structurally challenged. Niger-Delta security premiums add USD 5-8 per-barrel logistics and security costs, compelling some producers to bypass vandalized lines with barges. Shell's USD 2.4 billion divestment to Renaissance underscores the widening risk-adjusted returns gap. Frontier onshore plays, such as Niger's Agadem, stay viable by using dedicated export lines isolated from Delta risks. Even so, capital gravitates offshore where political and logistical hurdles are comparatively lighter and digital monitoring lowers non-technical risk.


By Resource Type: Gas Monetization Narrows Crude’s Lead
Crude oil generated 62.1% of 2025 revenue, but natural gas will grow at a 7.1% CAGR, propelled by LNG projects and domestic supply mandates. The West Africa oil and gas upstream market size tied to gas is slated to expand sharply once Nigeria LNG Train 7’s 8 million t pa module and Greater Tortue Ahmeyim Phase 2 come on-stream. Domestic obligations guarantee a regulated floor price: Nigeria targets 5 GW of new gas power by 2028, absorbing 1.2 bcf/d at steady-state.
Crude retains primacy because refining bottlenecks force an export orientation. Nigeria’s 650,000 bpd Dangote plant, online in 2024, covers only a fraction of national output. Geological endowment also matters; 25 tcf of proven gas pales beside 37 billion barrels of oil on an energy-equivalent basis. Still, improved flaring penalties and multi-market outlets are tipping drilling schedules toward gas, tightening the crude-gas revenue gap year over year.
By Well Type: Deep-Water Unconventional Gains Share
Conventional wells formed 88.8% of activity in 2025, yet unconventional deepwater wells are growing 7.7% annually. Senegal’s Sangomar uses subsea trees rated for 3,000 psi at 10,000-ft depths, a technology unaffordable pre-2020 cost resets. Nigeria’s ultra-deep Egina satellites illustrate further scope, blending high-pressure completions with single-lift subsea manifolds to cut rig days.
Conventional maturity still drives cash flow. Reactivating shut-in wells at USD 2-5 million compares favorably with USD 70 million drilling tickets offshore. Enhanced oil recovery in shallow water offers quick, low-risk barrels, fitting smaller independents’ balance sheets. However, falling subsea hardware costs and the need for deepwater leasing models gradually tilt spending to unconventional zones, narrowing the activity gap through 2031.
By Service: Decommissioning Emerges as Growth Leader
Development and production services command 70.7% of spending thanks to FPSO leases and multi-year subsea contracts. Even so, decommissioning will log the fastest 8.8% CAGR as Nigeria enforces post-cessation plugging rules and aging Mauritanian fields enter retirement. Petrofac’s USD 60 million Chinguetti contract and Helix Energy’s USD 45 million Bonga abandonment underscore a compliance-driven backlog.
Exploration services shrink in relative terms because seismic reprocessing and tie-back strategies reduce greenfield wildcats. Long-term production support remains sticky revenue; FPSO O&M contracts typically span a decade, delivering predictable cash flows that buffer service providers against cyclical downturns. Decommissioning’s ascent therefore diversifies the service mix and supports capacity utilization even when drilling cycles soften.
Geography Analysis
Nigeria held 57.8% of 2025 revenue, anchored by 1.6 million bpd production and a projected 30 million t pa LNG slate once Train 7 finishes in 2027. The 2024 block round raised USD 1.8 billion in bonuses, signaling renewed investor appetite under the PIA. Risks persist: OPEC caps output at 1.5 million bpd through 2026, and theft removed USD 3.3 billion in crude value during 2023-2024. IOC exits to Renaissance and Seplat exemplify a structural pivot toward leaner independents willing to manage security risk. Nigeria’s digital licensing portal further lowers barriers by offering open data on 178 marginal fields.
Ghana is the fastest-growing geography at 7.4% CAGR through 2031. The Agogo FPSO, Jubilee, and TEN license extensions, and transparent fiscal terms, attract capital unconstrained by OPEC quotas. The Ghana National Petroleum Corporation’s 2025 digital platform halves bid-cycle time, drawing bids from commodity traders and mid-cap E&Ps. Stable politics and absence of militant activity differentiate Ghana from its larger neighbor.
Senegal and Mauritania add incremental heft via Sangomar’s 100,000 bpd plateau and Greater Tortue Ahmeyim’s 2.4 million t pa FLNG volume. Subsea tie-backs and shared infrastructure cut unit costs, encouraging frontier licensing in Benin and Niger’s Agadem basin. Landlocked Burkina Faso and Mali remain in pre-drill seismic stages with no material activity.
Regulatory Landscape
West Africa upstream regulation is tightening around fiscal accountability, licensing transparency, and local content, with Nigeria and Ghana shaping much of the basin's direction. In Nigeria, the upstream framework continues under the Petroleum Industry Act (PIA), and Presidential Executive Order 9 (signed February 13, 2026) introduced a stricter petroleum-revenue remittance regime by directing specified proceeds to the Federation Account and limiting statutory retentions by NNPC Limited. A Federal Government implementation committee held its inaugural meeting on February 26, 2026 to operationalize the order.
Across the region, regulators are also trying to reduce rule fragmentation for multi-country operators. The West Africa Regulators Forum (WARF), established in July 2025, supports cross-border regulatory cooperation, while Ghana's Petroleum Commission (under Act 919) continues to enforce local content through mechanisms including Channel Partnership and Strategic Alliance guidelines, alongside the established Joint Venture Company approach for foreign service firms. Together, these instruments, and Ghana regulator-led efforts to resolve cross-agency hurdles (including with the Ghana Revenue Authority and Bank of Ghana noted in early 2026), define compliance requirements for upstream operators and service companies spanning offshore and onshore portfolios.
Competitive Landscape
Top-five operators, Shell, TotalEnergies, Eni, Chevron, and Nigerian National Petroleum Company, controlled roughly 55% of 2025 regional output, leaving the West Africa oil and gas upstream market moderately fragmented. Shell’s USD 2.4 billion divestment to Renaissance and ExxonMobil’s USD 1.3 billion exit to Seplat are redistributing onshore barrels to independents with 30-40% lower overhead. Majors are doubling down on deep-water mega-projects like Bonga Southwest and Sangomar, banking on subsea tie-backs to stretch existing FPSOs.
Service white space lies in decommissioning, where Petrofac and Helix Energy secured contracts worth USD 105 million between October 2024 and March 2025. Emissions-monitoring tech is another focus; Nigeria LNG invested USD 40 million in 2024 to comply with the EU methane rule. Private-equity-backed entrants employ machine learning to mine open data sets and cherry-pick bypassed pay in mature assets, illustrated by Savannah Energy’s 2024 Chad deal, unlocking 40 million barrels.
Capital scarcity intensifies rivalry: Western banks’ 40% lending pullback forces self-funding or high-yield debt, favoring incumbents with strong balance sheets. The resulting structure features capital-heavy majors upstream and nimble independents midstream, each exploiting niches aligned with risk tolerance and financing access.
West Africa Oil And Gas Upstream Industry Leaders
TotalEnergies SE
Eni SpA
Exxon Mobil Corporation
Nigerian National Petroleum Corporation
Shell Plc
- *Disclaimer: Major Players sorted in no particular order

Market Opportunities and Future Outlook
Gas-linked upstream opportunities are widening as export and domestic offtake pathways become more tangible through named projects and infrastructure actions. In Nigeria, the completion of the OB3 gas pipeline River Niger crossing (April 2026) improves domestic gas transport reliability, which matters for producers balancing LNG-led growth with domestic gas obligations and flaring-penalty economics. On the commercialization side, UTM Offshore advanced an indigenous FLNG pathway by signing a gas sales agreement with Seplat Energy and NNPC for a floating LNG project (July 2026), adding another monetization route for associated and non-associated gas beyond traditional pipeline-based evacuation.
Offshore brownfield and phased deep-water developments also create room for development and production services, subsea packages, and drilling campaigns that build on existing hubs. ExxonMobil's announced USD 1 billion Usan infill investment offshore Nigeria (July 2026) points to continued operator appetite for additional barrels with shorter cycle times within established infrastructure. Eni's approved Baleine Phase 3 investment offshore Cote d'Ivoire (May 2026, USD 4 billion) expands an integrated oil and gas development model that supports both liquids and gas handling, and ongoing IOC-to-independent asset transfers in Nigeria continue to lift demand for field-life-extension work, reservoir surveillance, and emissions-compliance solutions, particularly for operators managing EU methane-related compliance requirements and higher security costs onshore.
Recent Industry Developments
- July 2026: ExxonMobil announced a USD 1 billion final investment decision for an infill drilling project at the Usan field (OML 138) offshore Nigeria, targeting an additional 40,000 barrels per day. The decision highlights renewed deep-water capital allocation toward brownfield barrel additions that use established infrastructure and shorten cycle times versus greenfield developments.
- May 2026: Eni approved the Phase 3 investment for the Baleine project offshore Cote d'Ivoire, a USD 4 billion expansion that increases the scale of an integrated oil and gas hub development. The sanctioning supports phased offshore developments in sustaining regional activity and pulls through demand for subsea, drilling, and production-system services tied to multi-well programs.
- December 2024: Shell agreed to divest its Nigerian onshore and shallow-water assets to Renaissance, shifting operatorship exposure toward an independent-led model. The transaction accelerated Nigeria's onshore risk management transformation, with implications for near-term field optimization spend, security budgeting, and decommissioning and integrity work on mature infrastructure.


Research Methodology Framework and Report Scope
Market Definition and Coverage
For this study, the market represents the revenue-linked value of upstream oil and gas activity in West Africa, covering exploration, field development, production operations, and upstream-related project work across onshore and offshore assets.
Scope exclusions: We exclude midstream transport and storage, downstream refining and marketing, and most non-upstream power and petrochemicals activity even when it sits near producing basins.
Segmentation Overview
- By Location of Deployment
- Onshore
- Offshore
- By Resource Type
- Crude Oil
- Natural Gas
- By Well Type
- Conventional
- Unconventional
- By Service
- Exploration
- Development and Production
- Decomissioning
- By Geography
- Nigeria
- Ghana
- Benin
- Burkina Faso
- Niger
- Mali
- Rest of West Africa
Data Sources, Market Sizing, and Validation
Desk Research
Desk research is used to build the starting fact base on upstream activity and to set realistic guardrails around volumes, projects, and timing. We lean on public datasets such as OPEC and EIA production series, IEA energy balances, and World Bank macro indicators to align demand signals with country fundamentals.
To ground project activity, we also review operator and regulator releases, licensing round notices, and country petroleum agency publications where available, followed by annual reports, 10-K style filings, and investor decks for upstream spend direction. Trade press and association sites help confirm project milestones and contract awards, while paid subscriptions for company financials and news intelligence, patent lookups, and shipment-level import export signals are used to validate directionally sensitive inputs. The sources listed here are illustrative only, and many other public documents were also consulted for cross-checking and clarification.
Primary Interviews and Surveys
Primary work focuses on converting activity signals into usable sizing assumptions, especially where public reporting is delayed or inconsistent by country. We speak with upstream operators, EPC and drilling participants, oilfield service providers, and local advisers across the region so the model reflects how work is contracted, priced, and recognized in revenue.
Respondent input is used to confirm project timing, typical cost splits between exploration and development, and how offshore programs differ from onshore work in pace and commercial structure. We then re-test the assumptions when responses diverge by geography.
Distribution of primary research fieldwork respondents
| Company type | Respondent position | Region |
|---|---|---|
| Top tier: 25% | CXOs: 12% | |
| Mid tier: 60% | Functional/Unit leaders: 41% | |
| Smaller Players: 15% | Managers: 47% |
Market-Sizing & Forecasting
The sizing starts with a top-down build that reconstructs upstream spend from production outlook and project pipelines across West Africa, and then maps those activity levels to the service and development work that drives market value. Once that structure is set, selective bottom-up checks are added using sampled project budgets, supplier and contractor revenue exposure, and a price times volume sense-check so totals can be adjusted where the first pass looks stretched.
Key inputs we track include crude oil and natural gas production trends, active rig and well activity direction, offshore versus onshore project mix, typical development cycle timing, and unit cost movements for drilling and subsea intensive work. Where data gaps exist for smaller countries, proxy assumptions are applied using nearby basin analogs and then moderated through interview feedback so the regional total does not get overfit to one large market.
For forecasting, scenario analysis is used so oil price paths, sanctioning pace, and offshore project delays can be reflected without forcing one single straight-line view. Assumptions are kept practical so any analyst can reproduce the steps using the same public indicators and the same interview-driven conversion ratios.
Data Validation & Update Cycle
Outputs are validated through multiple checks, including year-on-year movement tests, share-of-spend sanity checks against known project schedules, and comparisons to independent signals like production direction and announced capex shifts. When a country estimate moves sharply, it is flagged, reworked, and the underlying driver is traced back to either a project timing change, a price assumption, or a scope boundary issue.
Before sign-off, the model and assumptions are reviewed in steps by another analyst, and interview follow-ups are triggered if a key input falls outside expected ranges. Reports are refreshed annually, and interim updates are made when material events occur, such as major project sanctions, delays, fiscal rule changes, or disruptive price swings. Right before delivery, a final pass is completed so the latest publicly visible changes are reflected in the numbers.
Mordor Intelligence's West Africa Oil and Gas Upstream Market Size Measured Against Other Published Estimates
Published market values for West Africa upstream can vary a lot, even when they look like they are describing the same topic. The differences usually come from what is counted as upstream value, how prices are converted into USD, and whether the estimate is anchored to observable activity or to broad industry spending narratives.
In this market, the biggest gap drivers are refresh cadence and currency timing around oil price swings, followed by how offshore mega-project spend is recognized across years, and then the pricing logic used to translate activity into value. A refresh-led workflow that rechecks project timing and unit-cost signals close to publication, and then locks the USD conversion window consistently, is what keeps Mordor Intelligence aligned with the 2025 demand pool rather than a blended multi-year average.
Benchmark comparison
| Source | Market Size | Gaps in Research Methodology |
|---|---|---|
| Mordor Intelligence | USD 10.22 B (2025) | |
| Global Consultancy A | USD 80.00 B (2023) | The figure is presented for the wider West Africa oil and gas market, which likely blends upstream with midstream and downstream value, and it is not tied to an upstream activity to value conversion for a single base year. |
| Regional Consultancy B | USD 75.00 B (2024) | The estimate appears to treat upstream as a broad spending pool, which can inflate totals when large multi-year offshore programs are counted at headline budget levels instead of being timed to yearly execution and realized service value. |
The comparison shows that scope and timing explain most of the spread, not just different growth assumptions. By keeping the boundary on upstream activities and anchoring value to production and project execution signals in a defined year, the model stays easier to audit and more repeatable when new project updates come in.


Key Questions Answered in the Report
How large is West Africa’s upstream spending today and how fast is it expected to grow?
Spending equals USD 10.62 billion in 2026 and is projected to rise to USD 13.08 billion by 2031, reflecting a 4.25% CAGR.
Which country attracts the bulk of upstream capital in the region?
Nigeria draws 57.8% of 2025 expenditure thanks to 1.6 million bpd crude output, expanding LNG capacity, and the investor-friendly Petroleum Industry Act.
What makes deep-water tie-backs financially compelling?
They reuse existing FPSO infrastructure, pushing breakevens below USD 40 per barrel and delivering internal rates of return near 25% on projects like Sangomar and Bonga Southwest.
How is gas monetization reshaping project portfolios?
New LNG trains and domestic supply mandates are lifting natural-gas activity at a 7.1% CAGR, narrowing crude’s 62.1% revenue lead and reducing flaring penalties.
What are the principal execution risks in Nigeria’s onshore blocks?
Militancy, theft, and pipeline sabotage cost USD 3.3 billion during 2023-2024 and force operators to budget up to USD 80 million annually for security and alternative logistics.
Page last updated on:


