
Technology, Media and Telecom
5th MayPricing Strategy for Semiconductor Components
3 Min Read
The Wearable Temperature Sensors Market Report is Segmented by Sensor Type (Temperature-Only IC, Multi-Parameter SoC With Temperature, and More), Wearable Form Factor (Wrist-Wear, Skin Patches, and More), End-User Vertical (Healthcare and Medical, Sports and Fitness, and More), Connectivity and Power Technology (Bluetooth Low Energy, NFC and RFID, and More), and Geography. The Market Forecasts are Provided in Terms of Value (USD).
Market Overview
| Study Period | 2020 - 2031 |
|---|---|
| Market Size (2026) | USD 68.09 Billion |
| Market Size (2031) | USD 121.72 Billion |
| Growth Rate (2026 - 2031) | 12.34 % CAGR |
| Fastest Growing Market | Asia Pacific |
| Largest Market | North America |
| Market Concentration | Medium |
Major Players *Disclaimer: Major Players sorted in no particular order. Image © Mordor Intelligence. Reuse requires attribution under CC BY 4.0. |
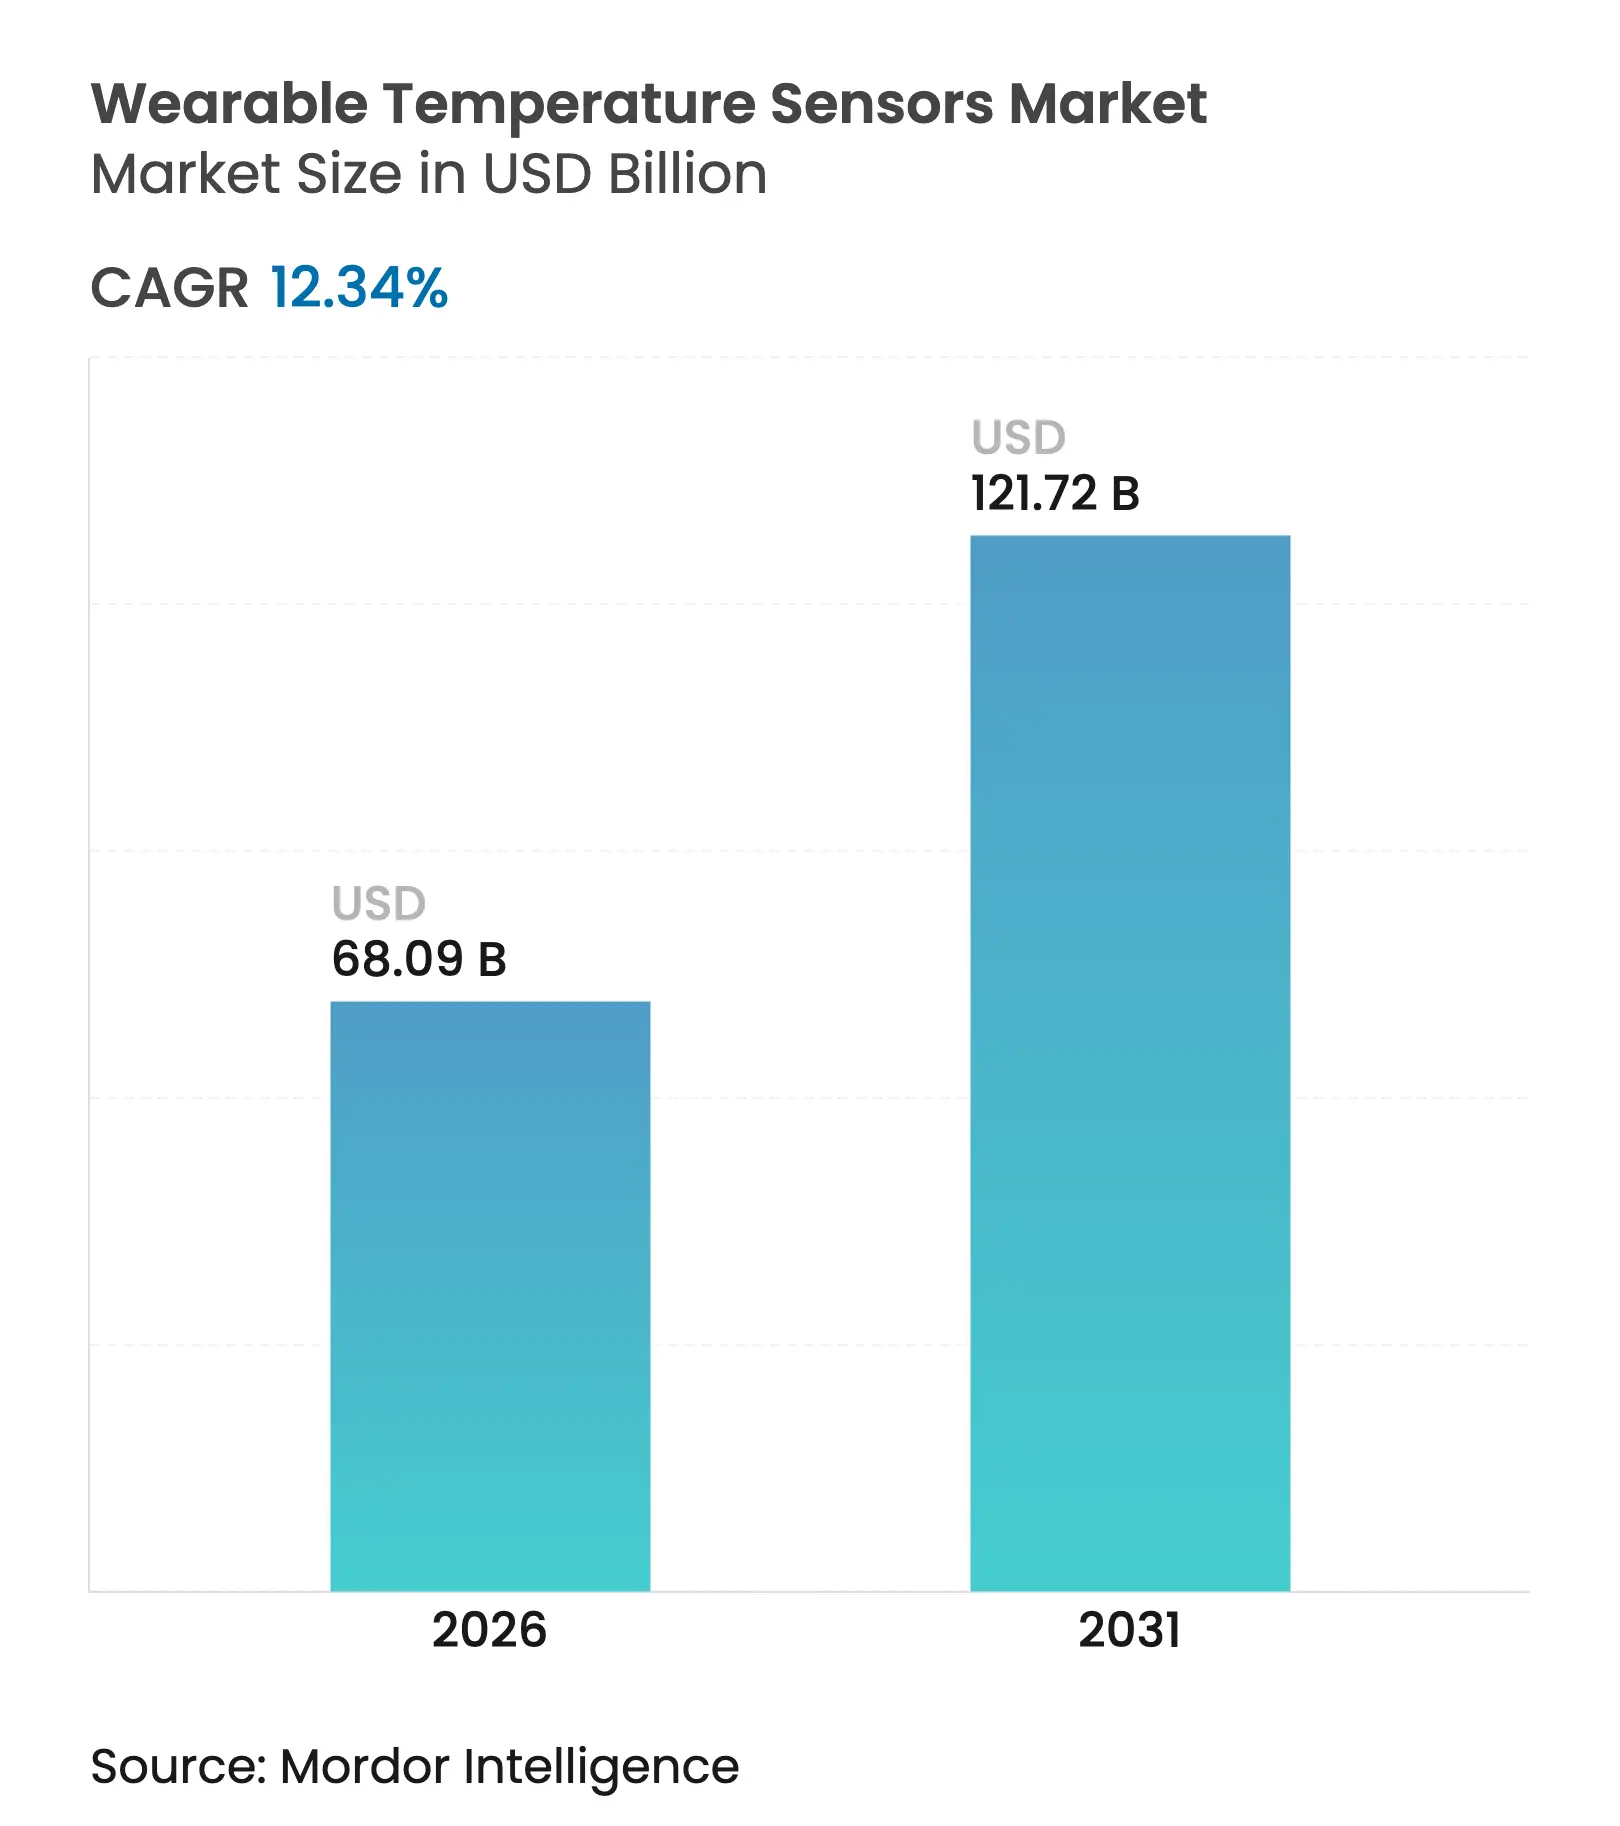
The wearable temperature sensors market size was valued at USD 60.61 billion in 2025 and estimated to grow from USD 68.09 billion in 2026 to reach USD 121.72 billion by 2031, at a CAGR of 12.34% during the forecast period (2026-2031). The growth trajectory reflects healthcare systems’ permanent shift toward continuous patient monitoring, semiconductor miniaturization that embeds digital temperature ICs into smartwatches, and stricter industrial safety mandates that require real-time worker heat-stress tracking. Rising insurance incentives for remote wellness programs, energy-harvesting breakthroughs that remove battery-life constraints, and manufacturers’ push for platform-based data services further expand revenue opportunities. Competition remains moderate as chip suppliers and specialized wearable brands pursue form-factor innovation and vertical integration for data-analytics-driven recurring income. Supply chain tension around medical-grade thermistor materials and evolving biometric data-privacy rules introduce both headwinds and potential consolidation triggers.
Key Report Takeaways
Note: Market size and forecast figures in this report are generated using Mordor Intelligence's proprietary estimation framework, updated with the latest available data and insights as of 2026.
Drivers Impact Analysis
| Driver | (~) % Impact on CAGR Forecast | Geographic Relevance | Impact Timeline | |||
|---|---|---|---|---|---|---|
Accelerated shift to continuous patient monitoring post-COVID-19 Accelerated shift to continuous patient monitoring post-COVID-19 | +2.8% | Global, with early adoption in North America and EU | Medium term (2-4 years) | (~) % Impact on CAGR Forecast :+2.8% | Geographic Relevance :Global, with early adoption in North America and EU | Impact Timeline :Medium term (2-4 years) |
Integration of digital temperature ICs in next-gen smartwatches Integration of digital temperature ICs in next-gen smartwatches | +2.1% | Global, led by North America and Asia-Pacific | Short term (≤ 2 years) | |||
Industrial safety mandates for heat-stress monitoring Industrial safety mandates for heat-stress monitoring | +1.9% | Global, with strong regulatory push in EU and North America | Long term (≥ 4 years) | |||
Insurance incentives for wearable-based wellness programs Insurance incentives for wearable-based wellness programs | +1.4% | North America and EU primarily, expanding to APAC | Medium term (2-4 years) | |||
Printed flexible sensors enabling smart clothing adoption Printed flexible sensors enabling smart clothing adoption | +1.8% | Global, with manufacturing concentration in Asia-Pacific | Medium term (2-4 years) | |||
Skin-interfaced energy-harvesting patches removing battery constraints Skin-interfaced energy-harvesting patches removing battery constraints | +1.5% | Global, with early adoption in medical and industrial applications | Long term (≥ 4 years) | |||
| Source: Mordor Intelligence | ||||||
Accelerated Shift to Continuous Patient Monitoring Post-COVID-19
Remote physiological monitoring became a permanent fixture of care delivery once reimbursement rules expanded in 2024.[1]Centers for Medicare & Medicaid Services, “Remote Patient Monitoring Services,” cms.gov Hospitals now deploy medical-grade wearables to track fever profiles for chronic patients outside acute settings, reducing readmission rates and enabling earlier therapeutic adjustments. Continuous temperature streams integrate seamlessly with electronic health records, empowering clinicians with real-time alerts. The model aligns with value-based care objectives by lowering costly emergency visits and minimizing nosocomial infection risk. Vendors that secure FDA clearance gain sustained demand from health systems seeking compliant solutions.
Integration of Digital Temperature ICs in Next-Gen Smartwatches
Semiconductor miniaturization allowed high-precision temperature sensing to fit existing smartwatch footprints without battery penalties, catalyzed by Apple’s Series 9 debut in 2024.[2]Apple Inc., “Health Technologies Overview,” apple.com System-on-chip integration cuts component counts and reduces bill-of-materials, letting consumer devices inherit capabilities once reserved for clinical instruments. As rival brands replicate the feature, temperature monitoring becomes a baseline expectation across mainstream wearables, enlarging addressable volumes for sensor suppliers. The consumer adoption loop feeds clinical acceptance when the same hardware gains regulatory validation.
Industrial Safety Mandates for Heat-Stress Monitoring
OSHA and EU directives stipulate continuous core temperature tracking in high-heat workplaces, creating mandatory device procurement across foundries, construction, and logistics.[3]U.S. Department of Labor, “Heat Exposure Prevention,” osha.gov Heat-related injury costs, pegged at USD 100 billion annually in the United States, spur employers to outfit staff with rugged wearables delivering medical-grade precision despite extreme ambient conditions. Vendors specializing in durable enclosures and reliable wireless connectivity secure long-cycle contracts as compliance deadlines approach, anchoring multi-year growth in the B2B channel.
Insurance Incentives for Wearable-Based Wellness Programs
Major insurers now offer up to 15% premium reductions when members enroll in continuous biometric monitoring schemes that include temperature tracking. Actuarial analyses show 23% lower claims because fever data triggers earlier interventions, lowering hospitalization frequency. The financial alignment drives consumer uptake of FDA-cleared wearables through employer benefits portals, boosting unit volumes. Sensor makers that integrate secure data APIs gain recurring revenue via analytics partnerships with payers.
Restraints Impact Analysis
| Restraint | (~) % Impact on CAGR Forecast | Geographic Relevance | Impact Timeline | |||
|---|---|---|---|---|---|---|
Accuracy drift in long-term skin readings Accuracy drift in long-term skin readings | -1.6% | Global, particularly affecting medical applications | Short term (≤ 2 years) | (~) % Impact on CAGR Forecast :-1.6% | Geographic Relevance :Global, particularly affecting medical applications | Impact Timeline :Short term (≤ 2 years) |
Data-privacy regulations limiting biometric analytics Data-privacy regulations limiting biometric analytics | -1.2% | EU (GDPR), California (CCPA), expanding globally | Medium term (2-4 years) | |||
Fragmented IoT standards hampering interoperability Fragmented IoT standards hampering interoperability | -2.2% | Global, with stronger impact in enterprise deployments | Long term (≥ 4 years) | |||
Supply volatility of medical-grade thermistor materials Supply volatility of medical-grade thermistor materials | -1.7% | Global, with acute shortages in Asia-Pacific manufacturing hubs | Short term (≤ 2 years) | |||
| Source: Mordor Intelligence | ||||||
Accuracy Drift in Long-Term Skin Readings
Skin-contact sensors gradually deviate up to 0.5 °C after 72 hours due to sweat, sebum, and mechanical stress, eroding clinical reliability. Frequent recalibration interrupts monitoring and undermines patient adherence. Flexible printed sensors, despite comfort advantages, amplify drift when garments shift during daily activity. Research into self-calibrating algorithms and multilayer encapsulation seeks to extend accuracy windows, but mass-market solutions remain one development cycle away.
Data-Privacy Regulations Limiting Biometric Analytics
GDPR and CCPA treat temperature as sensitive biometric data, mandating explicit consent and localized processing that inflate deployment costs for multinational programs. Hospitals and employers must navigate fragmented rules, delaying rollouts and constraining population-level predictive modeling. Vendors are investing in on-device encryption and federated learning to sidestep regulatory friction, yet compliance complexity persists until harmonized global standards emerge.
By Sensor Type: Digital ICs Sustain Clinical Precision
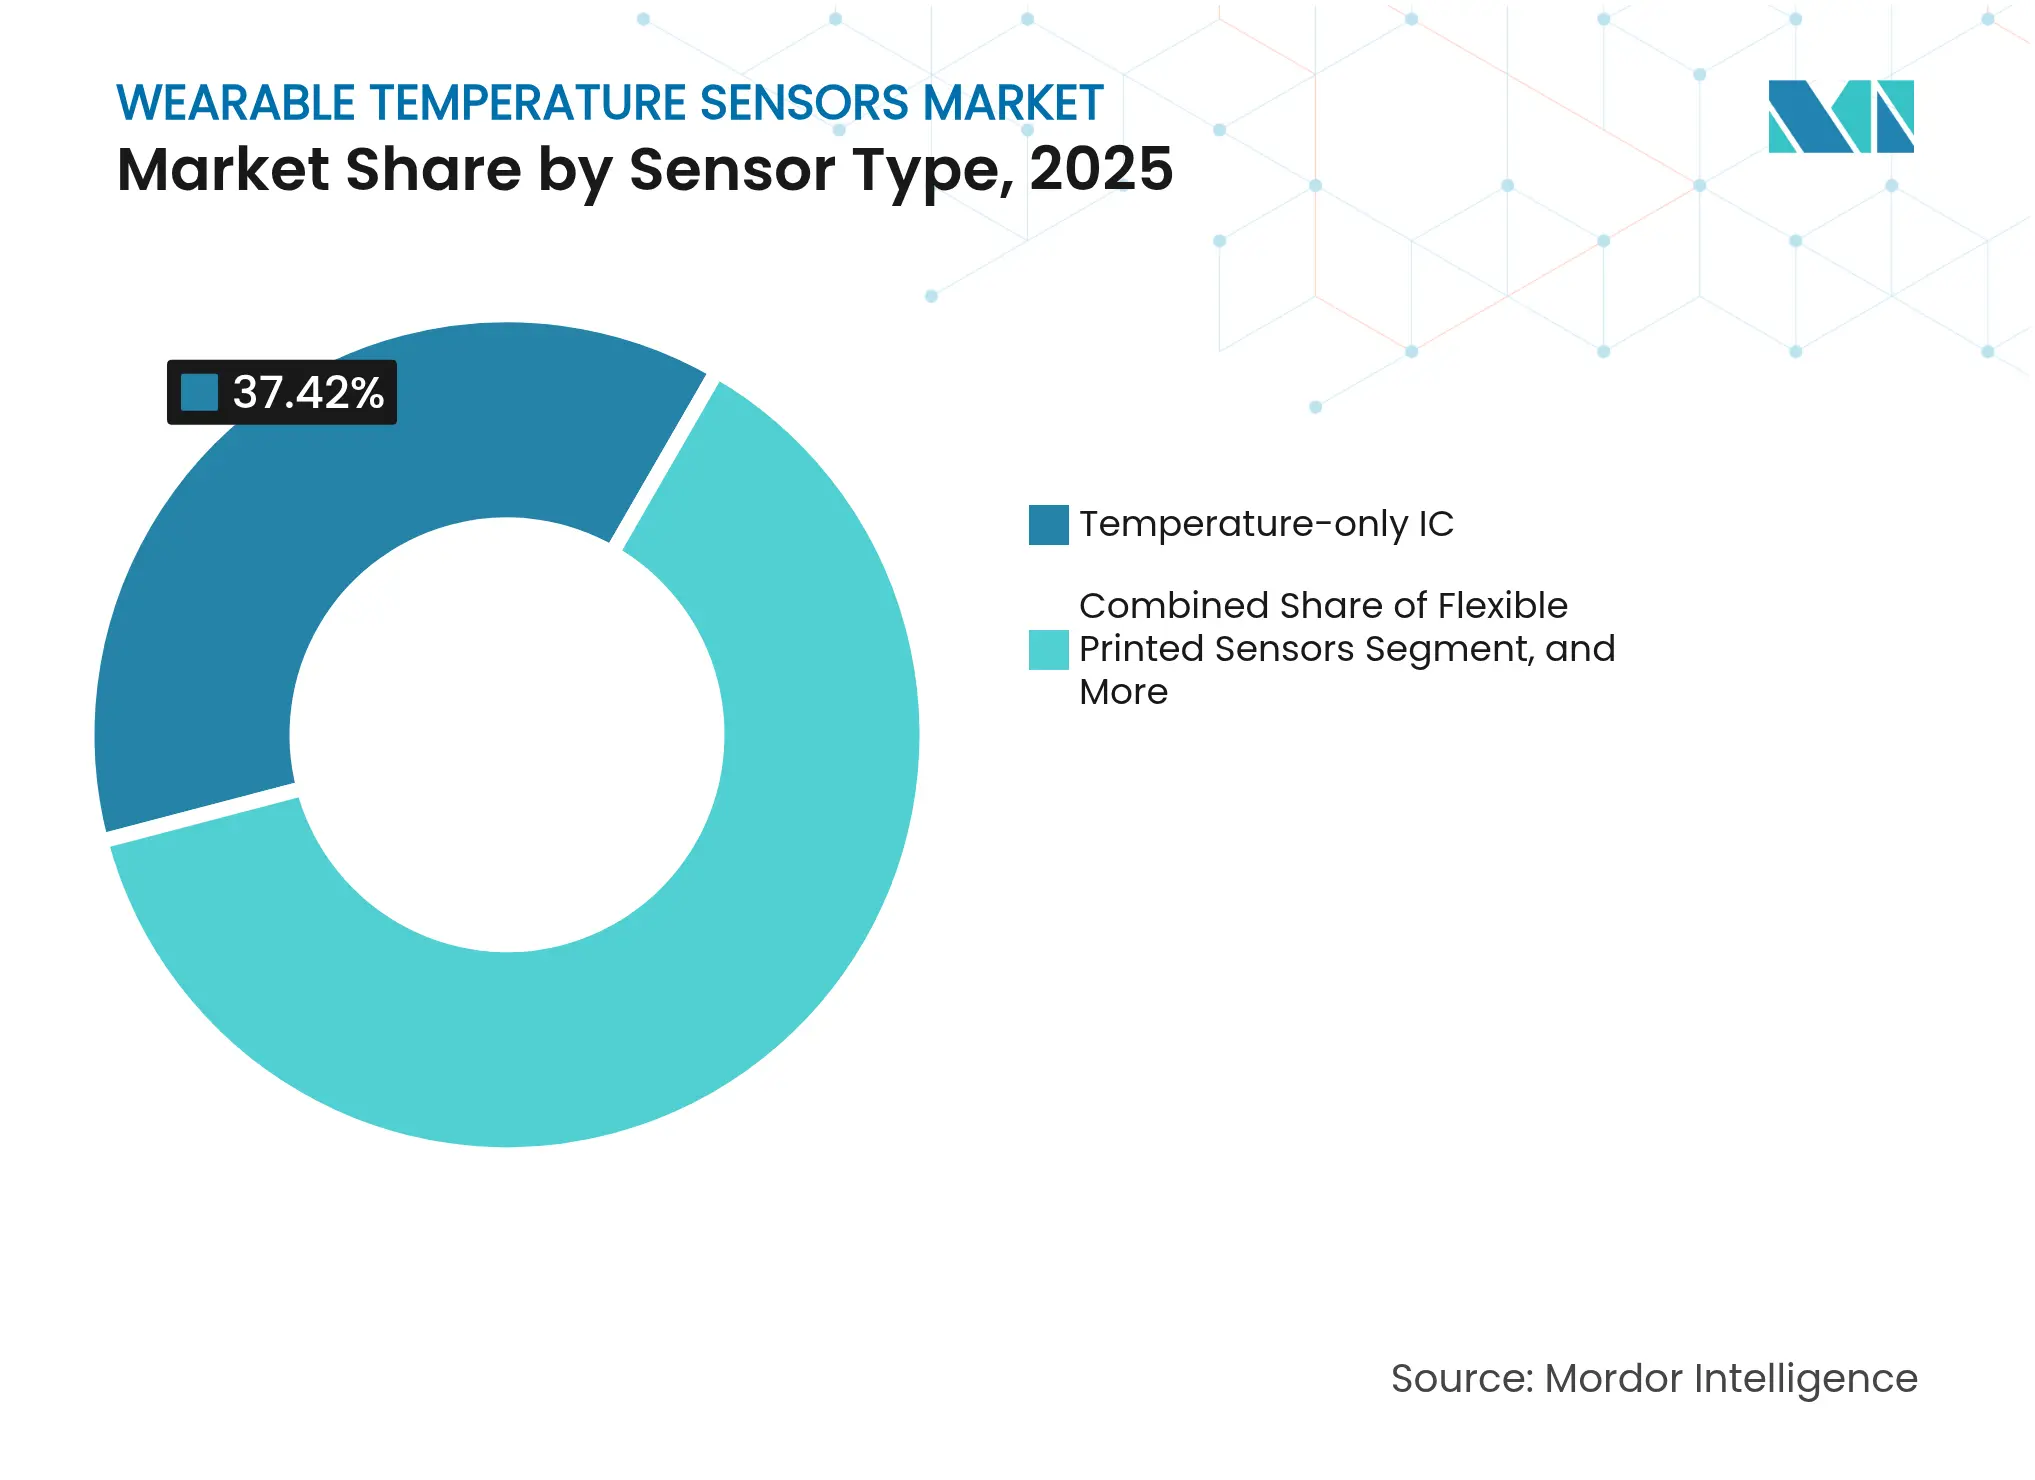
Digital temperature-only ICs retained 37.42% revenue in 2025, underscoring their utility where accurate, single-parameter measurement drives reimbursement. The wearable temperature sensors market size for digital IC-based devices is forecast to grow steadily as hospitals standardize on FDA-cleared modules for infection control workflows. Flexible printed sensors, posting 12.64% CAGR, unlock smart clothing and industrial garment integration. Their thin-film architecture covers wider body areas, offering granular thermal mapping that rigid ICs cannot deliver. However, overcoming drift and wash-cycle durability remains critical before displacing IC leadership. Infrared thermopile arrays continue in contact-less industrial roles such as protective gear monitoring where direct skin coupling proves impractical.
IC vendors bundle calibration firmware to extend field life, while flexible electronics startups court sports-performance brands with full-body heat maps. Hybrid solutions that pair IC accuracy at pulse points with fabric-embedded arrays elsewhere may emerge, balancing precision and coverage. Patent activity in thermoelectric energy harvesting integrated with digital ICs signals a future where sensors power themselves, further differentiating solutions
Note: Segment shares of all individual segments available upon report purchase
By Wearable Form Factor: Smart Clothing Breaks Out
Wrist devices held 46.10% share in 2025 because consumers trust watch-style wearables and supply chains are optimized. The segment’s high installed base ensures that the wearable temperature sensors market continues to monetize through service subscriptions and app upgrades. Yet form-factor saturation compels brands to seek the next growth engine, and smart clothing answers that need with 12.96% CAGR. Textile-integrated sensors deliver distributed insight that supports industrial safety inspections and neonatal care by capturing full-body thermal gradients.
Smart clothing suppliers now meet washability benchmarks of 50 cycles without losing ±0.1 °C accuracy, a major milestone for mainstream adoption. Skin patches carve a niche in outpatient febrile management because they avoid bulky casings, though adhesive fatigue limits week-long use. Ear-wear and foot-wear designs address specialized athletic and military scenarios where location-specific heat detection improves performance or reduces injury. Overall, diversified form factors ensure the wearable temperature sensors market keeps expanding even as wrist-wear growth moderates.
By End-User Vertical: Industrial Safety Surges
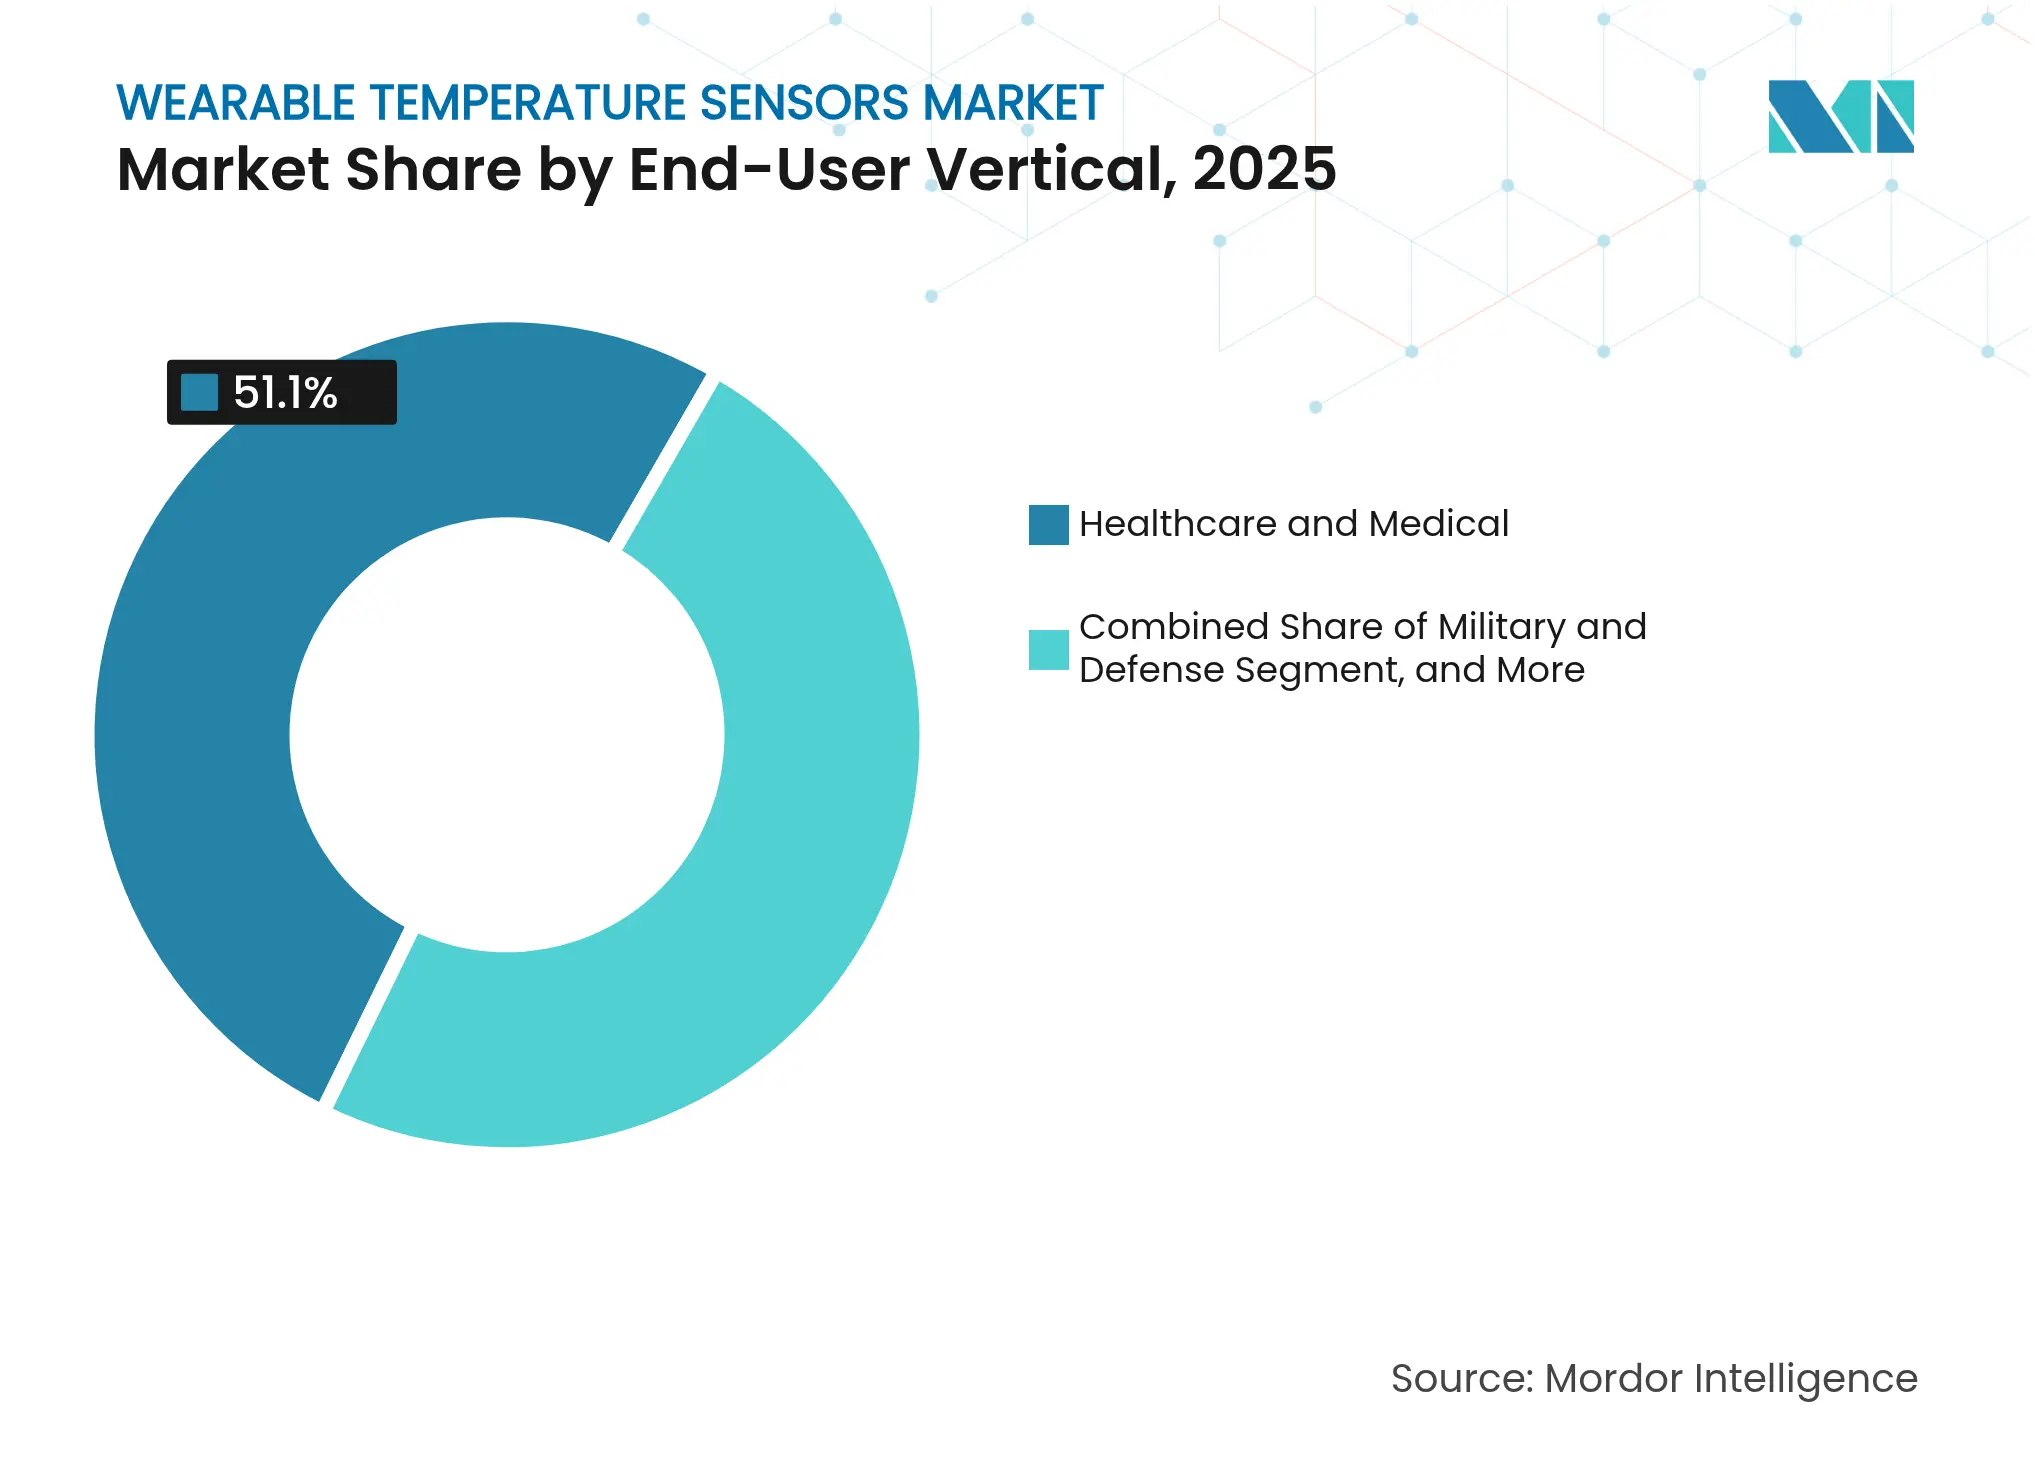
Healthcare and medical dominated the wearable temperature sensors market with 51.10% revenue in 2025 thanks to insurance reimbursement and clinical evidence. Hospitals deploy sensors during chemotherapy to flag neutropenic fever and at home for COVID-19 long-hauler monitoring. Sports and fitness remain the second largest vertical, but industrial safety posts the fastest 13.21% CAGR as regulations tighten. The wearable temperature sensors market share for industrial clients expands when manufacturers embed thermal sensors into protective uniforms, reducing workers’ compensation payouts by anticipating heat exhaustion.
Military procurement offices test ruggedized sensors sewn into combat uniforms that endure 100 °C external heat and high-g humidity. Consumer electronic firms add basic temperature sensing to earbuds and VR headsets for comfort management. Niche applications such as pet monitoring leverage similar silicon but calibrate algorithms for fur coverage and higher baseline temperatures, signaling new micro-segments for suppliers.
Note: Segment shares of all individual segments available upon report purchase
By Connectivity and Power Technology: Energy Harvesting Eliminates Batteries
Bluetooth Low Energy (BLE) delivered 59.85% of 2025 revenue because its smartphone pairing simplicity resonates with both consumers and clinicians. Mesh capabilities allow dozens of bedside sensors to stream simultaneously without congestion. Yet battery life is the Achilles’ heel in continuous monitoring. Thermoelectric energy harvesting tops growth at 13.42% CAGR, letting the wearable temperature sensors market cross the divide into perpetual operation. Pilot projects using body-heat-driven power demonstrate multi-month uninterrupted feeds in intensive-care settings, cutting nurse workload for battery swaps.
Thermoelectric modules now achieve 30 µW cm-2 in 5 °C gradients, sufficient for sub-1 mW ICs. Near-Field Communication suits hospital wards where passive readouts avoid wireless interference with medical equipment. ANT+ persists in sports ecosystems requiring low latency group sync. Vendors experiment with dual-radio architectures that wake high-bandwidth Wi-Fi only during firmware updates, preserving harvested power for sensing.
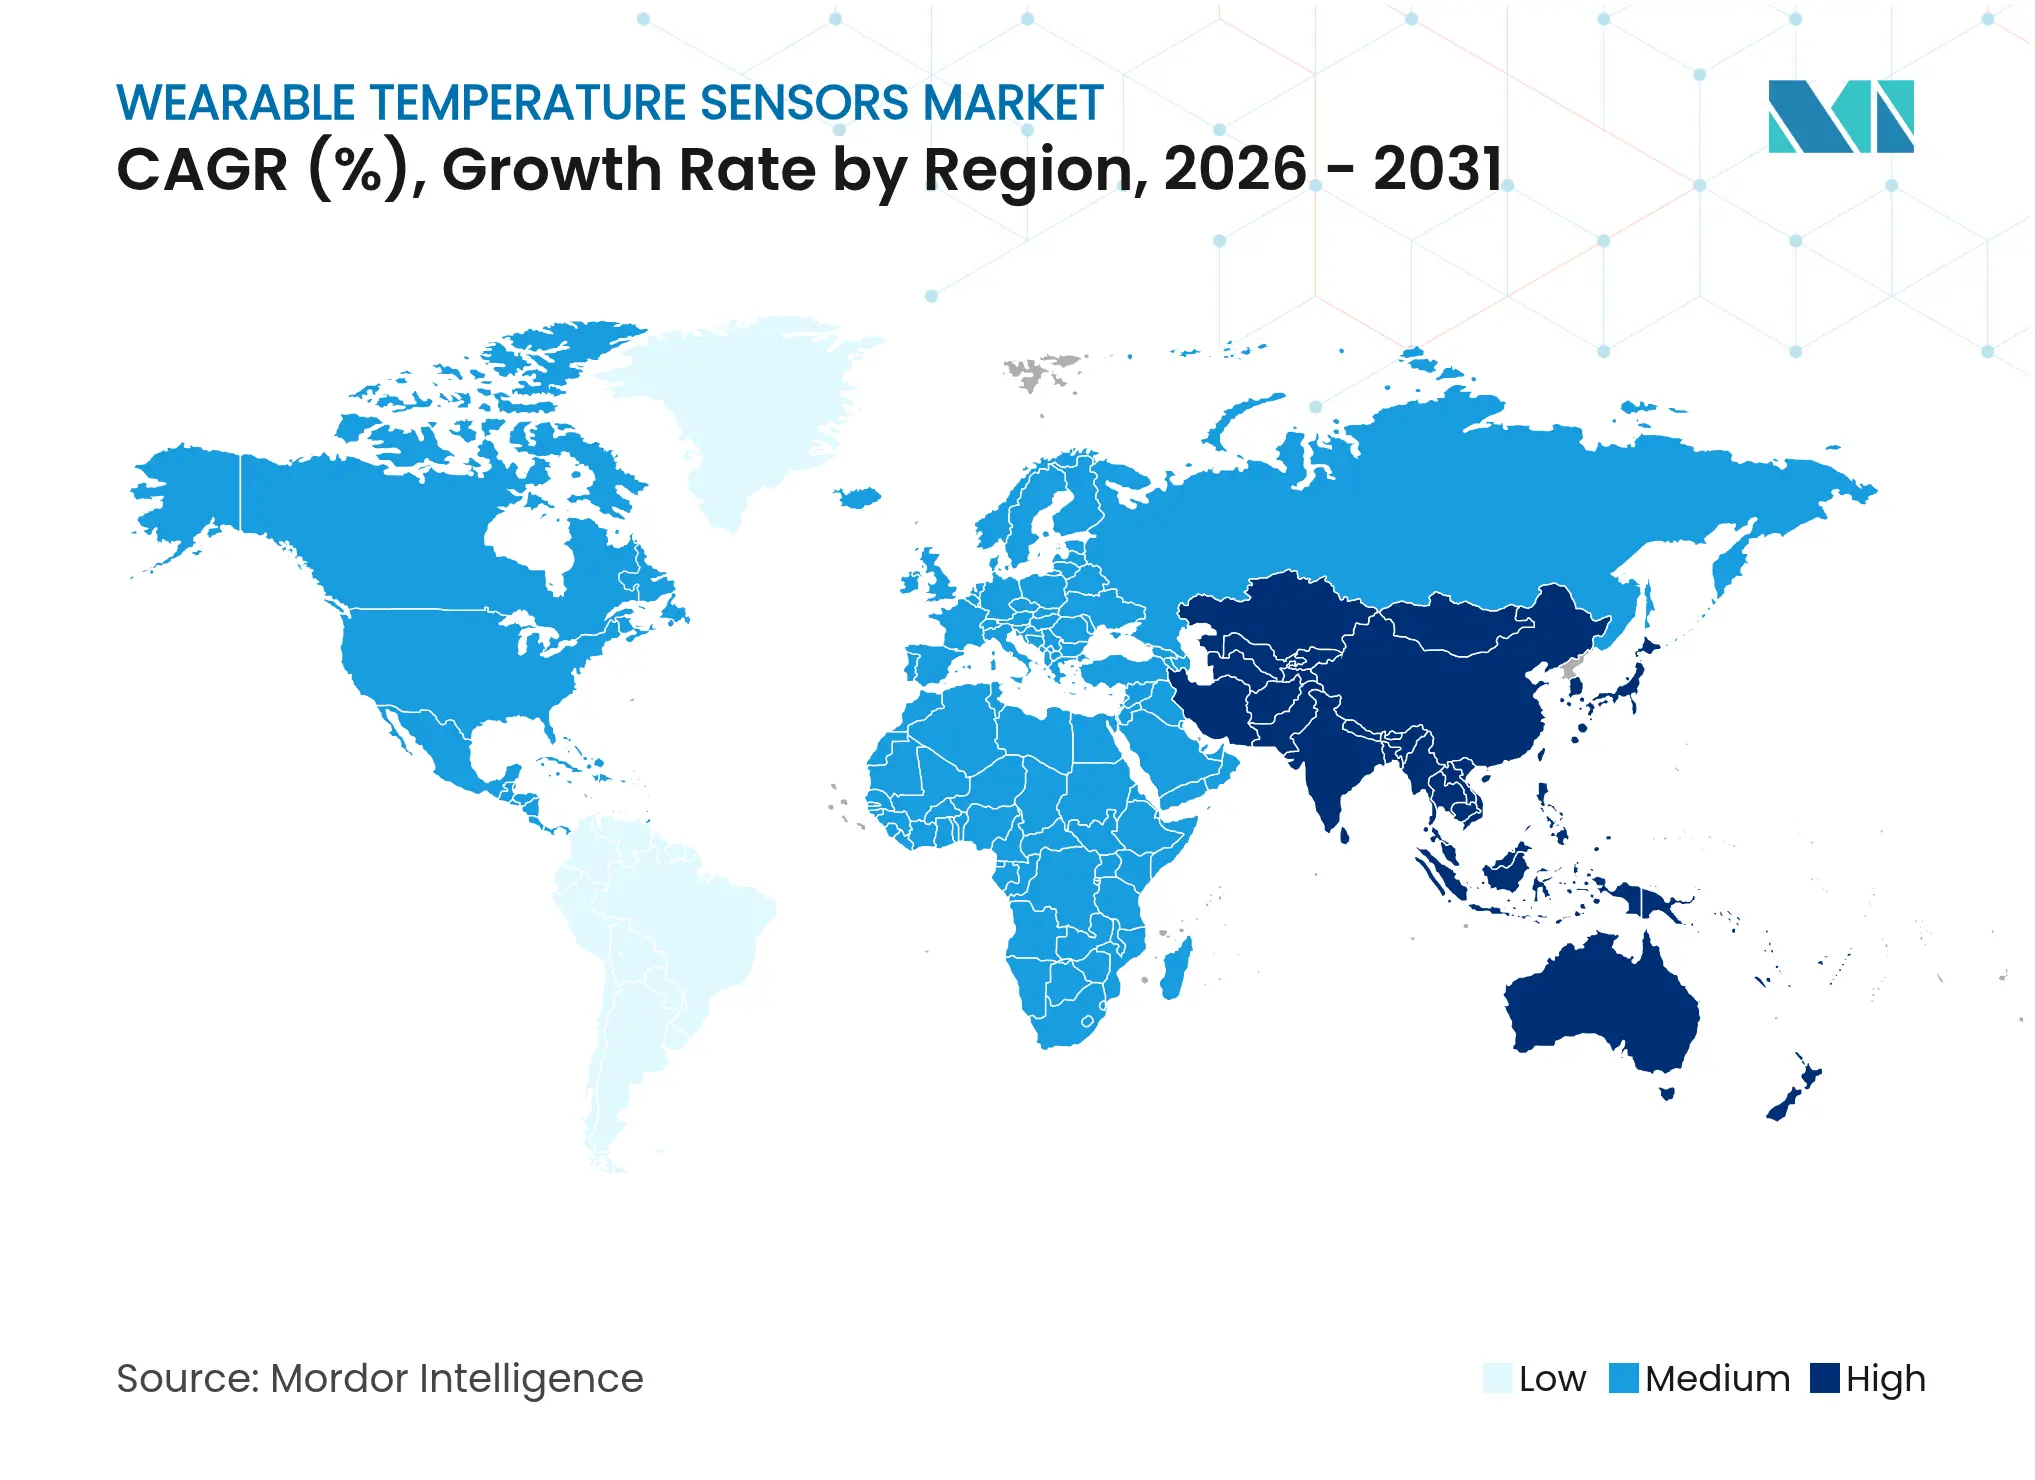
North America commanded 38.20% revenue in 2025 as healthcare providers quickly adopted reimbursed remote temperature monitoring programs. OSHA’s evolving heat-stress standards motivate industrial usage, and a concentration of semiconductor fabs supports localized supply chains. Canada mirrors U.S. adoption through provincial health authority pilots, while Mexico’s export-oriented factories adopt sensors to meet client safety audits.
Europe upholds strong growth on the back of comprehensive worker protection laws and universal healthcare systems that fund preventive devices. Germany leads industrial deployments in automotive plants; the United Kingdom pushes remote monitoring for National Health Service outpatient pathways. GDPR compliance drives demand for on-device analytics, favoring European hardware suppliers that co-locate data processing. Southern European nations with rising summer temperatures demonstrate accelerating heat-safety rollouts, amplifying demand for rugged wearables.
Asia-Pacific records the highest 13.18% CAGR through 2031. China’s Ministry of Emergency Management mandates heat-stress monitoring starting 2025 for iron and steel plants, sparking large-scale tenders. Japan and South Korea export miniaturized sensors to global brands and deploy them domestically for elder-care monitoring. India’s smart-manufacturing incentives subsidize IoT wearables in special economic zones, while Australia integrates sensors into mining safety protocols. Diverse regulatory needs stimulate modular product design that accommodates different certification paths.
Market Concentration
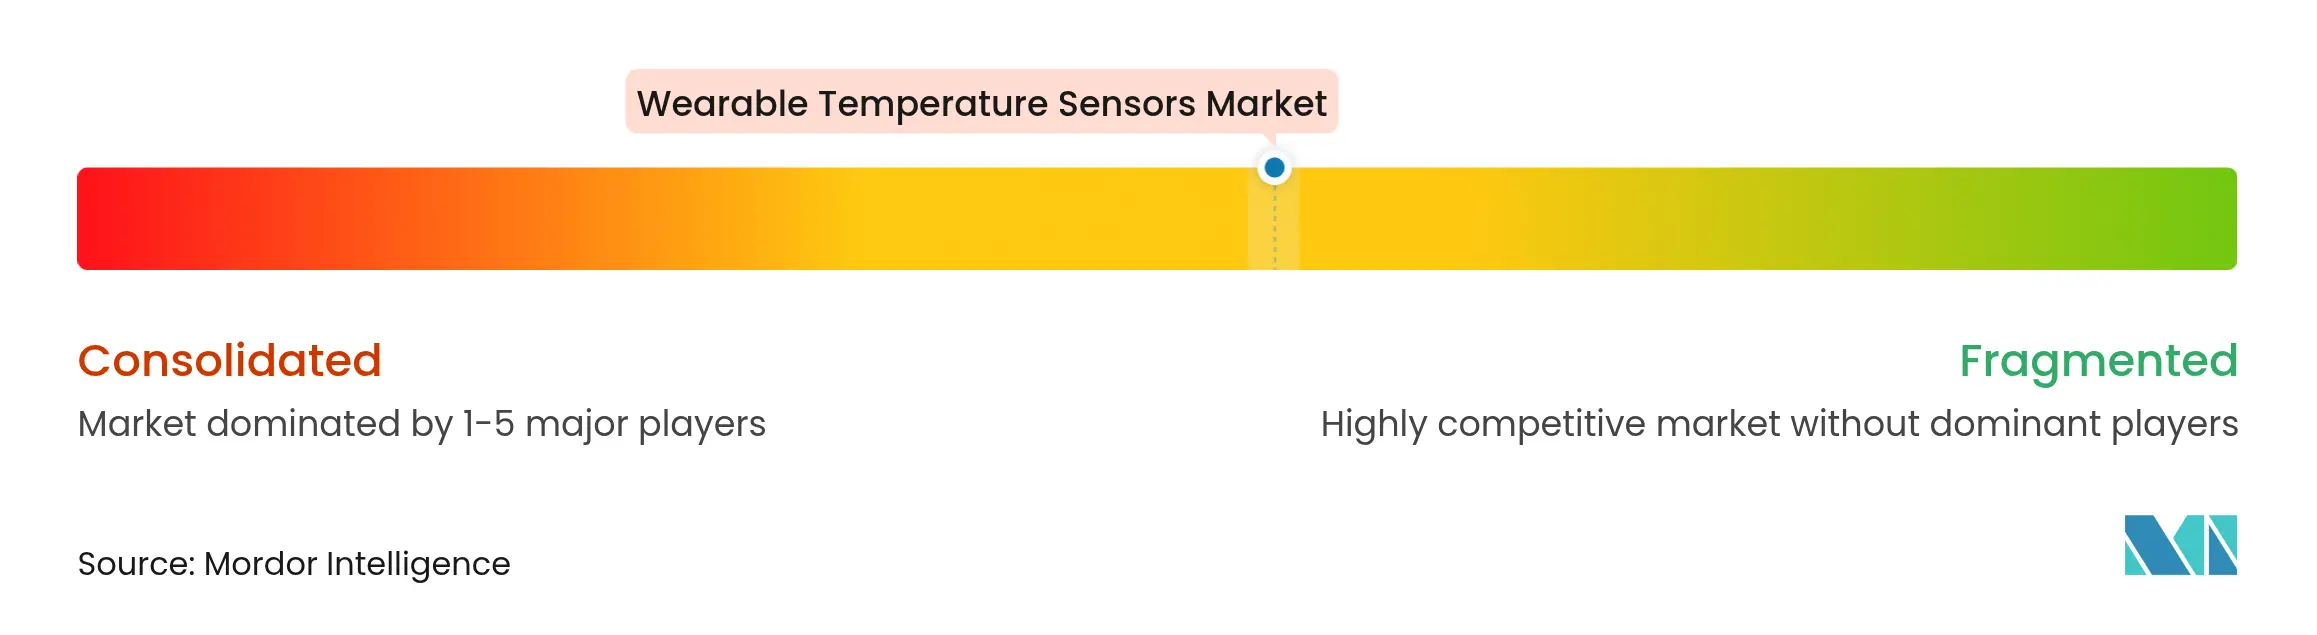
The wearable temperature sensors market remains moderately fragmented, with no player exceeding 15% global revenue. Semiconductor incumbents such as Texas Instruments, STMicroelectronics, and Analog Devices capitalize on process-node leadership to release ultra-low-power ICs, then partner with firmware specialists for turnkey modules. Consumer electronics giants including Apple, Samsung, and Garmin own distribution channels and invest in health-regulatory clearances to differentiate premium devices. Specialized firms like GreenTEG and Sensirion focus on flexible or optical sensing niches, licensing IP to apparel brands for smart clothing rollouts.
Strategic investments gravitate toward vertical integration. Analog Devices’ acquisition of GreenTEG secures flexible sensor know-how, while STMicroelectronics spends USD 150 million doubling medical-grade IC output. Patent filings for thermoelectric harvesting climbed 40% YoY, indicating a race to untether wearables from batteries. Mid-tier OEMs pursue white-label manufacturing deals with insurers to bundle hardware into wellness programs, shifting revenue composition from one-time hardware sales to subscription analytics.
Platform economics reshape competition. Data-analysis software that predicts infection onset or heat-stroke risk commands higher gross margins than sensors alone. Players therefore embed secure cloud connectors and AI algorithms into value propositions. Compliance hurdles around biometric privacy create barriers to entry that favor vendors with in-house legal teams and localized datacenters, indirectly boosting consolidation prospects. Overall, rivalry stimulates rapid feature cycles but also encourages ecosystem partnerships rather than winner-takes-all behavior.

*Disclaimer: Major Players sorted in no particular order
1. INTRODUCTION
2. RESEARCH METHODOLOGY
3. EXECUTIVE SUMMARY
4. MARKET LANDSCAPE
5. MARKET SIZE AND GROWTH FORECASTS (VALUE)
6. COMPETITIVE LANDSCAPE
7. MARKET OPPORTUNITIES AND FUTURE OUTLOOK
Wearable temperature sensors are portable sensors that are used independently to measure human temperature. These sensors are directly integrated into wearable devices or the human body to monitor heart rate, body temperature, and pulse rate. Wearable sensors have gained popularity in the healthcare and diagnosis industry, where several parameters are of vital importance, namely blood pressure, heart rate, and body temperature.
The wearable temperature sensors market is segmented by application (body wear, eyewear, footwear, wrist wear, and other applications), end-user vertical (healthcare, sports/fitness, industrial, and other end-user verticals), and geography (North America, Europe, Asia-Pacific, and the Rest of the World). The market sizes and forecasts are provided in terms of value (USD) for all the above segments.
Pricing Strategy for Semiconductor Components
3 Min Read
Accelerating Additive Manufacturing Adoption in India
3 Min Read
When decisions matter, industry leaders turn to our analysts. Let’s talk.