
Market Overview
| Study Period | 2020 - 2031 |
|---|---|
| Market Size (2026) | USD 257.35 Billion |
| Market Size (2031) | USD 572.73 Billion |
| Growth Rate (2026 - 2031) | 17.35% CAGR |
| Fastest Growing Market | Asia Pacific |
| Largest Market | North America |
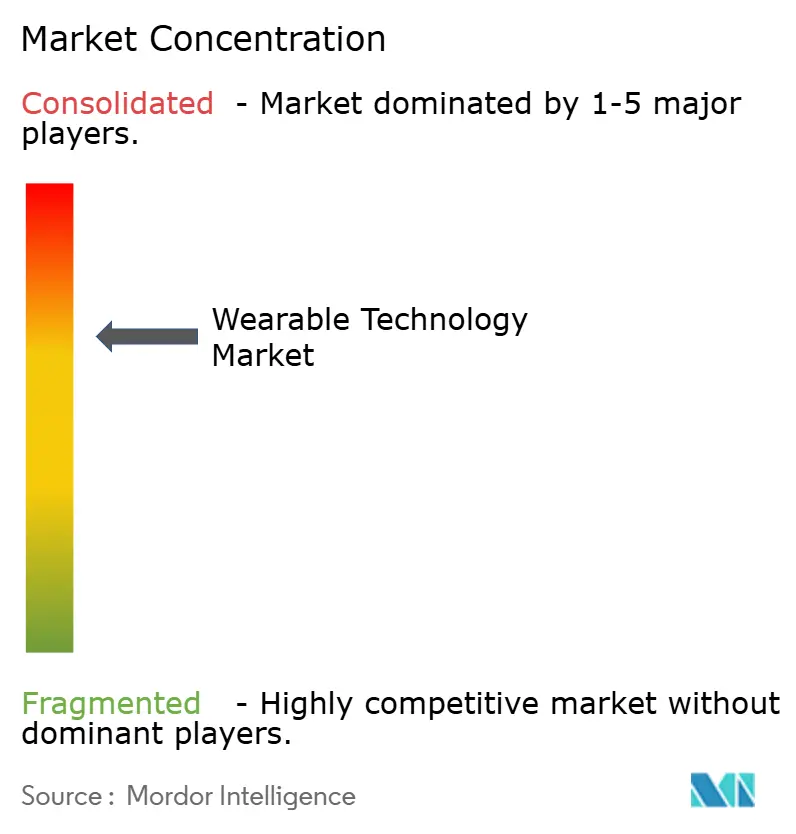
| Market Concentration | Medium |
Major Players *Disclaimer: Major Players sorted in no particular order Image © Mordor Intelligence. Reuse requires attribution under CC BY 4.0. | |
Wearable Technology Market Analysis by Mordor Intelligence
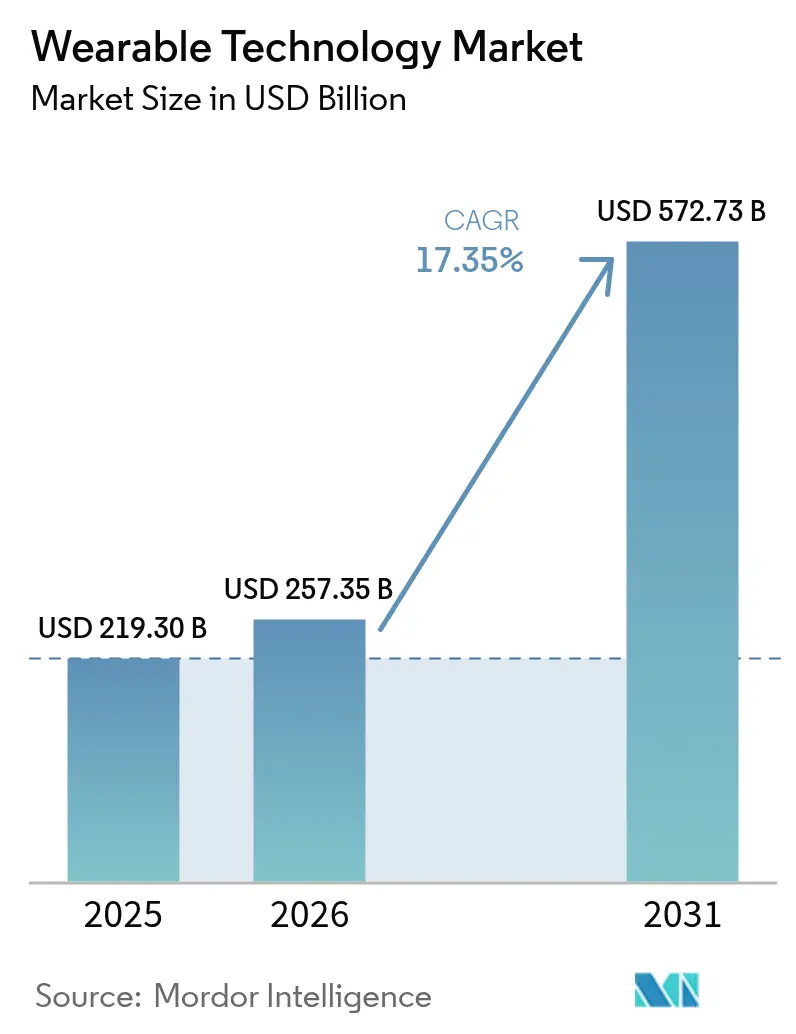
The wearable technology market size is expected to grow from USD 219.30 billion in 2025 to USD 257.35 billion in 2026 and is forecast to reach USD 572.73 billion by 2031 at 17.35% CAGR over 2026-2031.
underscoring the sector’s rapid scale-up and the commercial viability of sensor-rich connected devices.[1]U.S. Food and Drug Administration, “Digital Health Center of Excellence,” fda.gov Momentum stems from FDA clearances for AI-enabled medical wearables, enterprise spending on augmented reality headsets, and solid-state battery breakthroughs that ease long-standing power-density constraints. North America accounts for the largest revenue pool, yet Asia-Pacific is expanding the fastest as component manufacturing localizes and governments digitize healthcare delivery. Device leadership remains with smartwatches, although head-mounted displays record the steepest uptake, buoyed by frontline workforce deployments. Competition has shifted from hardware differentiation to ecosystem control; the companies that integrate chips, software, and services most tightly are capturing a disproportionate share of value.
Key Report Takeaways
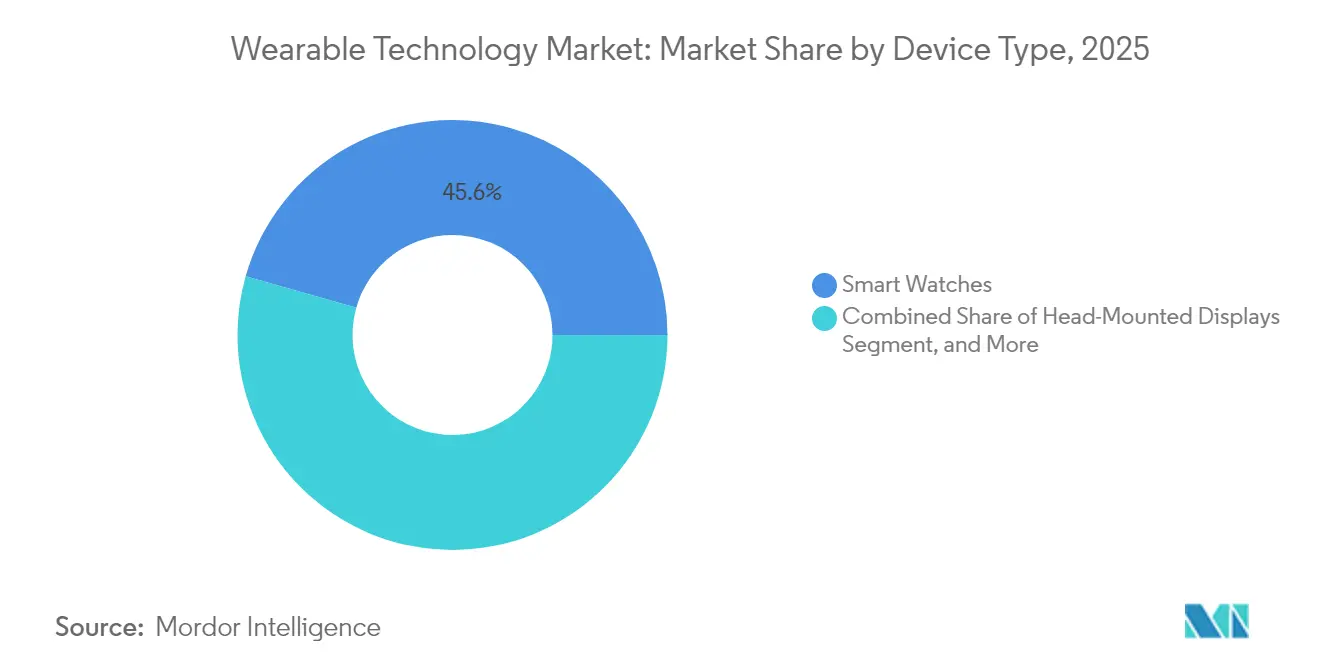
- By device type, smartwatches led with 45.60% of the wearable technology market share in 2025, while head-mounted displays are projected to grow at a 19.02% CAGR to 2031.
- By component, sensors commanded 28.70% of the wearable technology market size in 2025, whereas solid-state batteries are set to expand at a 19.85% CAGR through 2031.
- By connectivity technology, Bluetooth and BLE held 61.40% share of the wearable technology market size in 2025; cellular 5G is advancing at a 18.85% CAGR during the outlook period.
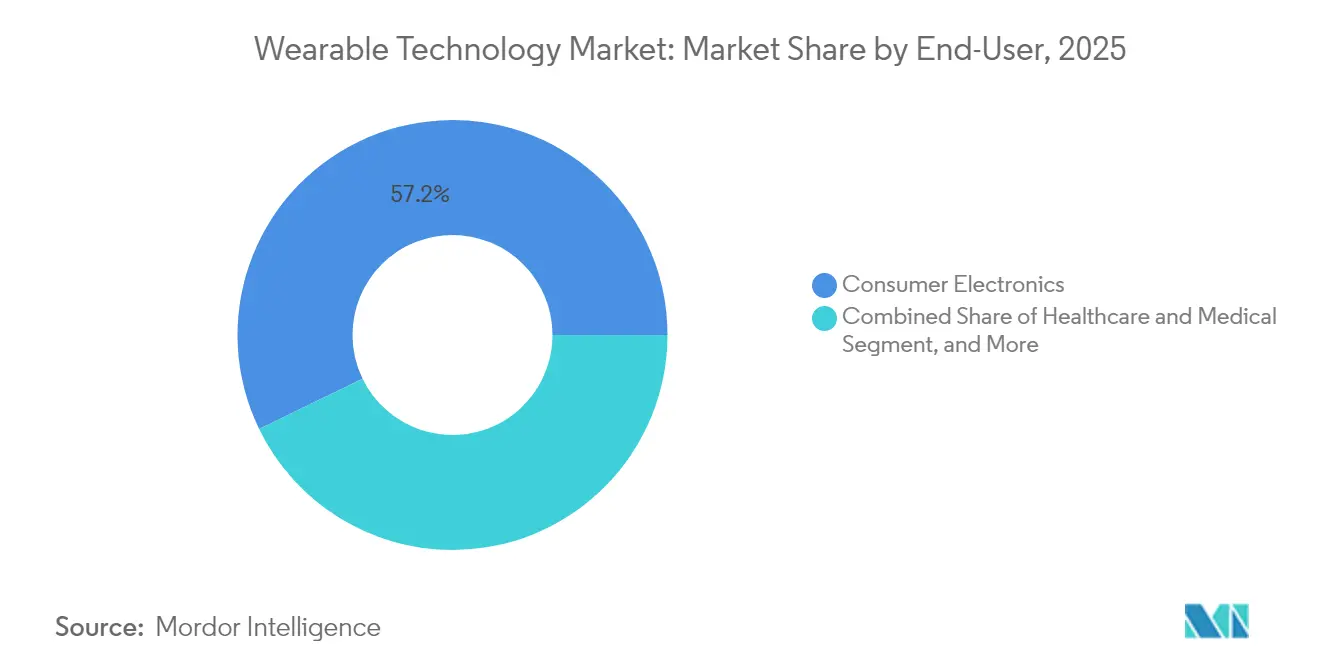
- By end-user industry, consumer electronics generated 57.20% of 2025 revenue, yet healthcare applications are pacing the field with a 20.10% CAGR to 2031.
- By geography, North America captured 31.70% of 2025 revenue, while Asia-Pacific is forecast to post a 20.25% CAGR over 2026-2031.
Note: Market size and forecast figures in this report are generated using Mordor Intelligence’s proprietary estimation framework, updated with the latest available data and insights as of 2026.
Global Wearable Technology Market Trends and Insights
Drivers Impact Analysis*
| Driver | (~) % Impact on CAGR Forecast | Geographic Relevance | Impact Timeline |
|---|---|---|---|
| AI-enabled clinical-grade sensors | +3.20% | Global, with early adoption in North America and EU | Medium term (2-4 years) |
| Enterprise AR for frontline workforce | +2.80% | North America and EU, expanding to APAC | Short term (≤ 2 years) |
| Reimbursement inclusion for medical wearables | +2.10% | North America and EU regulatory frameworks | Medium term (2-4 years) |
| Edge AI and low-power chipsets | +2.40% | Global, led by APAC manufacturing hubs | Long term (≥ 4 years) |
| Solid-state micro-batteries | +1.90% | Global, with APAC production leadership | Long term (≥ 4 years) |
| Immersive gaming and e-sports demand | +1.60% | Global, concentrated in developed markets | Short term (≤ 2 years) |
| Source: Mordor Intelligence | |||
AI-Enabled Clinical-Grade Sensors
Regulators continue to fast-track AI-driven biosensors, positioning wearables as decision-support tools in preventive medicine. FDA’s Digital Health Center of Excellence has streamlined review pathways, and innovators such as Trinity Biotech have launched continuous glucose monitors that fuse metabolic data with predictive analytics.[2]Fred Pennic, “Trinity Biotech Unveils CGM+,” HIT Consultant, hitconsultant.net Academic groups at KAIST and the University of Hong Kong are commercializing cuff-less blood-pressure modules and organic transistor arrays that process data locally, reducing latency and safeguarding privacy. These advances narrow the gap between consumer fitness gadgets and clinical diagnostics, giving payers confidence to reimburse remote monitoring services. Hospitals view the technology as a route to earlier intervention and cost avoidance, further enlarging the addressable base for the wearable technology market.
Enterprise AR for Frontline Workforce
Industrial augmented reality headsets improve efficiency in hazardous or distributed settings. Colgate-Palmolive logged 63 virtual collaborations that trimmed travel expenses and downtime, while Shell deployed intrinsically safe AR wearables across 12 countries to support maintenance in explosive zones.[3]RealWear, “Colgate-Palmolive Case Studies,” realwear.com Fujitsu cut assembly tasks by 19% after integrating AR guidance, and steelmaker KSP achieved 40% productivity gains through helmet-mounted visualization. The payback period often falls below one year, making procurement straightforward for operations teams. As remote-expert applications expand, enterprises are ordering at scale, propelling the wearable technology market.
Reimbursement Inclusion for Medical Wearables
U.S. insurers now reimburse remote physiologic and therapeutic monitoring when FDA-cleared devices are prescribed, lowering out-of-pocket costs for patients with chronic conditions. FDA’s over-the-counter approval of the Stelo glucose system and De Novo clearance for OsteoBoost therapeutic vibration illustrate a policy shift toward consumer-directed medical devices. CPT codes for remote monitoring remove billing friction and catalyse physician adoption. In Europe, similar reimbursement pilots are underway, signalling wider acceptance of wearables as legitimate clinical interventions that enlarge the wearable technology market.
Edge AI and Low-Power Chipsets
Qualcomm’s Snapdragon AR1+ packs on-device neural processing that eliminates reliance on smartphones, while Atmosic and AONDevices cut radio power draw by validating sensor events before transmission.[4]Samuel Reed, “The Wearable AI Revolution,” AInvest, ainvest.com Eatron’s AI battery management raises usable capacity by 10%, and Samsung’s 3 nm Exynos W1000 boosts performance-per-watt by 20%. These breakthroughs extend runtimes and enable always-on features without bulkier batteries, a key buying criterion for consumers. The marriage of edge AI and power-efficient silicon, therefore, sustains high growth in the wearable technology market.
Restraints Impact Analysis*
| Restraint | (~) % Impact on CAGR Forecast | Geographic Relevance | Impact Timeline |
|---|---|---|---|
| Data-privacy compliance burden | -1.80% | EU GDPR, expanding globally | Medium term (2-4 years) |
| Advanced-packaging supply bottlenecks | -1.40% | Global, concentrated in APAC supply chains | Short term (≤ 2 years) |
| E-waste and sustainability pressure | -1.10% | EU WEEE directive, spreading to other regions | Long term (≥ 4 years) |
| User fatigue / device abandonment | -2.20% | Global consumer markets | Short term (≤ 2 years) |
| Source: Mordor Intelligence | |||
Data-Privacy Compliance Burden
Wearables harvest biometrics that fall under stringent rules such as GDPR and Illinois BIPA. Manufacturers must embed consent management and on-device anonymization, raising development costs and delaying launch schedules. Cross-border data-transfer limits further complicate cloud analytics. Small vendors lacking legal resources face a higher cost-of-compliance hurdle, tempering new-entry rates and trimming growth for the wearable technology market.
User Fatigue and Device Abandonment
Surveys show 29-30% of users stop wearing smartwatches within six months, often citing battery life, comfort, or unclear value. Longitudinal data reveal engagement drops to 16% after 320 days as novelty fades. Unless vendors deliver actionable insights instead of raw metrics, churn will persist, shaving points off the wearable technology market’s CAGR.
*Our forecasts treat driver/restraint impacts as directional, not additive. The impact forecasts reflect baseline growth, mix effects, and variable interactions.
Segment Analysis
By Device Type: Smart Glasses Drive Next-Generation Computing
Head-mounted displays posted the fastest 19.02% CAGR over 2026-2031, yet smartwatches retained the largest 45.60% slice of the wearable technology market share in 2025. This momentum lifts the overall wearable technology market as enterprises adopt hands-free displays for maintenance, training, and logistics. Meta sold 2 million Ray-Ban smart glasses since late 2023 and is scaling to 10 million units annually, validating consumer appetite for discreet eyewear. Google’s USD 150 million partnership with Warby Parker expands style options, lowering the fashion barrier to adoption.
Diversification is also visible in ear-wearables, where Apple patents point to in-ear health diagnostics that could reduce reliance on wrist devices. Although smart clothing remains nascent, Johns Hopkins’ fiber batteries hint at washable energy storage that could mainstream e-textiles. Wristbands risk commoditization as smartwatch ASPs fall, but neural-input bands maintain niche demand for AR control. Collectively, these shifts enrich the wearable technology market.
Second-generation smart glasses integrate cellular radios and micro-LED displays, allowing notification triage, navigation overlays, and real-time translation without tethering to phones. OEMs focus on weight reduction and prescription-lens support to widen the addressable audience. The category’s rapid scale will keep device diversity high, ensuring the wearable technology market continues to grow.



By Component: Solid-State Batteries Enable Form Factor Innovation
Sensors captured the largest 28.70% contribution to the wearable technology market size in 2025, reflecting the need for multi-modal data streams. At the same time, solid-state batteries are forecast to outpace all components with a 19.85% CAGR, providing the energy foundation for advanced use cases. TDK’s chip-scale cells and Samsung’s week-long prototypes illustrate how safer chemistries unlock slimmer enclosures. Processors and memory ride the 3D-stacking wave, with TSMC planning panel-level packaging that blends CPUs, GPUs, and memory on a single substrate.
Displays are shifting to flexible OLED and micro-LED formats, enabling curved and transparent surfaces that merge with eyewear. Connectivity ICs co-package Bluetooth, Wi-Fi, and UWB to simplify board layouts and shrink antenna footprints. Software and services represent the highest margin layer, and platform owners increasingly gate features behind subscriptions, cementing ecosystems and elevating switching costs. Both margin pools and unit volumes, therefore, continue to widen for the wearable technology market.
By Connectivity Technology: 5G Cellular Enables Standalone Operation
Bluetooth Low Energy retained a dominant 61.40% share of the wearable technology market size in 2025 because of its efficiency for constant sensor streaming. Yet 5G modules will record the sharpest 18.85% CAGR, driven by consumer desire for phone-free experiences on hikes, runs, or worksites. Apple’s LTE/5G watches demonstrate a willingness to pay for autonomy, but battery stamina curbs always-connected sessions. Qualcomm’s AR1+ solves part of that dilemma via low-power radios selectable in real time.
NFC and UWB adoption rise as contactless payment and indoor navigation use cases multiply. Satellite and LP-WAN modems target safety beacons and asset tracking in remote areas. Wi-Fi remains necessary for software updates, though power constraints limit duty cycles. The expansion of multi-protocol chipsets underpins best-of-both-worlds architectures that elevate user experience and sustain the wearable technology market.
By End-User Industry: Healthcare Drives Premium Adoption
Consumer electronics still account for 57.20% of revenue, but healthcare devices will grow at a 20.10% CAGR through 2031 as payers reimburse more indications. Dexcom’s USD 75 million stake in Oura links glucose data with sleep and stress metrics to build a full metabolic dashboard. FDA’s green light for automated insulin dosing in type 2 diabetes widens the pool of eligible patients. Cardiology is another hotspot; WearLinq’s 6-lead ECG patch brings hospital-grade diagnostics to outpatient settings.
Industrial and enterprise buyers deploy AR headsets to slash training time and prevent errors. Defense agencies demand rugged wearables capable of running classified apps offline. Across sectors, premium pricing is secured when devices deliver quantifiable outcomes, whether medical cost avoidance or productivity gains, fuelling the expansion of the wearable technology market.
By Connectivity Technology: Multi-Protocol Architectures Optimize Performance
Market leaders now embed Bluetooth, Wi-Fi, cellular 5G, NFC, UWB, and satellite links on one board. Dynamic switching selects the lowest-energy path that still meets bandwidth needs. The concept boosts average device ASP while maintaining battery life and is rapidly becoming a standard expectation among professional and fitness users. Qualcomm’s integrated approach is setting a reference design that tier-two OEMs follow, reinforcing the pace of growth across the wider wearable technology market.
Geography Analysis
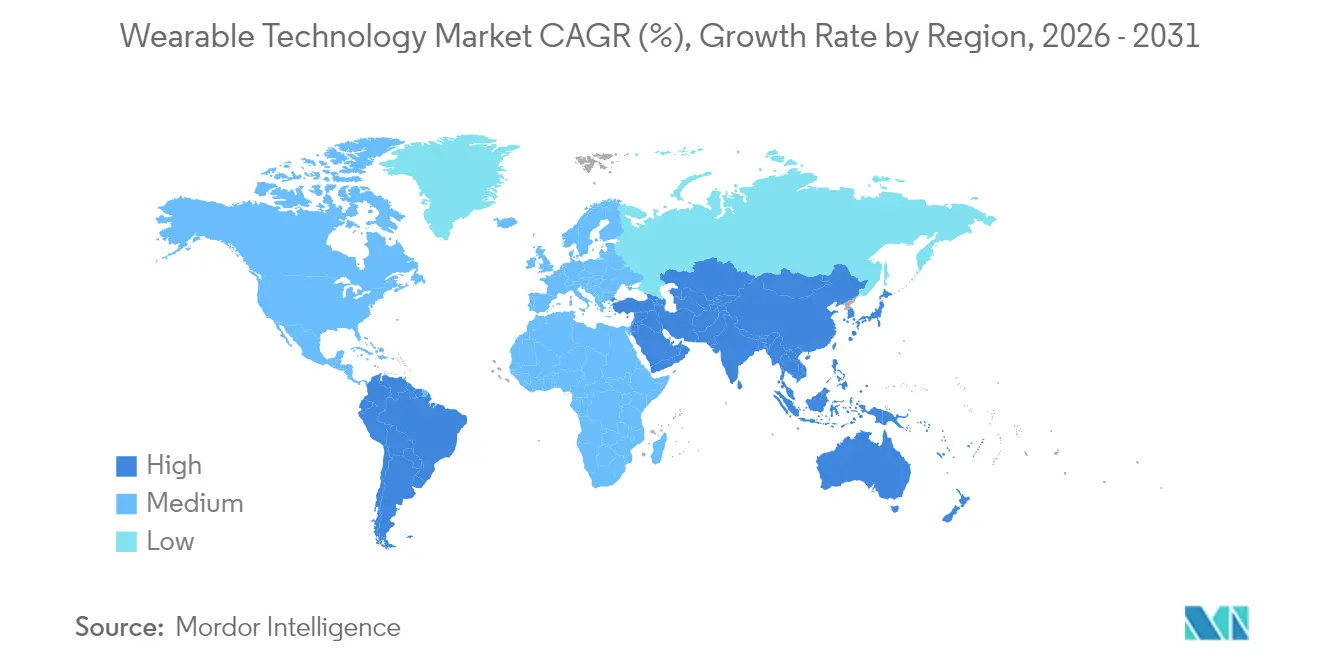
North America generated 31.70% of 2025 revenue, reflecting R&D leadership, venture funding depth, and favourable reimbursement policy. The FDA authorized 124 novel devices in 2023, its highest annual total, shortening commercialization timelines. Enterprise AR pilots run by U.S. multinationals contribute to steady hardware refresh cycles. Nonetheless, elevated abandonment rates reveal ongoing gaps in consumer onboarding and value delivery.
Asia-Pacific is projected to expand at a 20.25% CAGR over 2026-2031, making it the primary volume engine for the wearable technology market. China’s policy support for digital health and Korea’s leadership in 3 nm foundry and solid-state batteries accelerate regional supply-chain self-sufficiency. India’s fitness-aware middle class and Japan’s aging population further stretch demand curves. TSMC’s new fabs in Arizona and Kumamoto add resilience yet keep key process know-how in the region.
Europe balances strict privacy and sustainability rules with strong industrial automation demand. GDPR and the WEEE directive increase compliance burden but also create competitive moats for vendors with robust governance. Germany’s smart-factory programs and the U.K.’s National Health Service pilots on remote monitoring offer stable enterprise pipelines. Smaller markets in the Middle East, Africa, and South America trail in infrastructure and discretionary income, yet they represent option value as connectivity costs fall, and local app ecosystems mature.

Regulatory Landscape
Wearables span consumer electronics and regulated medical devices, so compliance depends on whether a product makes diagnostic or therapeutic claims and how it handles biometric data. In January 2026, the US Food and Drug Administration (FDA) revised its General Wellness: Policy for Low Risk Devices guidance, clarifying enforcement discretion for low-risk wearable features that estimate physiological parameters when positioned strictly for general wellness use. Alongside this, FDA activity through the Digital Health Center of Excellence and updated Clinical Decision Support (CDS) guidance in January 2026 continues to influence how software in wearables is treated under device rules.
In Europe, wearable makers must account for GDPR, the EU Medical Device Regulation (MDR) and the EU AI Act (Regulation 2024/1689) when offering AI-enabled medical functionality. A May 2026 provisional political agreement on a Digital Omnibus package extended the compliance deadline for product-embedded high-risk AI systems, including those in medical devices and IVDs, to August 2, 2028, which changes how companies plan technical documentation for dual MDR and AI obligations. Cybersecurity expectations are also becoming more explicit for connected wearables: ETSI began public consultation in April 2026 on EN 304-634 draft standards for personal wearables intended to support the EU Cyber Resilience Act, reinforcing secure-by-design requirements for devices sold into the EU.
Competitive Landscape
The sector shows moderate concentration: the top five vendors collectively account for roughly 62% of revenue, yielding a score of 6 on the market concentration scale. Apple posted USD 7.5 billion in wearables revenue in Q2 2025, illustrating the power of device-plus-service bundling. Samsung’s KRW 79.14 trillion quarter confirms its strength in multi-device ecosystems. Meta invested USD 3.5 billion in EssilorLuxottica, securing optical expertise for smart glasses, while Google aligned with Warby Parker to broaden distribution.
Patent filings spotlight hand-gesture recognition, low-power sensing, and federated learning, signalling where differentiation may lie over the next cycle. New entrants concentrate on smart rings and neural interface bands, attacking whitespace not fully addressed by incumbents. Component suppliers such as TDK, Qualcomm, and TSMC gain bargaining power as their technologies become critical to form-factor evolution. Overall, sustained R&D outlays and ecosystem lock-in remain the primary defensive walls in the wearable technology market.
Wearable Technology Industry Leaders
Apple Inc.
Samsung Group
Xiaomi Inc.
Fitbit Inc.
Sony Corporation
- *Disclaimer: Major Players sorted in no particular order

Market Opportunities and Future Outlook
Healthcare-grade wearables and regulated wellness features are expanding monetization paths beyond step counts, helped by clearer separation between general wellness and medical-device claims. FDA updates in January 2026 to its General Wellness guidance and CDS guidance support product teams in distinguishing low-risk wellness features from regulated decision-support functionality, while the Quality Management System Regulation (QMSR) transition in February 2026 (incorporating ISO 13485:2016) raises the quality bar for companies pursuing clinical claims. This combination creates room for OEMs and component suppliers to package sensor accuracy, documentation, and post-market processes for faster program execution in remote monitoring use cases.
Interoperability and trust are increasingly framed as purchase drivers as wearables move into payments, clinical screening, and enterprise deployments. Standards work is also providing concrete inputs for product roadmaps, including IEEE 1708-2025 for cuffless wearable blood pressure performance evaluation, IEEE 3408-2026 security requirements for wearable devices supporting payment services, and IEC 63430:2025 data container formats for wearable sensors to improve data portability between edge devices and cloud systems. Enterprise AR deployments cited in the market context, such as Shell using intrinsically safe AR wearables across 12 countries, show a procurement model tied to ROI, while consumer ecosystems are pushing cross-platform compatibility, including Xiaomi wearables adding support for Apple Find My and Google Find Hub networks in its 2026 lineup.
Recent Industry Developments
- June 2026: Samsung announced a major update to the Samsung Health app, positioning upcoming Galaxy Watch models as more proactive, AI-powered health companions. The update reinforces Samsung's services layer and adds differentiation in a market where hardware features are increasingly similar across tiers.
- May 2026: Google Fitbit introduced Fitbit Air, a screenless health tracker designed around continuous wear and tighter integration with the Google Health app and Google Health Coach. By focusing on a simpler, lower-friction form factor, Fitbit broadened its addressable user base and leaned into ecosystem-driven retention rather than premium smartwatch upgrades.
- September 2024: Apple introduced Apple Watch Series 10 with updated hardware and health-focused capabilities aimed at driving smartwatch replacement cycles. The rollout kept Apple anchored in the premium smartwatch segment while reinforcing its device-plus-services approach to wellness tracking and engagement.


Research Methodology Framework and Report Scope
Market Definition and Coverage
For this study, the wearable technology market covers connected electronic devices worn on the body that capture data, provide notifications, or enable digital services through sensors, software, and wireless connectivity, and then generate hardware, software, and service revenues across use cases.
Scope exclusions: We exclude non-connected personal accessories and standard consumer electronics that are not designed to be worn (even if they can pair with wearables).
Segmentation Overview
- By Device Type
- Smart Watches
- Ear-wearables
- Head-Mounted Displays
- Smart Clothing
- Wristbands
- By Component
- Processors and Memory
- Sensors
- Displays
- Batteries
- Connectivity ICs
- Software and Services
- By Connectivity Technology
- Bluetooth and BLE
- Cellular (LTE/5G)
- Wi-Fi
- NFC and UWB
- Satellite and LP-WAN
- By End-User Industry
- Consumer Electronics
- Healthcare and Medical
- Industrial and Enterprise
- Defense and Public Safety
- By Geography
- North America
- United States
- Canada
- Mexico
- Europe
- United Kingdom
- Germany
- France
- Italy
- Rest of Europe
- Asia-Pacific
- China
- Japan
- India
- South Korea
- Rest of Asia
- Middle East
- Israel
- Saudi Arabia
- United Arab Emirates
- Turkey
- Rest of Middle East
- Africa
- South Africa
- Egypt
- Rest of Africa
- South America
- Brazil
- Argentina
- Rest of South America
- North America
Data Sources, Market Sizing, and Validation
Desk Research
We start by building a fact base on shipments, adoption, and pricing, which helps us avoid sizing the market from a single narrative. Public and official sources are used for anchors, such as ITU indicators for connectivity, OECD health statistics for chronic-condition prevalence, US FDA public device databases for approved wearable-related clearances, and WIPO patent databases for sensor and wearable filings.
To connect the dots, we also review company filings, earnings decks, and import and export releases where relevant, and we use association and standards bodies that publish wireless and device specifications. Alongside that, a paid subscription for company financials and intelligence is used to cross-check revenue splits and recent product cycles, and a patent database subscription is used to validate the direction of innovation. These examples are not exhaustive, and additional public sources were also used for data collection, validation, and clarification.
Primary Interviews and Surveys
Primary interviews and surveys are used to pressure-test the desk view of category growth, pricing moves, and channel shifts. We typically speak with device brands, component and module suppliers, distributors, and buyers across consumer, healthcare, and enterprise use cases, then reconcile differences across APAC, EMEA, and the Americas so local adoption patterns do not get averaged out.
Distribution of primary research fieldwork respondents
| Company type | Respondent position | Region |
|---|---|---|
| Top tier: 39% | CXOs: 15% | APAC: 47% |
| Mid tier: 46% | Functional/Unit leaders: 33% | EMEA: 35% |
| Smaller Players: 15% | Managers: 52% | Americas: 18% |
Market-Sizing & Forecasting
Sizing starts with a top-down build where device demand pools are reconstructed using a mix of installed base trends, replacement cycles, and category penetration by major wearable types, and then translated into value using observed price bands and mix shifts. To keep the result realistic, it is corroborated with selective bottom-up approximations, such as sampled ASP times volume checks by device class and channel, followed by adjustments where the two views disagree.
Inputs that matter in this market include smartwatch and ear-wearable shipment momentum, sensor content per device, Bluetooth and cellular attachment rates, healthcare monitoring uptake (including reimbursement sensitivity in some countries), and average selling price changes during new model launches and discount seasons. Where a country has limited public visibility, gaps are handled by using proxy indicators like smartphone penetration, income bands, and regional channel checks, and then validated again with expert feedback.
For forecasting, we apply scenario analysis supported by a simple multivariate regression layer, where growth is linked to connectivity availability, consumer spending cycles, and health and fitness engagement signals. Assumptions are reviewed with interviewees so the forward curve reflects what buyers and suppliers expect, not just historical momentum.
Data Validation & Update Cycle
Model outputs are checked against independent signals such as unit shipment commentary, pricing movements, and regional demand shifts, and large variances are flagged for review. We also run consistency checks across device types, component contribution, and connectivity mix so the totals add up in a practical way.
Before sign-off, the work goes through a multi-step internal review where assumptions, conversions, and outliers are re-tested, and experts are re-contacted when a change materially affects the outcome. Reports are refreshed annually, and interim updates are made when major launches, regulation changes, or supply shocks create a noticeable step change. Right before delivery, a fresh pass is completed so clients receive the latest updated view.
Mordor Intelligence's Wearable Technology Market Size Compared Against Other Published Estimates
It is normal to see different market values for wearable technology because publishers do not always count the same revenue lines, geographies, or device families, and their base year timing can also vary. The spread usually comes from what gets counted as a wearable, how software and services are treated, and whether pricing is modeled as stable or rising with feature upgrades.
A practical gap driver here is scope, where some estimates focus mainly on consumer devices like activity trackers and body monitors, while others expand into broader component, connectivity, and enterprise-linked value. Another driver is the price curve, since aggressive ASP step-ups during refresh cycles can lift totals quickly if not cross-checked against mix and discounting. Here, the modeling uses device type mix, connectivity attachment, and seasonal pricing checks before the final number is locked, which is the same approach used across the published market sizing work at Mordor Intelligence.
Benchmark comparison
| Source | Market Size | Gaps in Research Methodology |
|---|---|---|
| Mordor Intelligence | USD 219.30 B (2025) | |
| Industry Publisher A | USD 92.90 B (2025) | Typically stays closer to consumer wearables and may not fully account for component-level value and broader end-user coverage, which can lower the total even when growth direction is similar. |
| Industry Publisher B | USD 86.78 B (2025) | Uses a different device and use-case perimeter and a longer forecast frame, and the base-year currency and pricing assumptions can dampen the 2025 starting value compared with broader scope builds. |
Across the three values, the main story is that a wider counted revenue stack and a more explicit mix-and-price treatment can materially change the 2025 total. When the scope is kept consistent and checked against adoption and pricing signals, the resulting market size is easier to trace and replicate across regions and device categories.


Key Questions Answered in the Report
What is the projected value of the wearable technology market in 2031?
The sector is expected to reach USD 572.73 billion by 2031 at a 17.35% CAGR.
Which region will grow the fastest through 2031?
Asia-Pacific is forecast to expand at a 20.25% CAGR, outpacing all other regions.
Which device category currently holds the largest revenue?
Smartwatches maintained a 45.60% share in 2025, the highest among all device types.
Why are solid-state batteries important for future devices?
They offer higher energy density and improved safety, enabling thinner designs and week-long runtimes.
How are insurers influencing adoption?
Reimbursement policies now cover FDA-cleared wearables for chronic-disease management, lowering patient costs and boosting uptake.
What factor most limits long-term consumer usage?
User fatigue and perceived lack of ongoing value drive abandonment rates of nearly 30% within six months.
Page last updated on:




