Wearable Patch Market Size and Share
Market Overview
| Study Period | 2020 - 2031 |
|---|---|
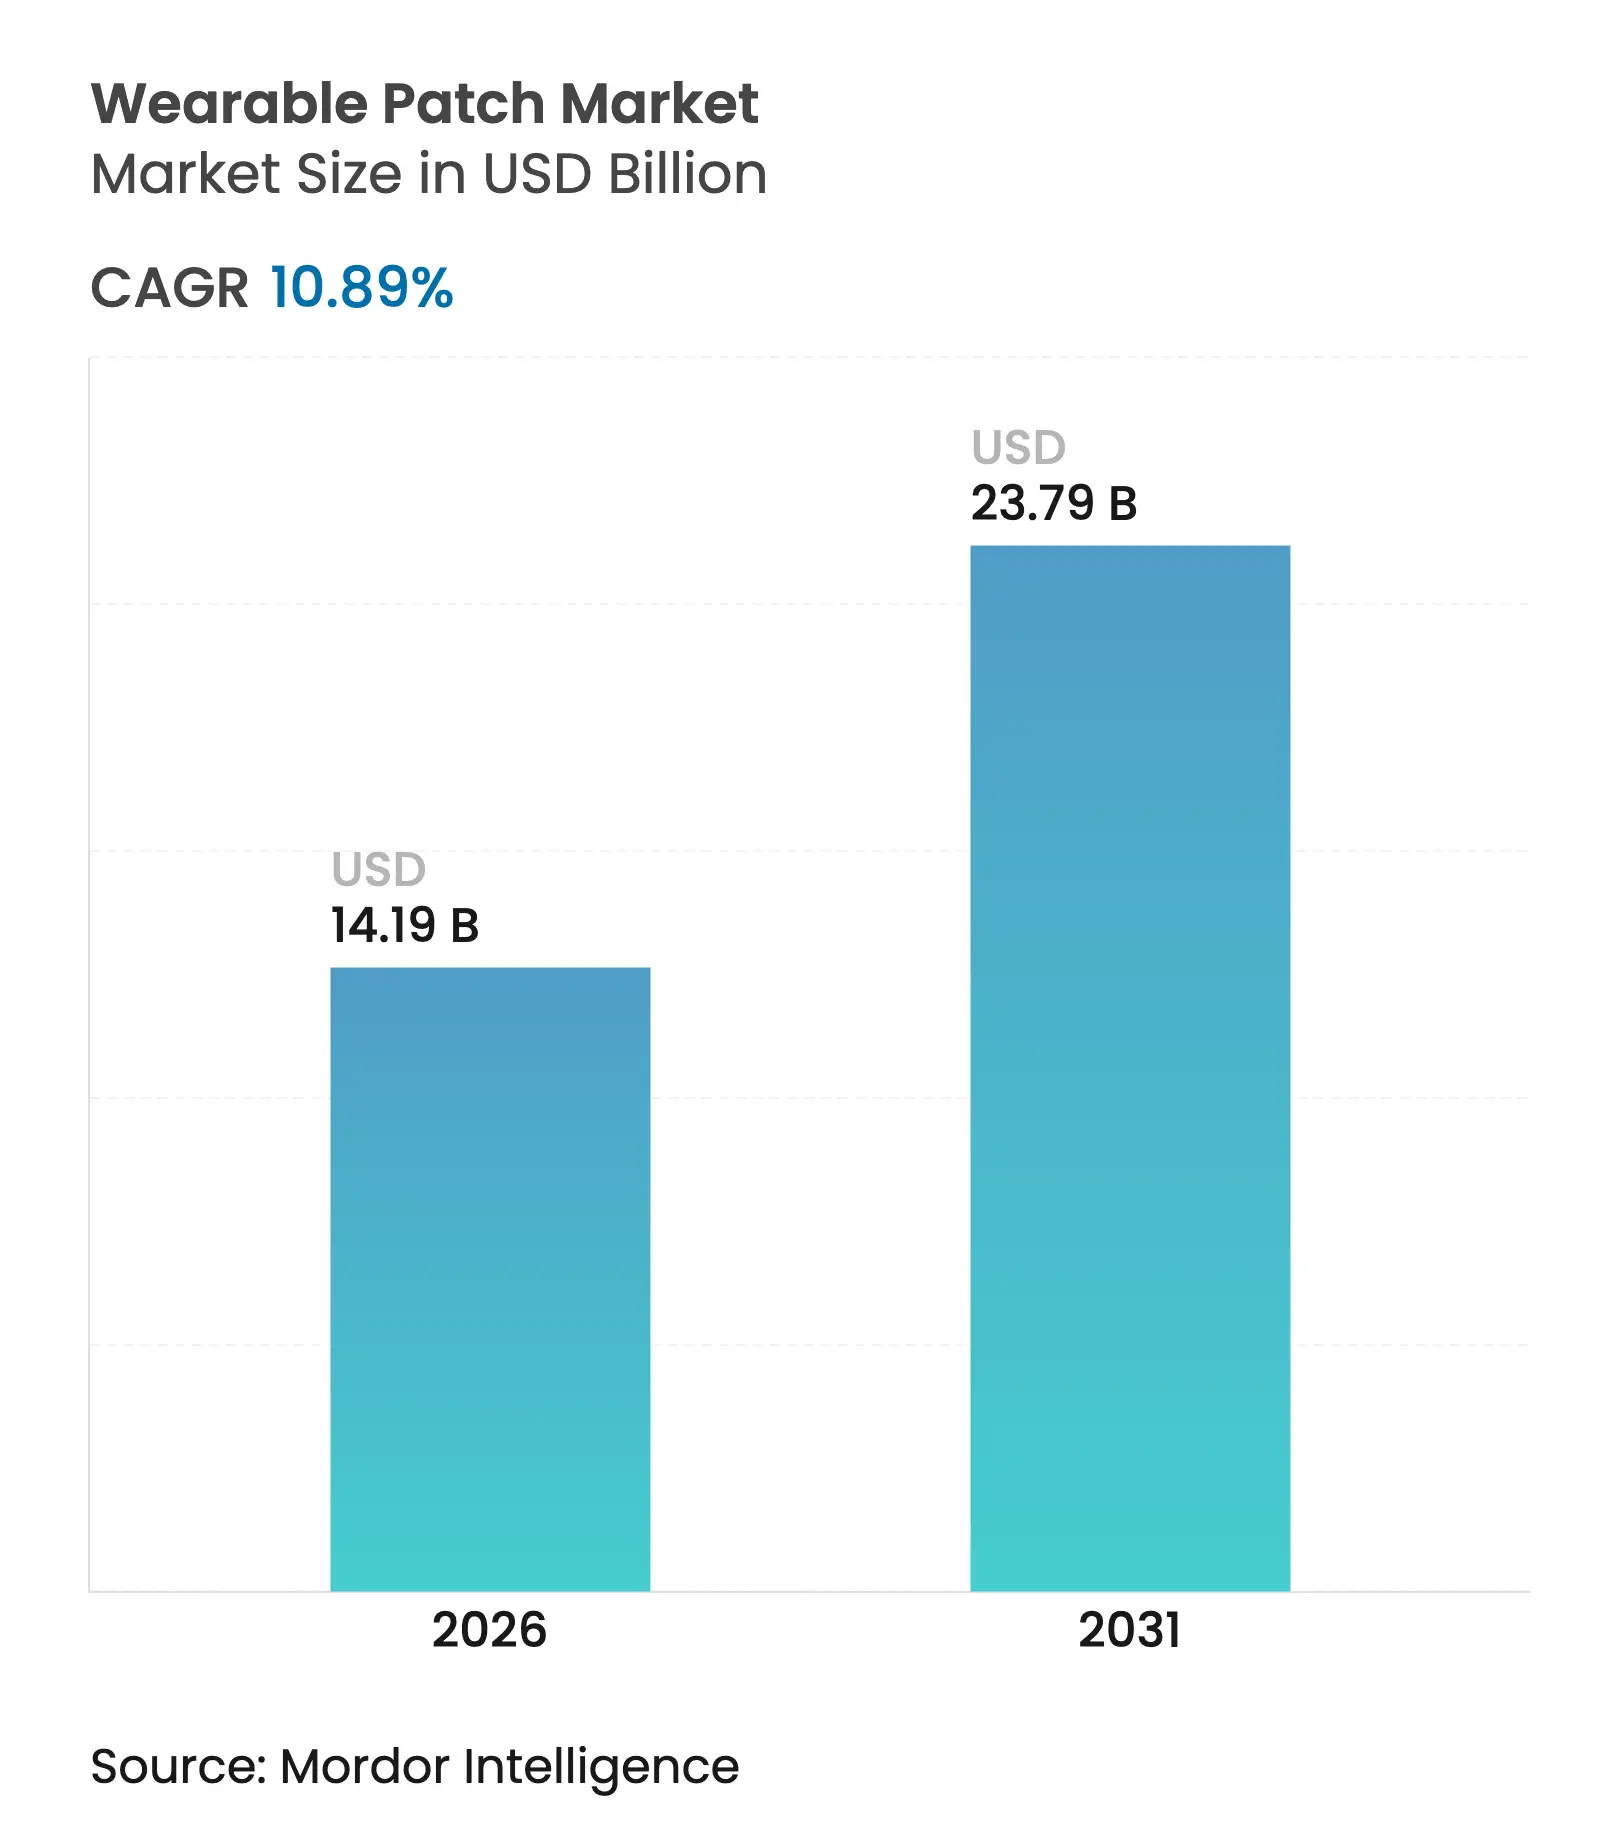
| Market Size (2026) | USD 14.19 Billion |
| Market Size (2031) | USD 23.79 Billion |
| Growth Rate (2026 - 2031) | 10.89 % CAGR |
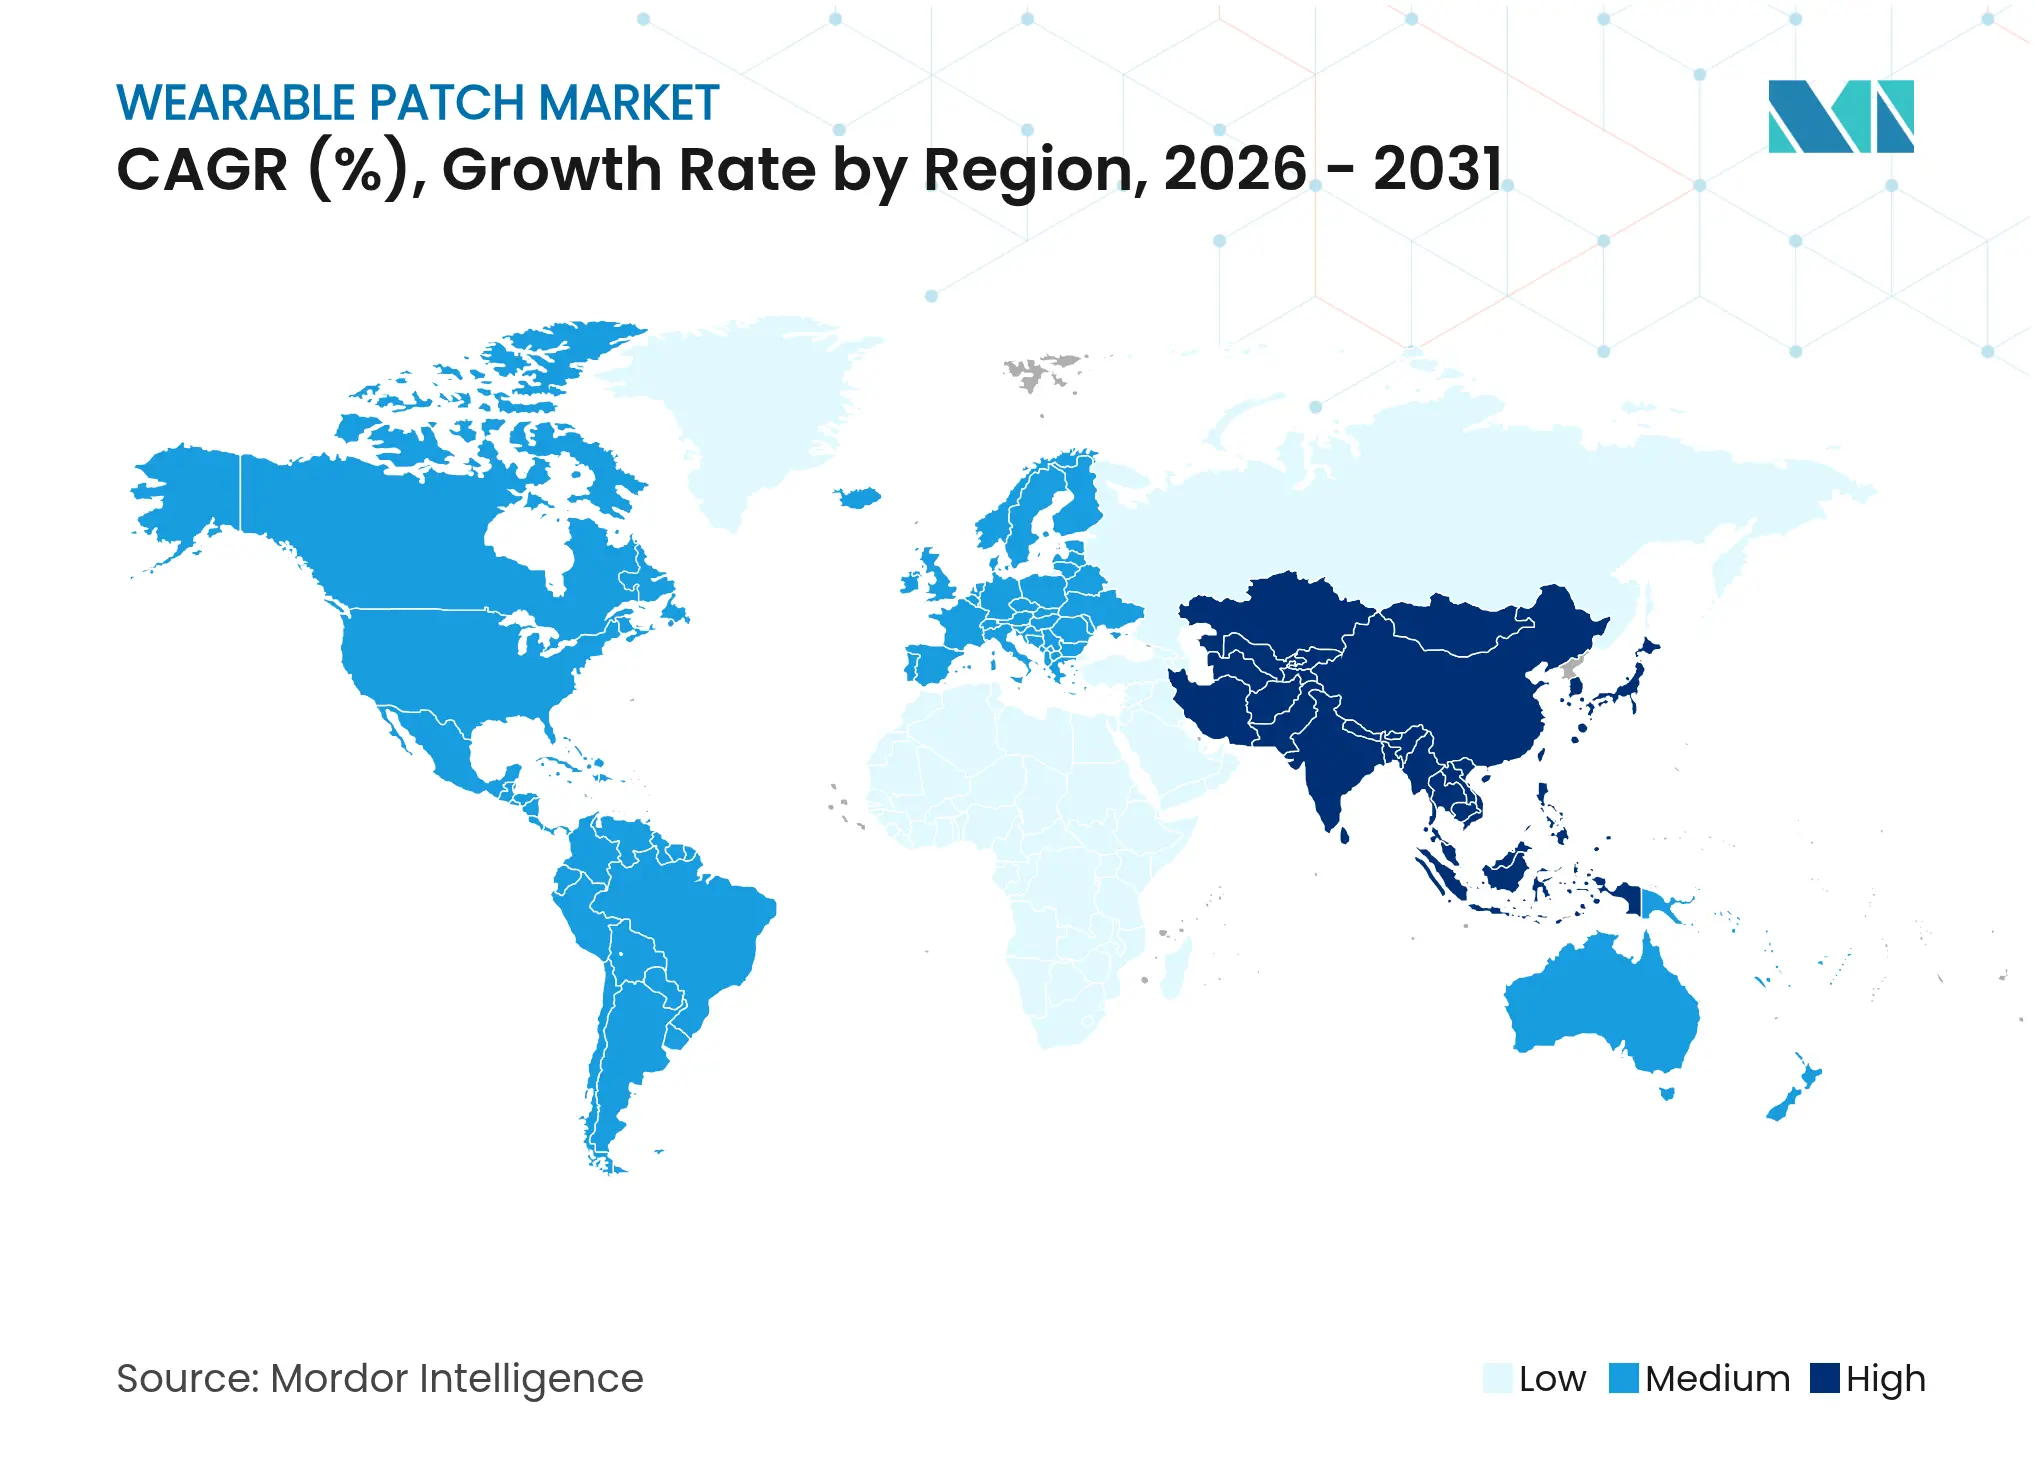
| Fastest Growing Market | Asia Pacific |
| Largest Market | North America |
| Market Concentration | Medium |
Major Players *Disclaimer: Major Players sorted in no particular order. Image © Mordor Intelligence. Reuse requires attribution under CC BY 4.0. |
Wearable Patch Market Analysis by Mordor Intelligence
The Wearable Patch Market size was valued at USD 12.80 billion in 2025 and estimated to grow from USD 14.19 billion in 2026 to reach USD 23.79 billion by 2031, at a CAGR of 10.89% during the forecast period (2026-2031). Miniaturized flexible electronics, clearer regulatory pathways and widening remote-care programs collectively reinforce demand across hospitals, home settings and decentralized trials. Supply-side progress in stretchable semiconductors lowers device cost and boosts manufacturing yields, while reimbursement expansion for digital therapeutics accelerates adoption among chronic-care payers. Component shortages restrain short-term volumes, yet strategic supplier diversification and roll-to-roll fabrication mitigate risk in the medium term. Incumbent device majors defend installed bases through connectivity upgrades, whereas sensor start-ups pursue niche indications, sustaining a virtuous cycle of incremental innovation that keeps the wearable patch market on a double-digit growth trajectory.
Key Report Takeaways
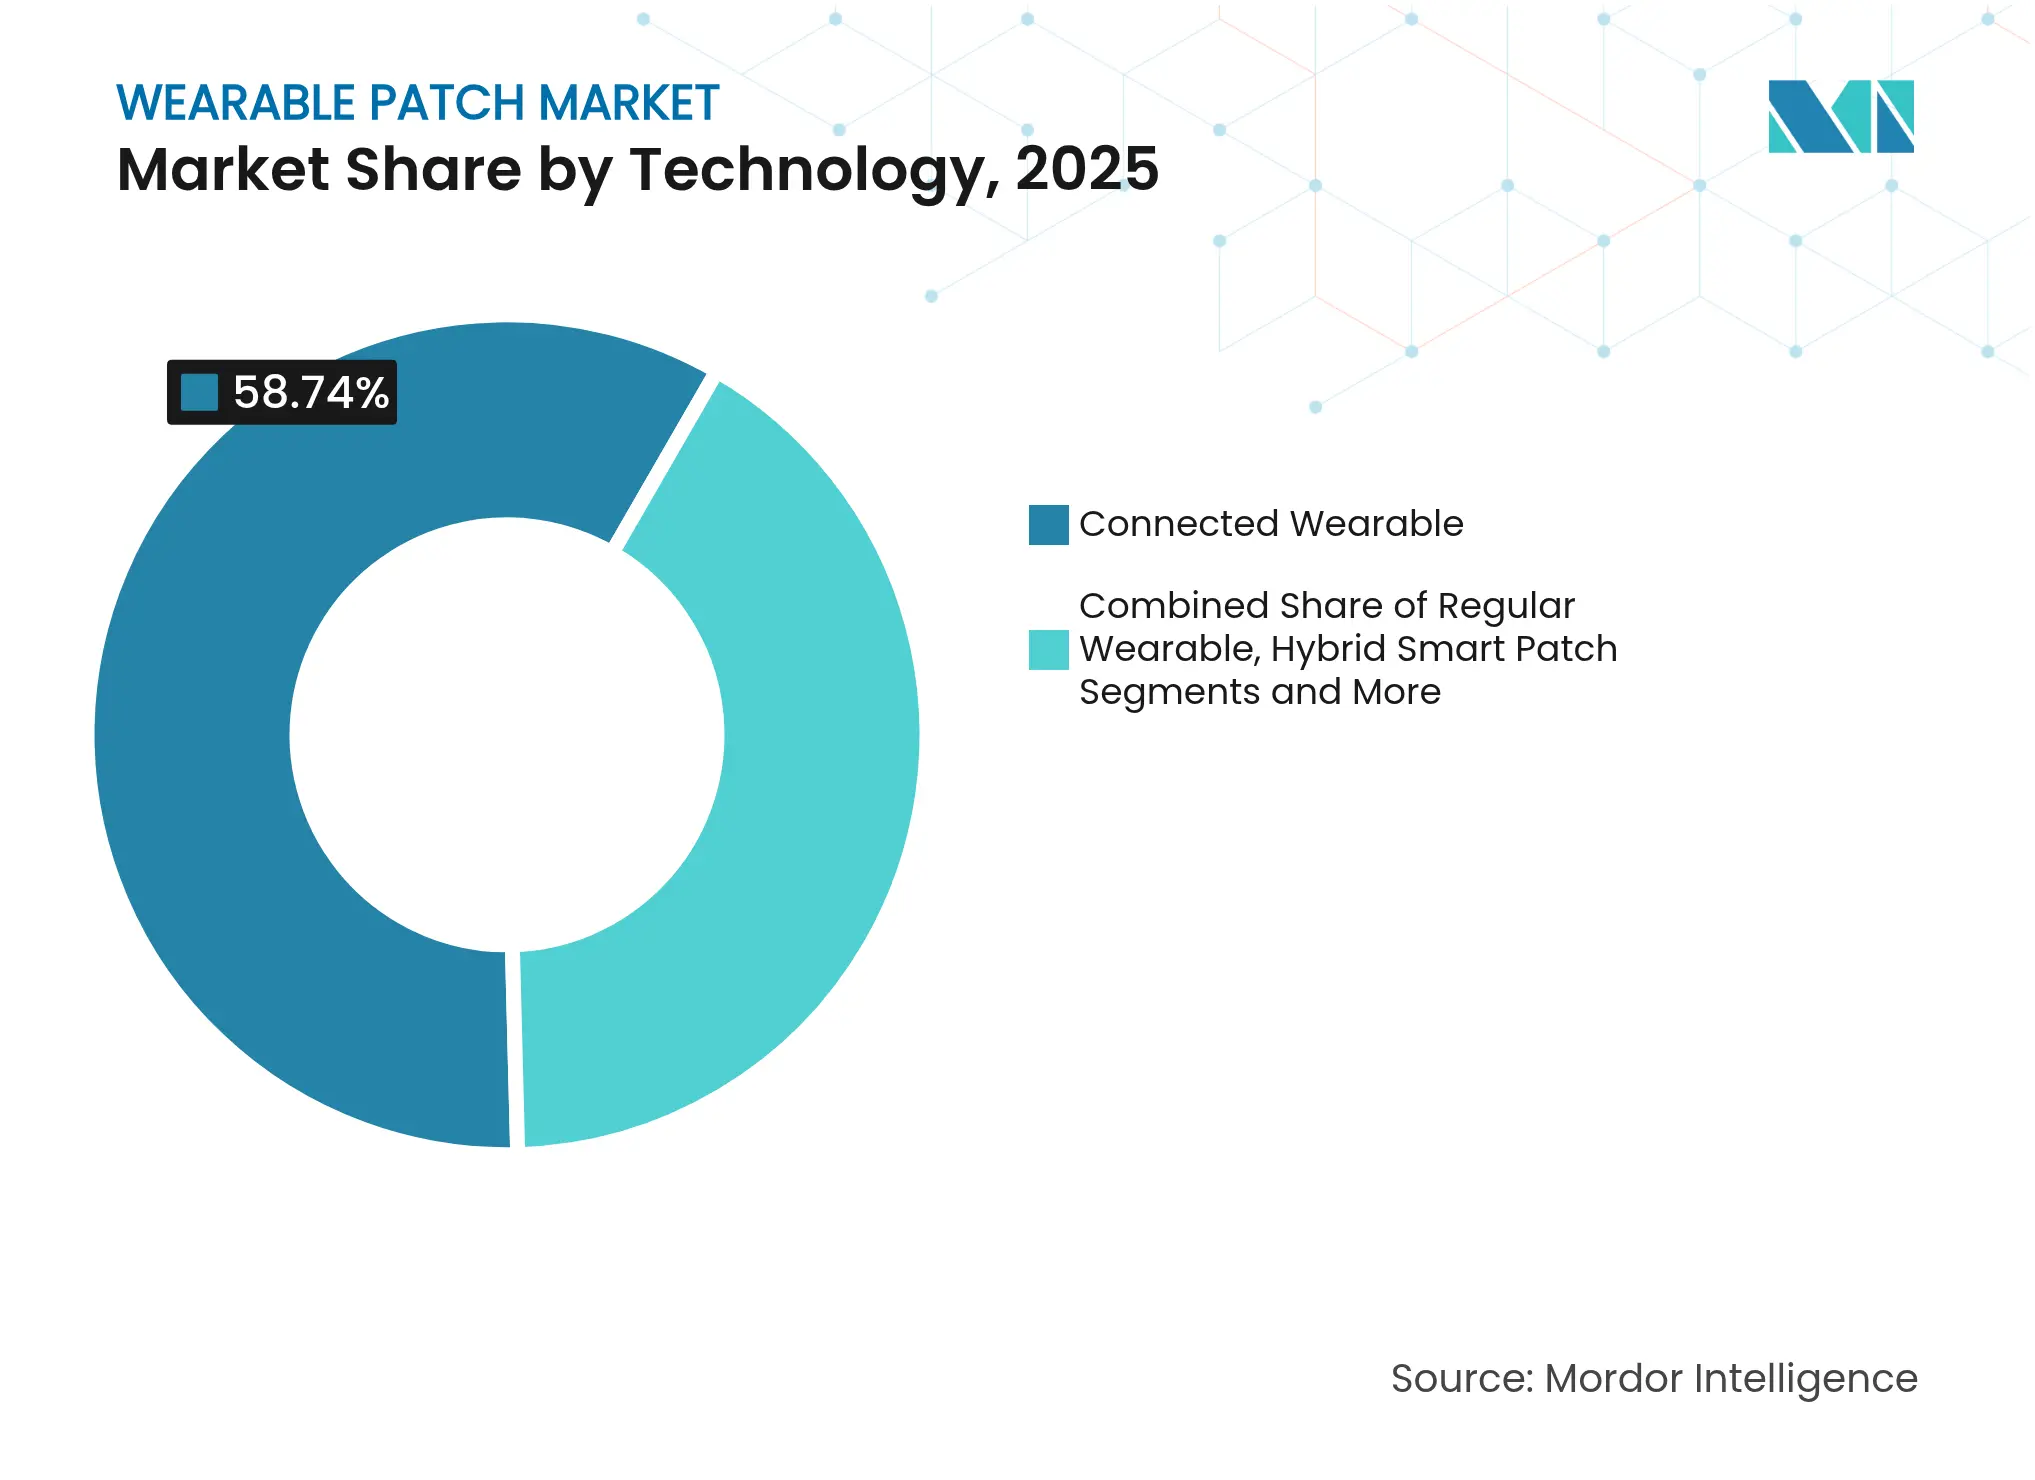
- By technology, connected wearable technology led with 58.74% revenue share in 2025; hybrid smart patches are forecast to expand at a 12.62% CAGR through 2031.
- By application, monitoring and diagnostics captured 61.65% share of the wearable patch market size in 2025 and women's health/FemTech applications are projected to advance at a 12.51% CAGR to 2031.
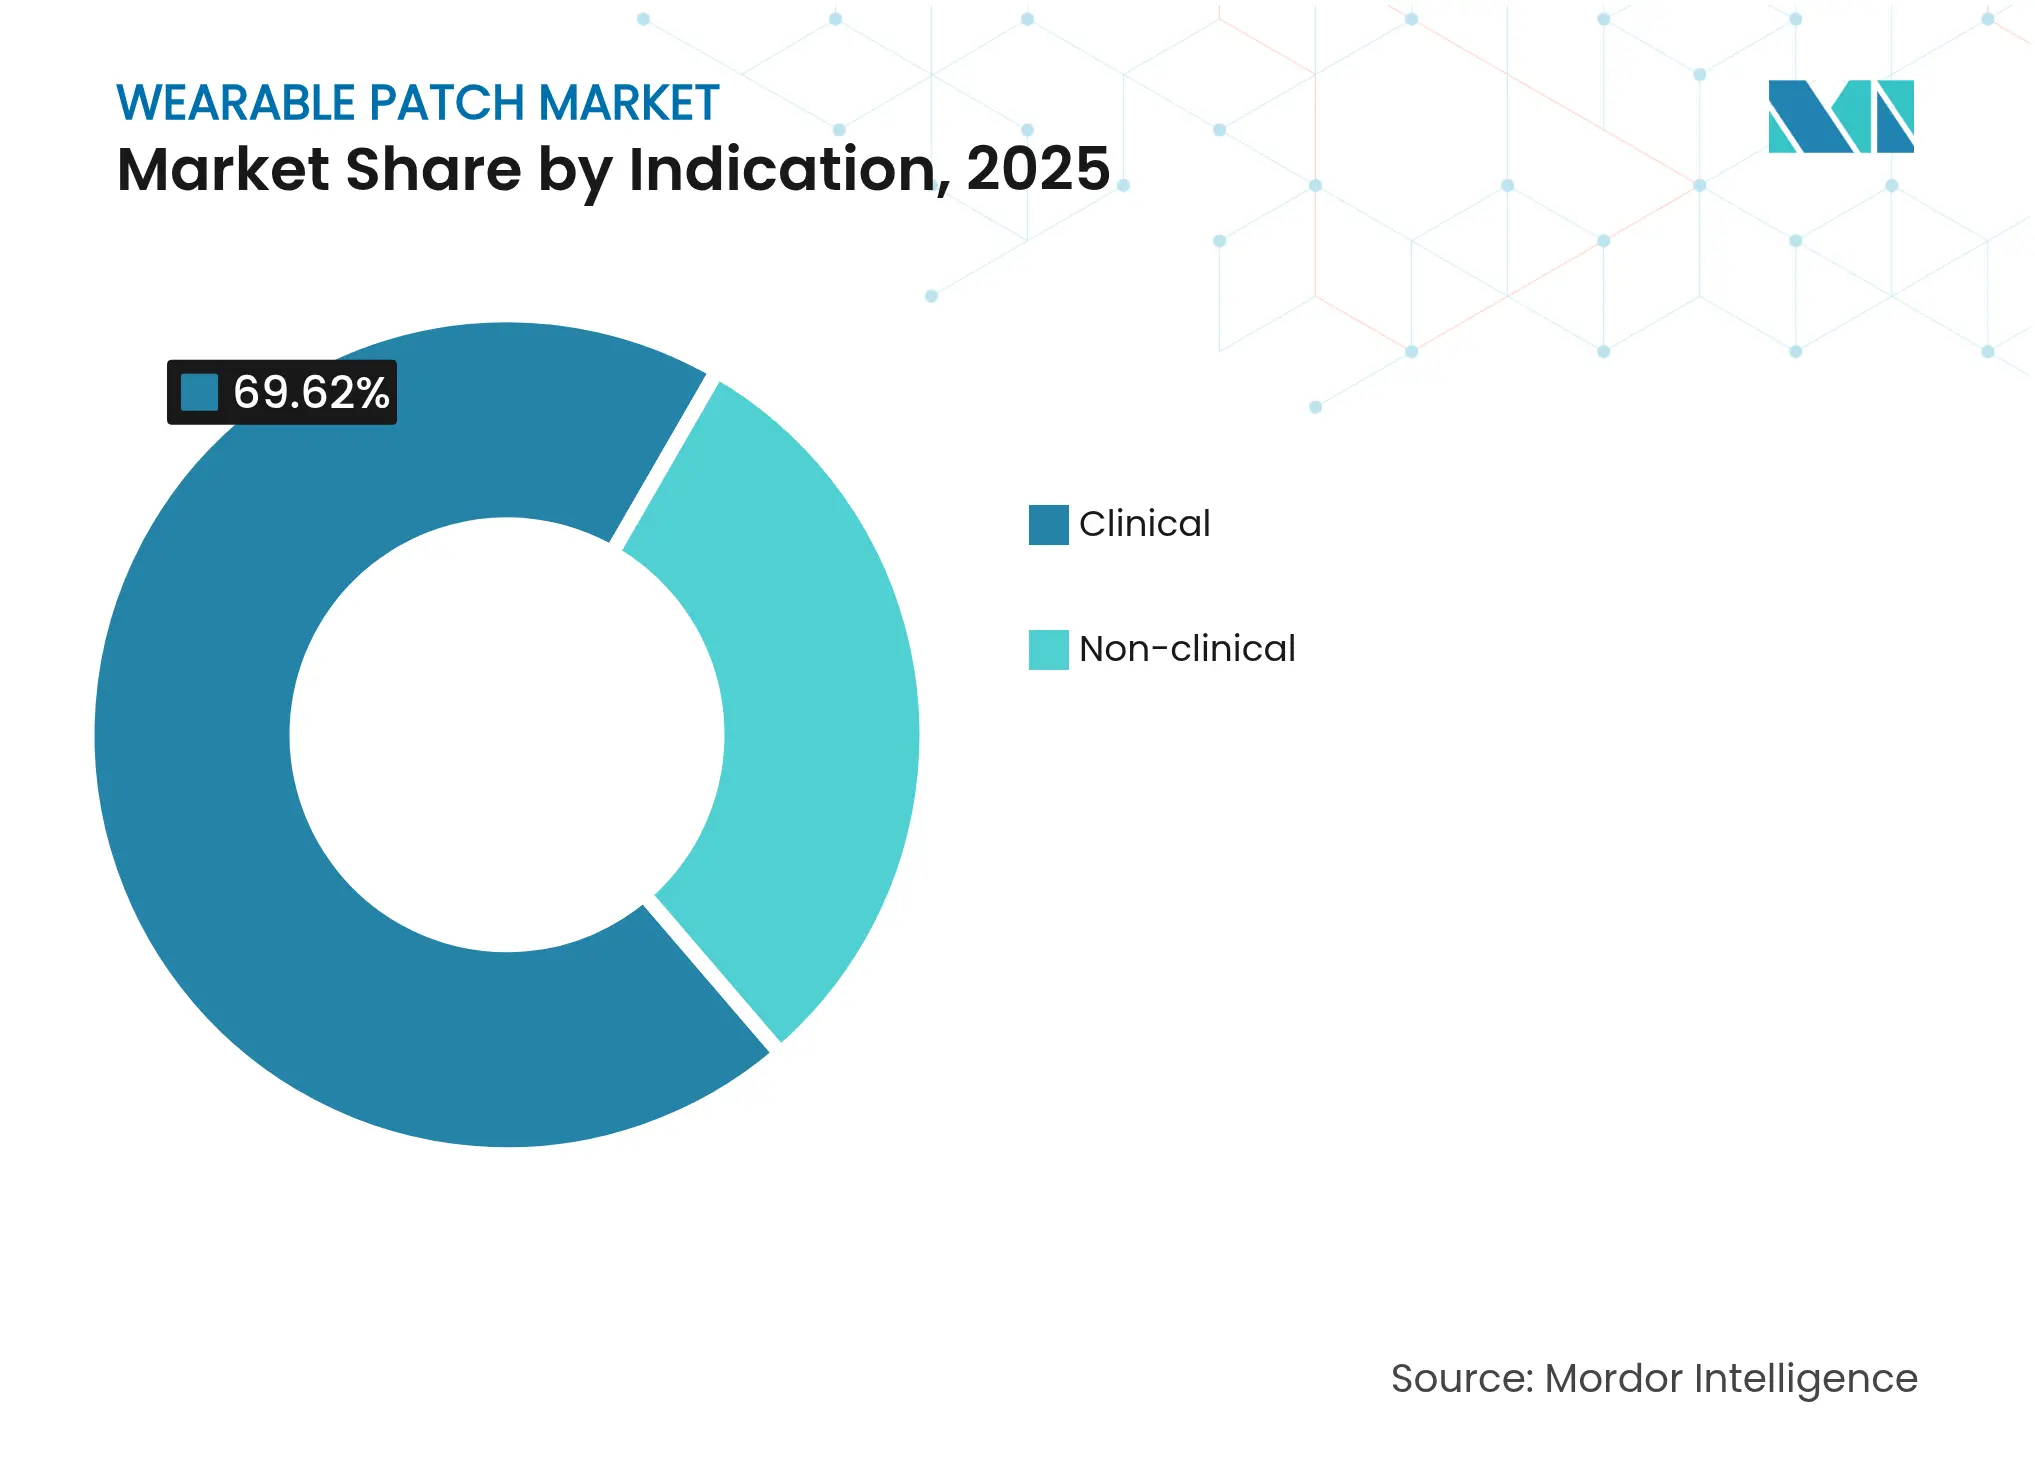
- By indication, clinical applications commanded 69.62% of the wearable patch market share in 2025, while non-clinical segments are set to grow at a 12.2% CAGR through 2031.
- By geography, North America held 38.97% of the wearable patch market in 2025 and Asia Pacific is anticipated to expand at a 12.86% CAGR through 2031.
Note: Market size and forecast figures in this report are generated using Mordor Intelligence's proprietary estimation framework, updated with the latest available data and insights as of 2026.
Global Wearable Patch Market Trends and Insights
Drivers Impact Analysis
| Driver | (~) % Impact on CAGR Forecast | Geographic Relevance | Impact Timeline | |||
|---|---|---|---|---|---|---|
Rapid Rise in Chronic Disease Prevalence
Rapid Rise in Chronic Disease Prevalence
| +2.1% | Global, concentrated in aging populations of North America, Europe, and urban Asia Pacific | Medium term (2-4 years) |
(~) % Impact on CAGR Forecast
:
+2.1%
|
Geographic Relevance
:
Global, concentrated in aging populations of North
America, Europe, and urban Asia Pacific
|
Impact Timeline
:
Medium term (2-4 years)
|
Growing Demand for Home-Based Healthcare and RPM
Growing Demand for Home-Based Healthcare and RPM
| +1.8% | North America & EU leading, rapid adoption in APAC core markets | Short term (≤ 2 years) | |||
Miniaturisation and Flexible-Electronics Breakthroughs
Miniaturisation and Flexible-Electronics Breakthroughs
| +1.6% | Global innovation hubs with manufacturing concentration in Asia Pacific | Long term (≥ 4 years) | |||
Reimbursement Expansion for Digital Therapeutics
Reimbursement Expansion for Digital Therapeutics
| +1.4% | North America primary, selective EU markets, emerging in developed APAC | Medium term (2-4 years) | |||
FemTech-Focused Patch Innovations
FemTech-Focused Patch Innovations
| +1.2% | Global with early adoption in North America and Northern Europe | Medium term (2-4 years) | |||
Decentralised Clinical-Trial Adoption of Patches
Decentralised Clinical-Trial Adoption of Patches
| +0.9% | North America and EU regulatory-progressive markets | Short term (≤ 2 years) | |||
| Source: Mordor Intelligence | ||||||
Rapid Rise in Chronic Disease Prevalence
Continuous monitoring for diabetes and cardiovascular disease now underpins modern outpatient management. Element Science’s week-long wearable cardioverter defibrillator reduces false alarms while preserving therapeutic efficacy, improving adherence in high-risk arrhythmia cohorts. The device's week-long wear capability without daily maintenance addresses compliance challenges that traditionally limit therapeutic adherence, suggesting patches overcome behavioral barriers inherent in conventional monitoring approaches. Global diabetes prevalence exceeding 537 million adults sustains strong baseline demand, ensuring the wearable patch market remains integral to chronic-care workflows across payers and provider networks.
Growing Demand for Home-Based Healthcare and RPM
Remote patient monitoring programs using multi-parameter patches achieved 91% televisit engagement and 99% measurement completion in a decentralized atrial fibrillation study. Autonomous data capture from Vivalink’s cleared sensor suite eliminates on-site visits and shortened enrollment times by 40%, reinforcing the economic rationale for wear-at-home solutions in both care delivery and clinical research. This further indicates that the patches resolve logistical constraints that historically limited clinical research accessibility.
Miniaturization and Flexible-Electronics Breakthroughs
Stanford researchers demonstrated carbon-nanotube stretchable transistors at 347 devices per square centimeter without performance loss under strain.[1]Source: Stanford News, “Advancing toward wearable stretchable electronics,” news.stanford.edu VTT’s roll-to-roll lines produce biomaterial ECG patches that meet clinical accuracy while lowering unit cost, underscoring how supply-chain innovation broadens the wearable patch market addressable base over the long term. These manufacturing innovations reduce production costs while enabling mass customization capabilities that support personalized healthcare applications.
Reimbursement Expansion for Digital Therapeutics
Dedicated billing codes and FDA breakthrough designations underpin U.S. Medicare coverage for prescription digital therapeutics.[2]Source: Center for Devices and Radiological Health, “Breakthrough Devices Program,” fda.gov The Digital Therapeutics Alliance advocates for broader device coverage under Medicare, emphasizing software-driven therapeutic interventions that demonstrate clinical efficacy comparable to traditional pharmaceuticals. The first wearable subcutaneous apomorphine infusion device for Parkinson’s disease secured favorable reimbursement, signaling payer readiness to treat complex therapeutic patches on parity with traditional interventions.
Restraints Impact Analysis
| Restraint | (~) % Impact on CAGR Forecast | Geographic Relevance | Impact Timeline | |||
|---|---|---|---|---|---|---|
Limited Long-Term Accuracy & Data Reliability
Limited Long-Term Accuracy & Data Reliability
| -1.3% | Global, particularly affecting clinical-grade applications | Medium term (2-4 years) |
(~) % Impact on CAGR Forecast
:
-1.3%
|
Geographic Relevance
:
Global, particularly affecting clinical-grade applications
|
Impact Timeline
:
Medium term (2-4 years)
|
Fragmented Global Regulatory Pathways
Fragmented Global Regulatory Pathways
| -0.8% | Cross-border markets with varying EU, US, APAC requirements | Long term (≥ 4 years) | |||
Adhesive-Induced Skin Irritation & Dermatitis
Adhesive-Induced Skin Irritation & Dermatitis
| -0.6% | Global with higher impact in humid climates and sensitive populations | Short term (≤ 2 years) | |||
Cyber-Security & GDPR/HIPAA Compliance Hurdles
Cyber-Security & GDPR/HIPAA Compliance Hurdles
| -0.4% | North America and EU primarily, expanding to APAC markets | Medium term (2-4 years) | |||
| Source: Mordor Intelligence | ||||||
Limited Long-Term Accuracy & Data Reliability
Sensor drift hampers wear durations beyond two weeks, compelling costly recalibration. Biolinq’s intradermal multi-analyte platform raised USD 100 million to extend glucose accuracy across 15-day cycles,[3]Source: FinSMEs, “Biolinq Closes $100M Series C Financing,” finsmes.com but sector-wide quality-control upgrades remain essential before broader clinical reimbursement materializes. Manufacturing variability in flexible electronics creates performance inconsistencies that limit clinical adoption, requiring enhanced quality control processes and standardized calibration protocols to achieve medical-grade reliability standards.
Fragmented Global Regulatory Pathways
Divergent U.S. 510(k) and EU CE-mark routes inflate submission cycles, while PATCH Act cybersecurity clauses introduce additional documentation for software bills of materials. Smaller innovators absorb disproportionate cost, slowing cross-border launches and temporarily moderating global momentum in the wearable patch market. Harmonization efforts remain insufficient to streamline global market access, requiring manufacturers to navigate multiple regulatory frameworks simultaneously.
Segment Analysis
By Technology: Connected Dominance Faces Hybrid Disruption
Connected patches retained 58.74% share of the wearable patch market in 2025 as real-time data streaming enables immediate clinical triage. Smartphone-synced alerting and cloud dashboards have become standard features, driving high replacement rates among diabetes and cardiac users. Hybrid smart patches will grow at a 12.62% CAGR to 2031, supported by in-patch micropumps and closed-loop electrostimulation that blur monitoring and therapy use cases. As component prices fall, connected SKUs occupy mainstream formularies, while premium hybrid devices attract specialty clinics and payers seeking bundled outcome gains.
Disposable biosensor formats remain attractive for infection-control protocols, especially in inpatient telemetry. Conversely, reusable platforms benefit sports and wellness consumers who prioritize multi-year value. Stretchable RF circuits maintaining 30 m wireless range offer mobility without sacrificing data fidelity, a feature that further entrenches connected devices within the wearable patch market. Hybrid patches, albeit pricier, monetize advanced disease-management subscriptions, giving suppliers higher lifetime value per patient.
Note: Segment shares of all individual segments available upon report purchase
By Application: Monitoring Leadership Challenged by Therapeutic Innovation
Monitoring and diagnostics delivered 61.65% revenue in 2025, anchoring the wearable patch market size for hospital discharge programs and ambulatory ECG services. Rising chronic-care enrollment and insurer mandates for continuous glucose monitoring reinforce this foundation. FemTech solutions will lift women’s health to a 12.51% CAGR through 2031 by providing painless hormone, fertility and menopause tracking.
Drug-delivery patches integrate microneedles and iontophoresis to transport molecules such as iron and insulin without injections, straightening adherence curves in anemic and diabetic cohorts. Digital pain-management patches couple TENS with adaptive dosing algorithms, shifting opioid stewardship toward non-pharmacologic modalities. Multifunctional prototypes combining ECG with on-demand therapy illustrate convergent design paths that will gradually erode the dominance of pure-monitoring SKUs.
By Indication: Clinical Applications Drive Growth Despite Consumer Expansion
Clinical use retained 69.62% of the wearable patch market share in 2025, sustained by payer reimbursement and FDA validation of therapeutic efficacy. Breakthrough designations for heart-failure algorithms and AI defibrillator patches highlight regulatory confidence in high-acuity applications. Clinical CAGR is projected at 10.63% through 2031, aided by hospital automation and telecardiology expansion.
Non-clinical applications—spanning fitness, corporate wellness and pharmacy-channel glucose sensors—will advance at 12.2% CAGR, propelled by consumer willingness to self-fund proactive health monitoring. Over-the-counter CGMs such as Abbott Lingo and Dexcom Stelo shorten upgrade cycles and enlarge the total addressable pool beyond diagnosed patients. Consumer growth diversifies revenue streams and reduces reliance on payer policy shifts, offering suppliers a hedge against reimbursement volatility.
Note: Segment shares of all individual segments available upon report purchase
Geography Analysis
North America contributed 38.97% of 2025 value, underpinned by mature reimbursement, broad internet penetration and high chronic-disease incidence. U.S. Centers for Medicare and Medicaid Services formalized codes for remote physiologic monitoring, accelerating physician adoption. Canada’s single-payer initiatives add incremental volumes, while Mexico’s private insurers trial hybrid CGM-insulin bundles in affluent metropolitan areas.
North America contributed 38.97% of 2025 value, underpinned by mature reimbursement, broad internet penetration and high chronic-disease incidence. U.S. Centers for Medicare and Medicaid Services formalized codes for remote physiologic monitoring, accelerating physician adoption. Canada’s single-payer initiatives add incremental volumes, while Mexico’s private insurers trial hybrid CGM-insulin bundles in affluent metropolitan areas.
Europe maintains consistent adoption despite stringent MDR documentation. Germany’s Digital Care Act reimburses approved patches, France reimburses continuous glucose monitors, and Nordic payers pilot hormone-tracking devices in women’s health clinics. The U.K. leverages NHS test-beds for AI-enabled defibrillator patches, balancing budget pressure with preventative-care savings. Middle East and Africa show nascent uptake, concentrated in Gulf Cooperation Council digitization programs, while Latin America’s growth centers on private hospital chains in Brazil and Argentina.

Competitive Landscape
Market Concentration
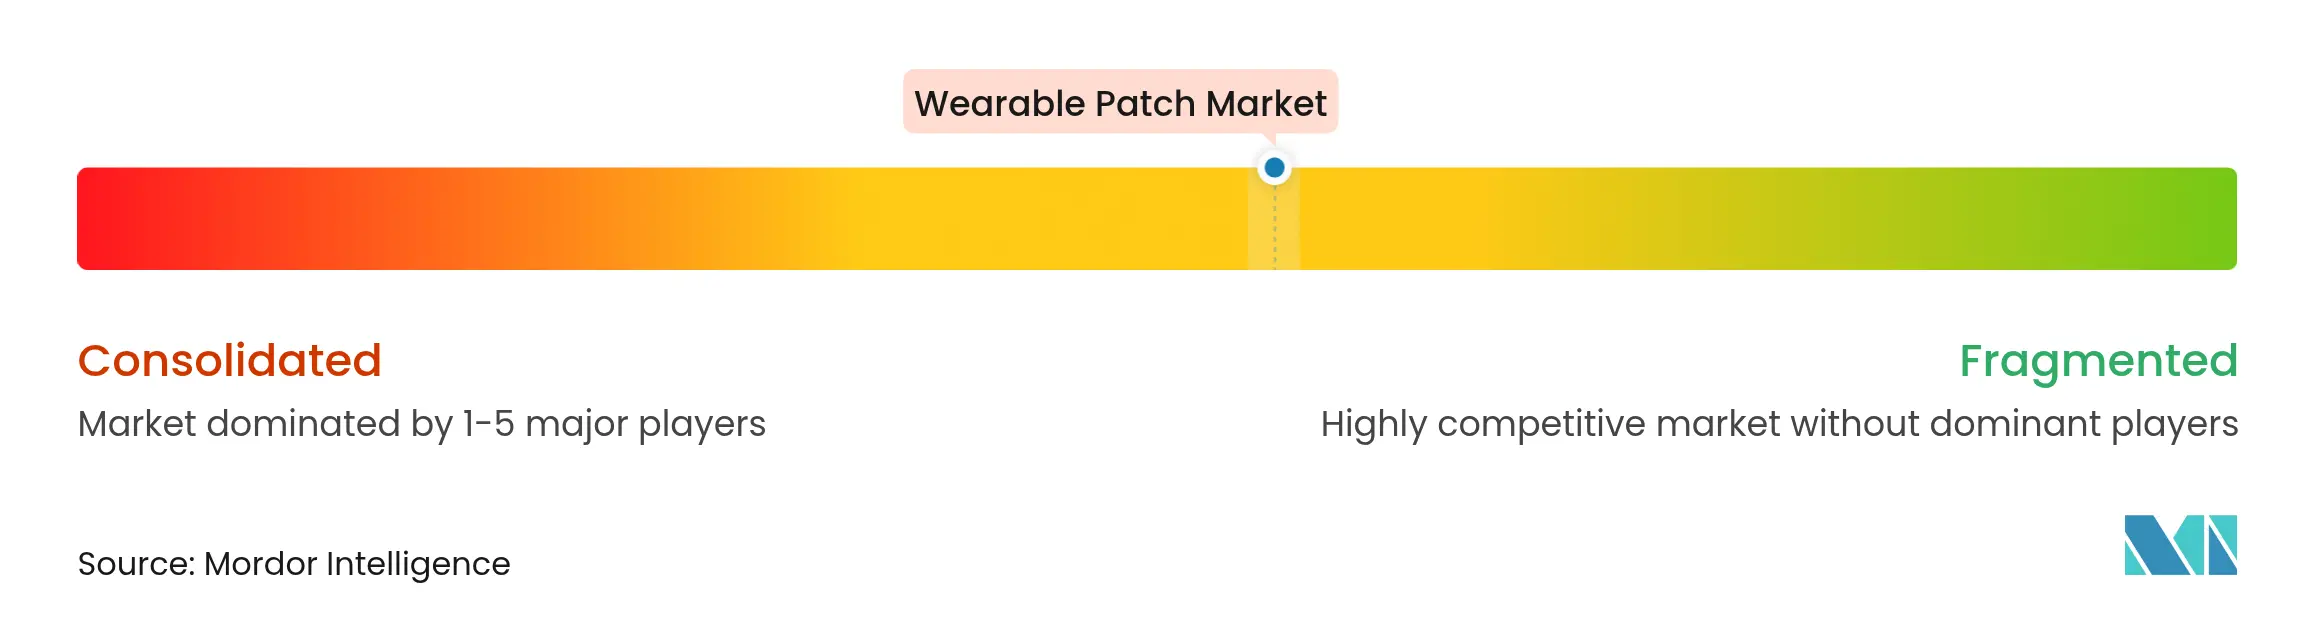
Top suppliers—Abbott, Dexcom and Medtronic—command durable channel advantages through scale manufacturing and cross-portfolio bundling. Abbott targets USD 10 billion Libre revenue by broadening indications and adding direct-to-consumer marketing. Dexcom doubled G6 output and links CGMs to insulin pumps for closed-loop control, while Medtronic’s MiniMed 780G and future patch pump improve pediatric diabetes management.
Specialists such as Biolinq, Element Science and Epicore Biosystems leverage unique sensing modalities to differentiate. Biolinq’s intradermal sensor removes daily fingerstick calibration, Element’s AI defibrillator advances sudden-cardiac-arrest prevention, and Epicore’s sweat patch addresses hydration monitoring for athletes and anti-doping agencies. These entrants often co-develop cloud analytics with CROs to position patches as endpoints in decentralized trials.
Strategic collaborations proliferate. Medable links Masimo wearables to eCOA platforms for data-rich virtual trials, and Tandem partners with Dexcom for integrated automated-insulin delivery. Supply-chain resilience rises in priority as chip shortages reveal single-sourcing risks; leading firms therefore sign multi-year foundry deals or in-house ASIC programs to secure future volumes, reinforcing competitive moats in the wearable patch market.
Wearable Patch Industry Leaders

*Disclaimer: Major Players sorted in no particular order
Recent Industry Developments
- May 2025: Epicore Biosystems secured an additional USD 6 million to expand sweat-sensing wearables in Asia Pacific.
- February 2024: Wellysis and Dozee began integrating S-Patch devices into 50,000 Indian hospital beds.
- January 2024: Wellysis and Dozee began integrating S-Patch devices into 50,000 Indian hospital beds.
Table of Contents for Wearable Patch Industry Report
1. Introduction
- 1.1Study Assumptions & Market Definition
- 1.2Scope of the Study
2. Research Methodology
3. Executive Summary
4. Market Landscape
- 4.1Market Overview
- 4.2Market Drivers
- 4.2.1Rapid Rise in Chronic Disease Prevalence
- 4.2.2Growing Demand for Home-Based Healthcare and RPM
- 4.2.3Miniaturisation and Flexible-Electronics Breakthroughs
- 4.2.4Reimbursement Expansion for Digital Therapeutics
- 4.2.5FemTech-Focused Patch Innovations
- 4.2.6Decentralised Clinical-Trial Adoption of Patches
- 4.3Market Restraints
- 4.3.1Limited Long-Term Accuracy & Data Reliability
- 4.3.2Fragmented Global Regulatory Pathways
- 4.3.3Adhesive-Induced Skin Irritation & Dermatitis
- 4.3.4Cyber-Security & GDPR/ HIPAA Compliance Hurdles
- 4.4Regulatory Landscape
- 4.5Technological Outlook
- 4.6Porter’s Five Forces Analysis
- 4.6.1Threat of New Entrants
- 4.6.2Bargaining Power of Buyers
- 4.6.3Bargaining Power of Suppliers
- 4.6.4Threat of Substitutes
- 4.6.5Intensity of Competitive Rivalry
5. Market Size & Growth Forecasts (Value)
- 5.1By Technology
- 5.1.1Connected Wearable
- 5.1.2Regular Wearable
- 5.1.3Hybrid Smart Patch
- 5.1.4Disposable Biosensor Patch
- 5.2By Application
- 5.2.1Monitoring and Diagnostics
- 5.2.2Drug Delivery
- 5.2.3Digital Therapeutics and Pain Management
- 5.2.4Fitness and Wellness
- 5.2.5Women’s Health / FemTech
- 5.3By Indication
- 5.3.1Clinical
- 5.3.2Non-clinical
- 5.4By Geography
- 5.4.1North America
- 5.4.1.1United States
- 5.4.1.2Canada
- 5.4.1.3Mexico
- 5.4.2Europe
- 5.4.2.1Germany
- 5.4.2.2United Kingdom
- 5.4.2.3France
- 5.4.2.4Italy
- 5.4.2.5Spain
- 5.4.2.6Rest of Europe
- 5.4.3Asia Pacific
- 5.4.3.1China
- 5.4.3.2Japan
- 5.4.3.3India
- 5.4.3.4Australia
- 5.4.3.5South Korea
- 5.4.3.6Rest of Asia Pacific
- 5.4.4Middle East and Africa
- 5.4.4.1GCC
- 5.4.4.2South Africa
- 5.4.4.3Rest of Middle East and Africa
- 5.4.5South America
- 5.4.5.1Brazil
- 5.4.5.2Argentina
- 5.4.5.3Rest of South America
6. Competitive Landscape
- 6.1Market Concentration
- 6.2Market Share Analysis
- 6.3Company Profiles (includes Global level Overview, Market level overview, Core Segments, Financials as available, Strategic Information, Market Rank/Share for key companies, Products & Services, and Recent Developments)
- 6.3.1Abbott Laboratories
- 6.3.2Medtronic plc
- 6.3.3Dexcom Inc.
- 6.3.4iRhythm Technologies Inc.
- 6.3.5Koninklijke Philips N.V.
- 6.3.6AliveCor Inc.
- 6.3.7Insulet Corporation
- 6.3.8Senseonics Holdings Inc.
- 6.3.9Epicore Biosystems
- 6.3.10GENTAG Inc.
- 6.3.11Pulsify Medical
- 6.3.12Qualcomm Technologies Inc.
- 6.3.13L’Oréal Group
- 6.3.143M Company
- 6.3.15VitalConnect Inc.
- 6.3.16Enable Injections Inc.
- 6.3.17Kenzen Inc.
- 6.3.18BioTelemetry (Philips)
- 6.3.19Tasso Inc.
- 6.3.20Nemaura Pharma plc
7. Market Opportunities & Future Outlook
- 7.1White-space & Unmet-Need Assessment
Research Methodology Framework and Report Scope
Market Definitions and Key Coverage
Our study defines the wearable patch market as flexible, single-use or multi-use electronic or drug-laden patches that adhere directly to the skin to sense, record, transmit, or administer therapeutics without a rigid housing. Included are connected and regular formats across clinical and non-clinical uses.
Out-of-scope: Large smartwatches, electrode arrays that rely on external straps, and cosmetic beauty patches are excluded.
Segmentation Overview
- By Technology
- Connected Wearable
- Regular Wearable
- Hybrid Smart Patch
- Disposable Biosensor Patch
- Connected Wearable
- By Application
- Monitoring and Diagnostics
- Drug Delivery
- Digital Therapeutics and Pain Management
- Fitness and Wellness
- Women’s Health / FemTech
- Monitoring and Diagnostics
- By Indication
- Clinical
- Non-clinical
- Clinical
- By Geography
- North America
- United States
- Canada
- Mexico
- United States
- Europe
- Germany
- United Kingdom
- France
- Italy
- Spain
- Rest of Europe
- Germany
- Asia Pacific
- China
- Japan
- India
- Australia
- South Korea
- Rest of Asia Pacific
- China
- Middle East and Africa
- GCC
- South Africa
- Rest of Middle East and Africa
- GCC
- South America
- Brazil
- Argentina
- Rest of South America
- Brazil
- North America
Detailed Research Methodology and Data Validation
Primary Research
To validate desk findings, our team interviewed clinicians experienced in remote patient monitoring, supply-chain managers at leading contract manufacturers, and digital-health insurers across North America, Europe, and Asia Pacific. These conversations clarified real-world average selling prices, adoption barriers, and near-term volume ramps, enabling sharper model assumptions.
Desk Research
Mordor analysts drew foundational numbers from tier-one public sources such as the US FDA 510(k) database, CDC chronic-disease trackers, International Diabetes Federation prevalence tables, UN Comtrade shipment codes for biosensor modules, and trade association releases from the Medical Device Manufacturers Association. Rounded insights on unit pricing and installed base trends were gathered from company 10-Ks, selected investor presentations, and reputable health-tech journals.
Paid repositories including D&B Hoovers for company financials and Dow Jones Factiva for deal flow supplemented gap areas.
These desk sources offered historic sales trajectories, reimbursement shifts, and regulatory approvals that frame the demand pool.
The list above is illustrative; many more outlets were consulted for corroboration and clarification.
Market-Sizing & Forecasting
A top-down reconstruction anchored on installed chronic-care populations, device penetration rates, and average patch replacement cycles set the value. Select bottom-up checks, such as sampled manufacturer shipments multiplied by blended ASPs, provided a tolerance band before totals were locked. Key variables in the model include diabetes prevalence, home-health reimbursement codes issued, MEMS sensor cost curves, and regulatory approvals granted per quarter.
For forecasting, a multivariate regression linked market revenue to those indicators, while scenario analysis captured upside from reimbursement expansion and downside from raw-material price spikes. Any gaps in supplier roll-ups were bridged with channel-check averages reviewed with domain experts.
Data Validation & Update Cycle
Outputs undergo variance testing against independent shipment data, anomaly reviews by a second analyst, and quarterly triggers that reopen models if material events occur. Reports refresh annually, and just before publication, an analyst updates figures so clients receive the latest view.
Why Our Wearable Patch Baseline Commands Trust
Benchmark comparison
Published estimates often diverge because analysts choose different device mixes, pricing bases, and refresh cadences.
Mordor's disciplined scoping and dual-track modeling reduce those swings for decision-makers.
| Market Size | Anonymized source | Primary gap driver | ||
|---|---|---|---|---|
USD 12.80 B (2025) | Mordor Intelligence | - | Anonymized source:Mordor Intelligence | Primary gap driver:- |
USD 10.64 B (2025) | Global Consultancy A | Narrower scope; excludes drug-delivery and regular patches | ||
USD 12.59 B (2025) | Trade Journal B | Uses flat 2023 ASPs and limited primary checks | ||
USD 15.00 B (2024) | Industry Data Aggregator C | Includes electronic skin and cosmetic patches, inflating baseline |